BTC USD 84,842.0 Gold USD 4,285.46
Time now: Jun 1, 12:00 AM

AUD/JPY : Daily Signal And Analysis from Instaforex

Is AUD/JPY ever going to drop? | Daily Forex Techical Analysis | 20th July 2017


AUD/JPY has been rising and rising and rising. Don't you think it's high time it starts to drop? We take a details look into the structure of AUD/JPY and perhaps, just perhaps, it's about to drop from here.
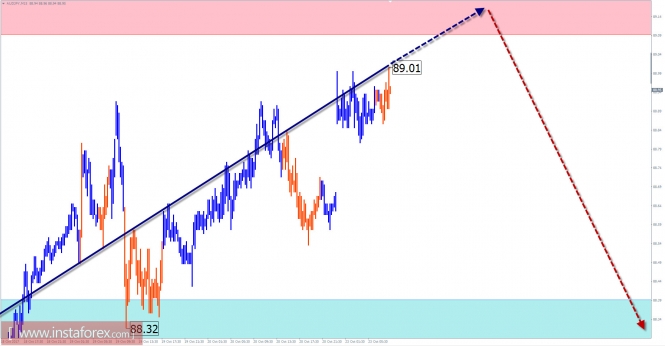
 
Overview of AUD / JPY with a forecast for the current day

The uptrend moves the price of the cross-currency pair Australian Dollar / Yen since June last year. In September, the pair's quotes reached the lower boundary of the large-scale potential turn area. The analysis of the structure of the wave shows its completeness. At the present time, there are no overlapping structures on the chart, capable of giving rise to a descending wave of a similar scale.

Today, the wave construction in the short-term time scale started on September 21. In its structure, the first part of the wave (A) is formed. The average, correcting part of the wave is close to completion.

Today, you can count on the completion of the current and the beginning of the oncoming phases of the movement. The resistance zone indicates the most likely area for changing trends. The price move down is more likely in the afternoon.

The boundaries of the resistance zones:

- 89.10 / 40

The boundaries of the support zones:

- 88.40 / 10

analytics59ed8a894da2f.jpg


Read more: https://www.instaforex.com/forex_analysis/192350
 
AUD/JPY testing major resistance, prepare to sell

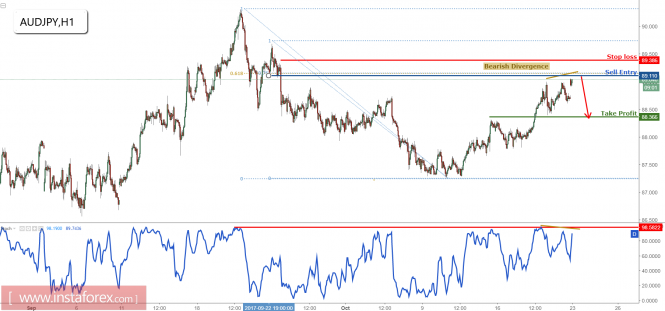
The price is approaching major resistance at 89.11 (Multiple Fibonacci retracements, horizontal pullback resistance, Fibonacci extension, bearish divergence) and we expect to see a short-term correction from this level to push the price down to at least 88.36 support (Fibonacci retracement, horizontal overlap support).

Stochastic (34,3,1) is seeing major resistance below 98% and we expect to see a strong reaction off this level. We're also seeing bearish divergence vs price signaling that a reversal is impending.

Sell below 89.11. Stop loss is at 89.38. Take profit is at 88.36.

analytics59ed484f5ee86.png
 
AUD/JPY dropped strongly, prepare to buy for a corrective bounce

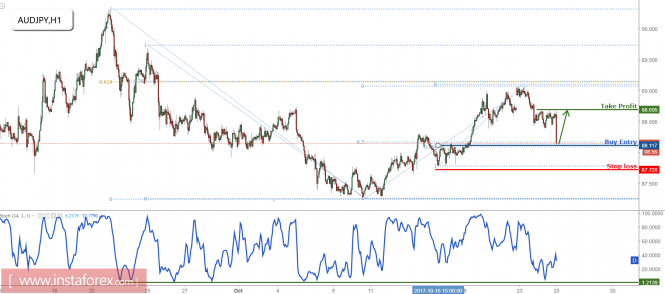
The price has dropped strongly and is now testing strong support at 88.11 (Fibonacci retracement, horizontal pullback support) and we expect to see a corrective bounce from here to at least 88.69 resistance (Fibonacci retracement, horizontal swing high resistance).

Stochastic (34,3,1) is seeing strong support above our 1.2% where we expect a corresponding bounce from.

Buy above 88.11. Stop loss is at 87.72. Take profit is at 88.69.

analytics59efe93e54472.png
 
Overview of AUD / JPY with the forecast for the current day

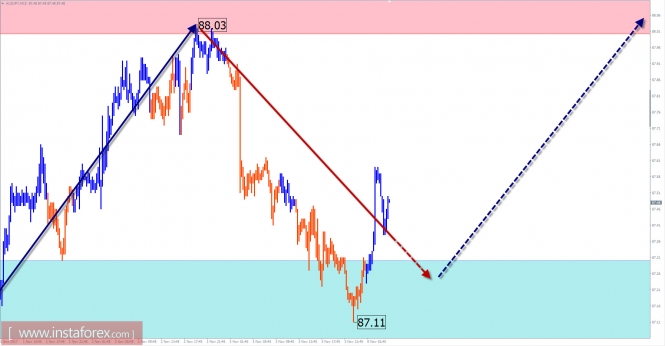
Over the past year and a half, the price of the cross pair is moving upwards. In the wave structure of the monthly chart scale, this area takes place the correction of the final descending wave pattern. The initial estimate of the target level indicates the limited potential for the pair's growth rate.

On a smaller hourly scale, the direction is set by the downward wave of September 21. The structure has formed clearly an expressed zigzag. By the beginning of the current month, the price had reached the upper limit of the potential reversal zone. The growth of prices during the last days forms an upward correction and increase the wave level of the current construction.

Today, the overall upward trend in price fluctuations is highly expected. In the morning, a short-term decline is already ruled out.The resistance zone is the level greatly expected to end the daily volatility.

Boundaries of resistance zones: - 88.00 / 88.30

Boundaries of support zones: - 87.30 / 87.00

analytics59ffd8a1a8598.jpg
 
Fundamental analysis of AUD/JPY for November 9, 2017

AUD/JPY has been very volatile and corrective at the edge of 87.30-50 event area. AUD has been struggling with the mixed economic reports whereas JPY is also found to be facing hard times with recently published worse economic reports. Today Japan's Bank Lending report was published with a decreased value at 2.8% from the previous value of 2.9% which was expected to increase to 3.0%, the Core Machinery Orders report was published with negative value of -8.1% which previously was positive at 3.4% and was expected to be at -1.8%. Besides, the Current Account report was also published with worse figure at 1.84T which previously was at 2.27T and expected to be at 2.05T.

On the AUD side, today Home Loans report was published with a negative value of -2.3% which previously was positive at 1.5% and was expected to increase to 2.5%. The massive downfall of the economic report today can lead AUD to lose some grounds against JPY despite the worse economic reports from Japan published today. As of the current scenario, AUD is weaker in comparison to JPY and it is expected that JPY is going to gain further taking the price much lower in the coming days.

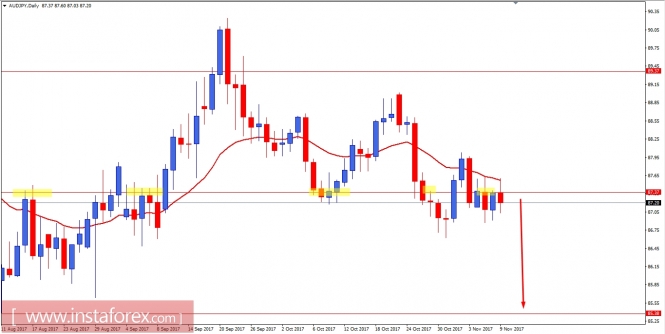
Now let us look at the technical view. The price is currently correcting itself at the edge of the event area of 87.30-50 area. The price is also being resisted by the dynamic level of 20 EMA along with the horizontal level resistance which is expected to push the price lower towards 85.50 support area in the coming days. As the price remains below 88.00 resistance area, the bearish bias is expected to continue further.

analytics5a040931c528f.jpg
 
AUD/JPY testing major support, time to buy for a corrective bounce

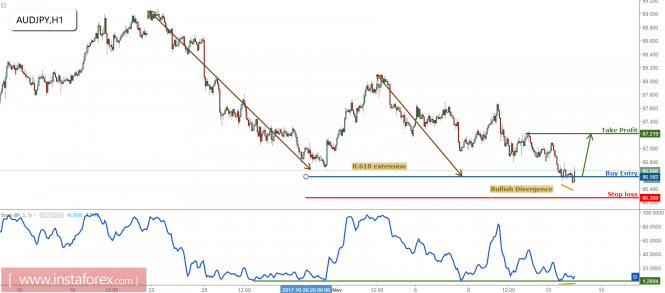
The price has dropped strongly and is now testing a major support level at 86.58 (Fibonacci extension, long-term Fibonacci retracement, fake horizontal breakout). We look to buy above this level for a corrective bounce to at least 87.21 resistance (Fibonacci retracement, Fibonacci extension, horizontal swing high resistance, bullish divergence).

Stochastic (89,3,1) is seeing strong support above 1.2% and also sees bullish divergence vs price signaling that a bounce is impending.

Buy above 86.58. Stop loss is at 86.26. Take profit is at 87.21.

analytics5a0a45fd9156c.png
 
AUD/JPY continues to test major support, remain bullish

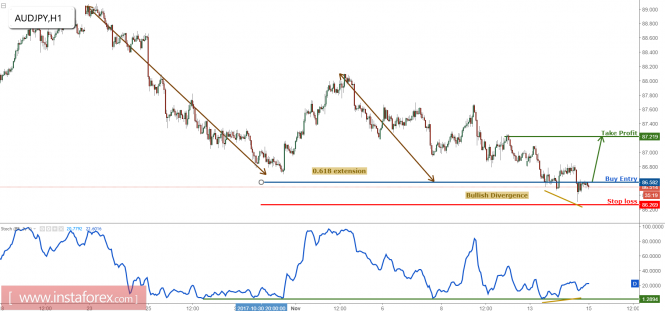
The price continues to whipsaw and continues to be testing our major support level at 86.58 (Fibonacci extension, long-term Fibonacci retracement, fake horizontal breakout). We look to buy above this level for a corrective bounce to at least 87.21 resistance (Fibonacci retracement, Fibonacci extension, horizontal swing high resistance, bullish divergence).

Stochastic (89,3,1) is seeing strong support above 1.2% and also sees bullish divergence vs price signaling that a bounce is impending.

Buy above 86.58. Stop loss is at 86.26. Take profit is at 87.21.

analytics5a0b9a0a460b8.png
 
Overview of AUD / JPY with the forecast for the current day

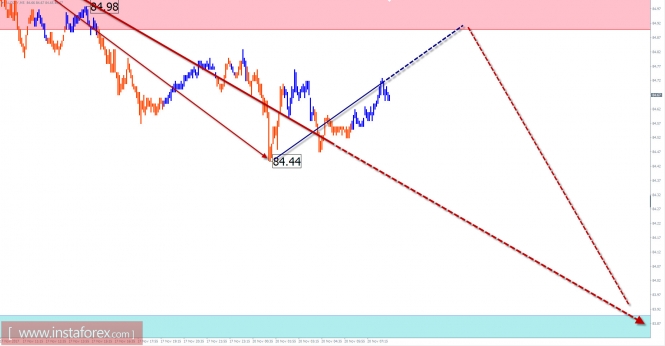
The direction of the AUD/JPY cross currency pair in the short-term trading is set to have a downward wave of September 21. The wave was formed after a larger upward model with a potential reversal zone coincided with the preliminary target site. The upper limit of the nearest potential completion zone is within the price figure from the current level.

In the next session, there will most likely be a flat movement with an ascending vector. The bullish plot is needed to complete the completely closed correction whereas the swing range is expected to be minimal. There is a chance to return to the ascending price movement of the main rate. On the other hand, the volatility of the instrument can dramatically increase.

Boundaries of resistance zones:

- 84.90 / 85.20 Boundaries of support zones:

- 83.90 / 60

analytics5a1278b46ebf5.jpg
 
Fundamental Analysis of AUD/JPY for November 24, 2017

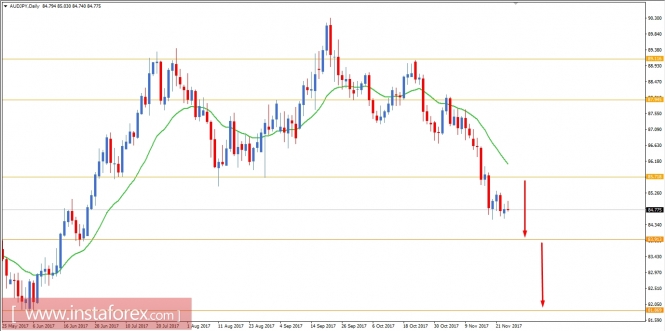
AUD/JPY has been quite corrective recently residing in the middle of the range from 84.00 to 85.70. AUD has been weaker amid recent economic reports and the infrastructure that pushed AUD down against JPY in comparison. This week, AUD has found minor support from the economic reports like Construction Work which showed an increase to 15.7% from the previous value of 9.8%. The positive economic report did not quite prove itself to be effective for the gains against JPY, leading to further correction in the market. On the JPY side, after the observance of Thanksgiving Day, today Flash Manufacturing PMI report was published with an increase to 53.8 from the previous figure of 52.8 which was expected to decrease to 52.6 that encouraged JPY to gain good momentum against AUD, leading to bullish rejection in the pair. As of the current scenario, JPY is expected to gain further momentum in the pair in the coming days against AUD amid better economic reports from Japan with market sentiment on the side. Moreover, if AUD cannot present better economic reports in the coming weeks, then the bearish bias of the market is expected to continue further.

Now let us look at the technical chart. The price is currently residing in the range of 84.00 to 85.70 with bullish rejection today which signals further bearish pressure in the pair. As the price remains below 85.70 resistance area and dynamic level of 20 EMA, the bearish bias is expected to continue further with a target towards 84.00 in the future.


analytics5a17f063651a0.jpg
 

Live Forex Chart

Currency
Rates
EUR / USD
1.14250
USD / JPY
157.245
GBP / USD
1.32505
USD / CHF
0.82827
USD / CAD
1.41455
EUR / JPY
179.652
AUD / USD
0.70550
Back
Top
Log in Register