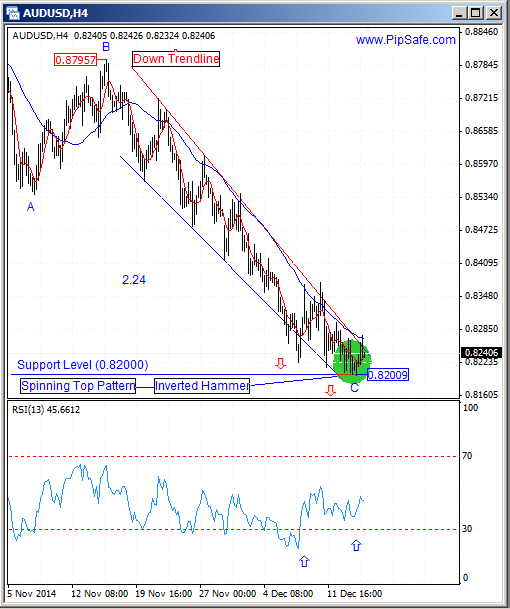
AUD/USD was in a strong and consistent downtrend during the recent weeks that sellers were successful in obtaining the lowest price of 0.82000. price with reaching to the supportive level which is shown in the picture below ( made of 4 bottom prices) and the important round level of 0.82000 has stopped from more descend( sellers used this level to exit their trades) and with formation of a bottom price in H4 time frame has prepared a field for ascending of price.
As it is obvious in the picture below, between the top price of 0.87957 and bottom price of 0.82009 there is ABC harmonic pattern with ratio 2.24 that warns the potential of ascending from the C point of this pattern.RSI indicator is in saturation sell area in daily and H4 time frame that confirms the harmonic C point and warns about changing price direction during the next candles.Generally until the bottom price of 0.82009 is preserved, the price has the potential for ascending in this currency pair.
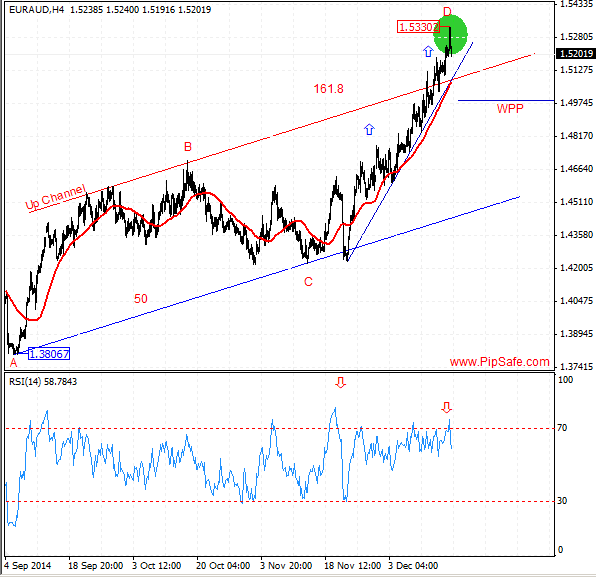
EUR/AUD was in a strong and consistent uptrend during the recent weeks that Buyers were successful in obtaining the highest price of 1.53302.Currently price in long term time frames such as monthly and weekly is above 5-day moving average and warns more ascending in long term interval.As it is obvious in the picture below, between the top price of 1.53302 and bottom price of 1.38067 there is AB=CD harmonic pattern with ratios of 50 and 161.8 that warns the potential of descending from the D point of this pattern.
RSI indicator is in saturation BUY area in h4 and daily time frames and in divergence mode with the price chart that warns about changing price direction during the next days.According to the current situation there is not any clear reason about descending of price in long term time frames such as monthly,weekly and daily. The least sign for descending of price is formation of a top price and recording of it in daily time frame.
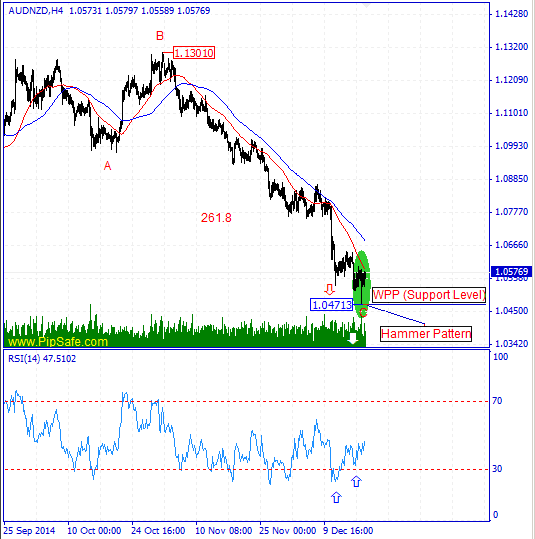
AUD/NZD during the recent weeks was in a strong and consistent downtrend that Sellers were successful in achieving the lowest price of 1.04713.Price has been stopped from more descend by reaching to the specified support levels(261.8 and WPP) in the picture below and with exit of some Sellers from their trades, the ideal Hammer (H4) and Spinning Top candlestick(Daily) patterns have been created. These candles shows vulnerability and indecision market in ascending or descending of price that for confirmation it needs closing of a bullish candle.
As it is obvious in the picture below, between the top price of 1.13010 and bottom price of 10.4713 there is ABC harmonic pattern with ratio of 261.8 that warns the potential of ascending from the C point of this pattern.RSI indicator is in saturation sell area in daily(also h4) time frame and in divergence mode with the price chart that warns about changing price direction during the next days. The first important warning for ascending of price is breaking of the 1.05998 resistance level(the highest level of price changes in previous day).
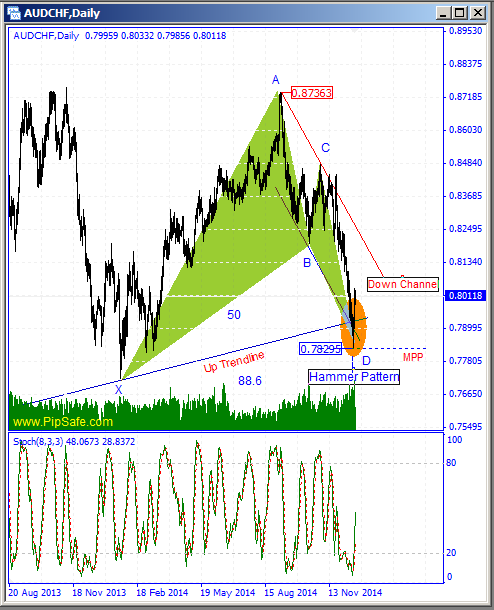
AUD/CHF during the recent weeks was in an descending trend that Sellers were successful in reaching to the lowest price of 0.78295.The price has stopped from more descend by reaching to the support edge of down channel(also Monthly s3 pivot point) and a bottom price was created on the support line by the Sellers retreat.Right now the price level of 0.78295 is known as a bottom price by closing of the ascending candle.
As it is obvious in the picture below, there is a harmonic Bat pattern between the bottom price of 0.78295 and the top price of 0.87363 that there is a potential for changing price direction from D point of this pattern.Stoch indicator in daily time frame is in saturation sell area and confirms the D point of Bat harmonic pattern and make the potential for a price upside possible.Generally until the price level of 0.78295 is preserved, price will have the potential for reformation and ascending.
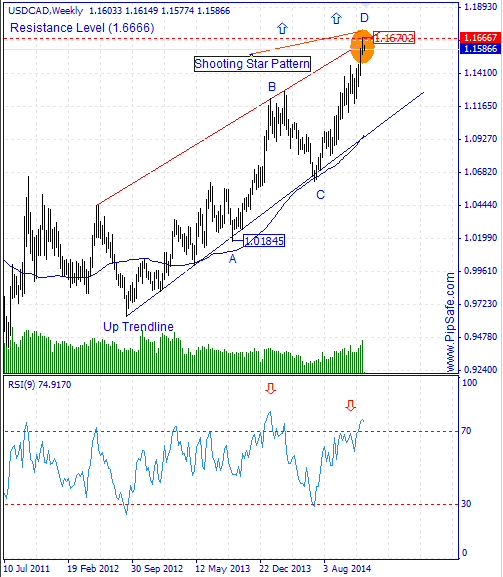
USD/CAD during the recent week was in a strong and consistent uptrend that buyers were successful in achieving the highest price of 1.16702. Right now price in long time frames such as monthly, weekly and daily is above 5-day moving average and warns about price increase in long period of time.According to the formed movements in the previous week, there is a Shooting Star candlestick pattern which shows indecision marker for ascending or descending and there is a warning for stopping of more ascending which need the confirmation by the next bearish candle.
According to the formed price movements in the chart, between the bottom price of 1.01845 and top price of 1.16702 , there is AB=CD harmonic pattern with ideal ratios of 61.8 and 161.8 that with completion of the D point there will be a warning for descending of price. RSI indicator in weekly time frame is in saturation Buy area and also in divergence mode with the price chart warns about changing price direction.Generally until the mentioned top price on the resistance channel edge is preserved , the price has the potential for reformation and descending in this currency pair.
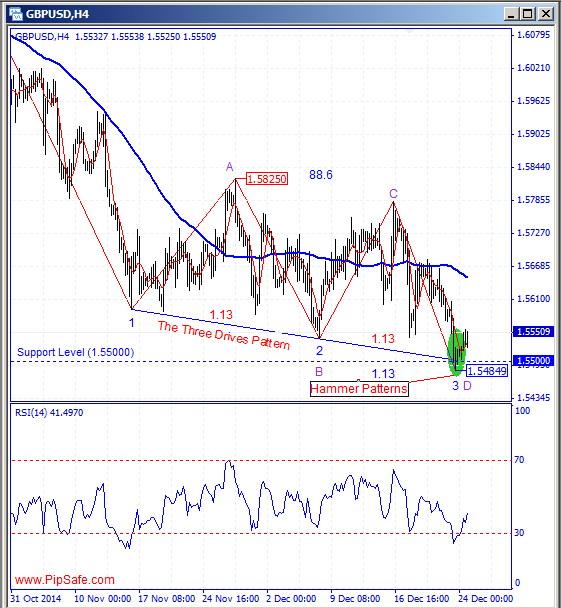
GBP/USD had an descending trend without a noticeable reformation during the recent weeks that shows Sellers certainty in reaching to the predetermined targets.The price could record the Bottom price of 1.54849 in 4H time frame which is fixed by ascending candle(Hammer Patterns).As it is obvious in the picture below, price during the descending has touched the Support Level (made of 2 bottom prices) and also the round supportive level of 1.55000 and has created the hammer candlestick patterns.
According to the formed movements in the chart, there is AB=CD harmonic pattern (Also the The Three Drives Pattern) with ideal ratios of 88.6 and 1.13 between top price of 1.58250 and the bottom price of 1.54849 that warns about changing price direction from the D point of this pattern.RSI indicator is in saturation Sell area and confirms the D point of this pattern by the next cycle and warns about the potential of ascending of the price during the next days.One of the important warnings for ascending of the price is formation of the candlestick pattern in daily time frame or closing of a ascending candle which prepares the field for ascending of the price.
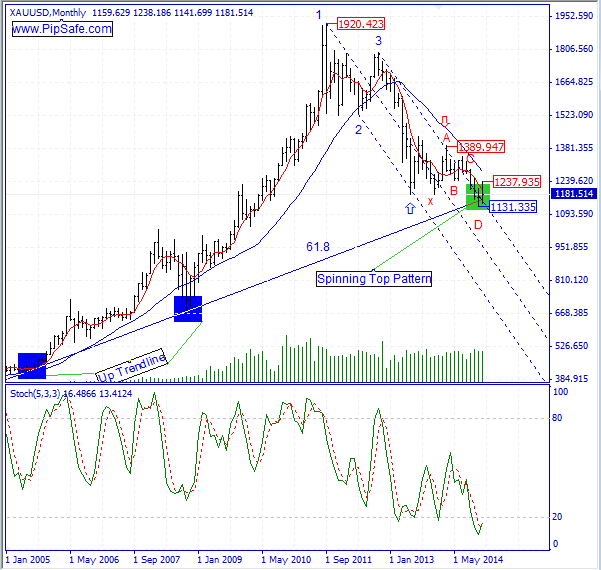
Price since the end of 2011 till now was in strong and consistent downtrend with a little price reformation and sellers were successful in achieving the lowest price of 1131.335.Price has formed a bottom price(Spinning Top Pattern) with reaching to the specified supportive levels(Up Trendline and d point of harmonic pattern) in the picture below and it has stopped from more descend and has started a little ascend with shows exit of some sellers from their trades.
As it is obvious in the picture below, there is a harmonic butterfly pattern between the bottom price of 1131.335 and the top price of 1389.947 that there is a potential for changing price direction from D point of this pattern.Stoch indicator in Monthly time frame (also in daily time frame) is in saturation sell area and with the next cycle warns about ascending of price during the next candles.Generally until the third point of Up Trendline is preserved, the price has the potential for ascend and reformation in this Metal.
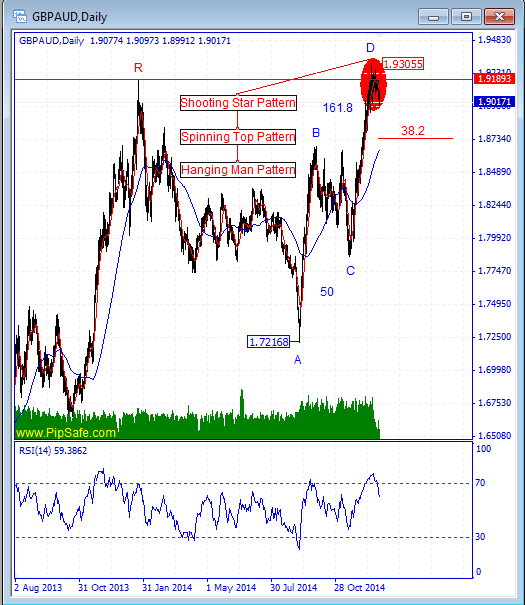
GBP/AUD during the recent weeks could ascend without reformation and record the top price of 1.93055.Formation of Shooting Star and Hanging Man and Spinning Top candlestick patterns with thin body in red area shows indecision market and vulnerability of ascending trend.As it is obvious in the picture below, according to the formed movements , the AB=CD harmonic pattern with the ratios of 50 and 161.8 is formed and by completing the D point of this pattern, there is a warning for descending in this currency pair.RSI indicator in weekly time frame is in saturation Buy area and warns the possibility of stopping of the ascending trend by the next cycle.Generally until the top price of 1.93055 is preserved, the price has the potential for descending and reformation.
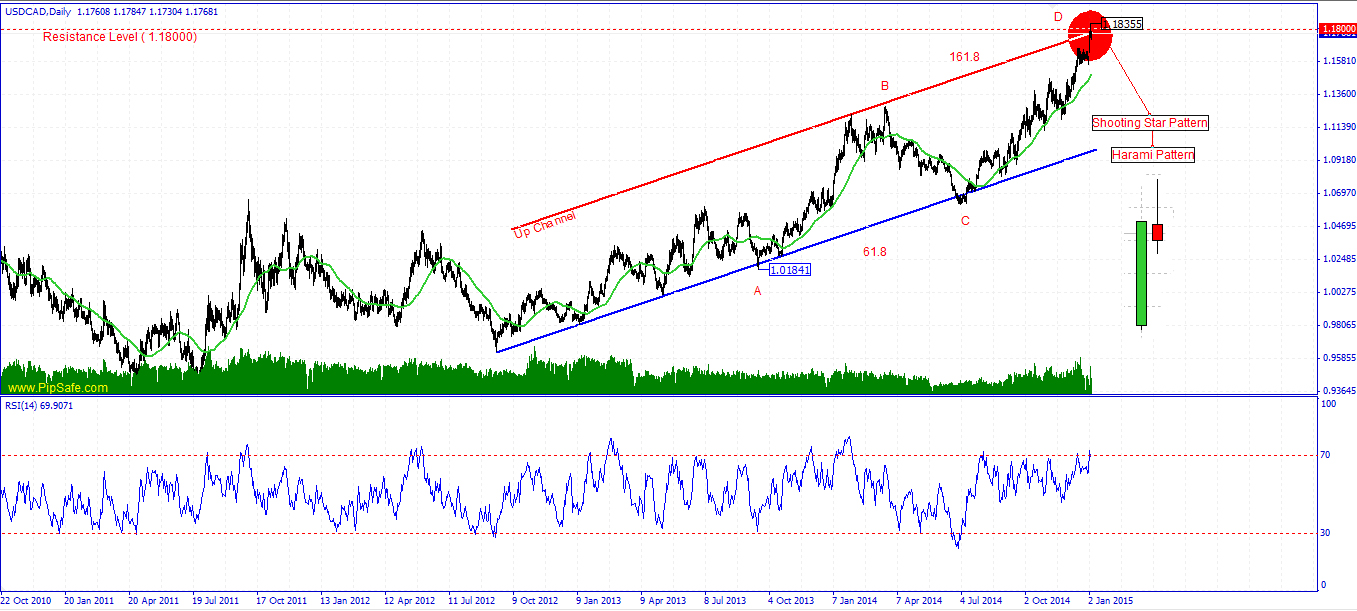
USD/CAD was in a strong and consistent uptrend during the recent weeks that buyers were successful in achieving the highest price of 1.18355.Price by reaching to the round resistance level of 1.18000 and the resistance edge of up channel has stopped from more ascend that shows buyers used this price level to exit their trades.There are Shooting Star candlestick pattern and also Harami Pattern in top price of 1.18355 that warns the potential for formation of a successful top price and Vulnerability of ascending trend for buyers.With close of the next bearish candle, this signal will be fix.
As it is obvious in the picture below, there is AB=CD harmonic pattern with ratios of 61.8 and 161.8 between the bottom price of 1.01841 and the top price of 1.18355 that warns changing price direction from D point.RSI indicator in Daily time frame is in saturation buy area and warns about descending of price according to the next cycle during the next days.(and confirms the harmonic D point)Generally until the Top price of 1.18355 is preserved, there is the possibility of decrease and descend of price in this currency pair.
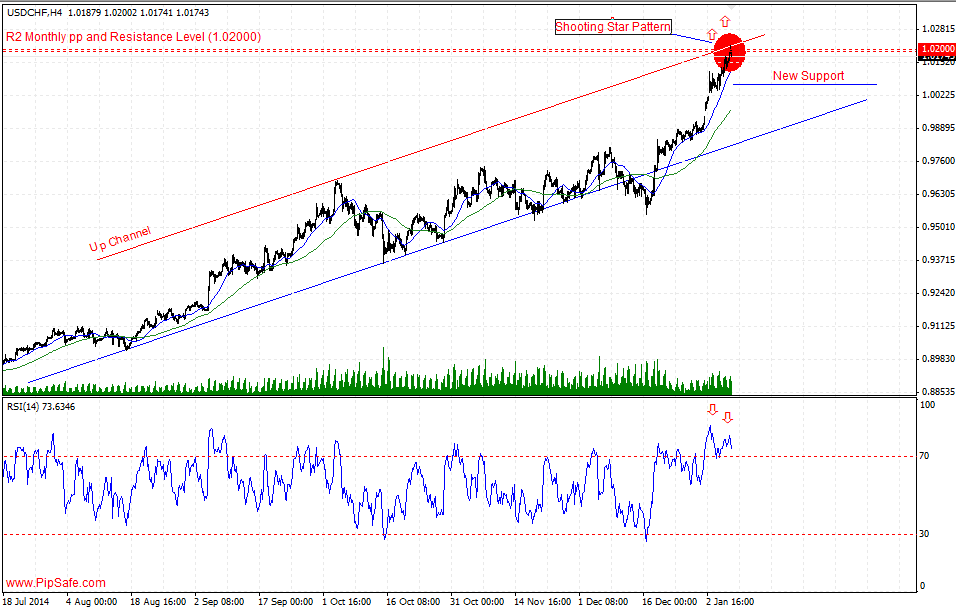
USD/CHF chart has experienced a strong ascending trend during the recent days that could record the top price of 1.02117.One of the buyers’ targets was the round level of 1.02000 that they were successful in reaching to it and the price was not able to ascend more by reaching to this level.Right now the price has reached to the resistance level of Monthly Pivot 2 and with forming Shooting Star candlestick pattern warns about formation of a top price (need to be confirmed by a bearish candle).
According to the recent strong ascending, price is in saturation buy area and there is the potential for descending and price reformation.RSI indicator is in saturation buy area and in divergence mode with the price chart in h4 time frame that confirms the current top price and warns changing price direction during the next candles.The first warning in this currency pair for ascending of price (in the same direction of long term time frames) is breaking of the resistance level of 1.02117.