BTC USD 81,493.8 Gold USD 4,378.12
Time now: Jun 1, 12:00 AM

Forex Technical Analysis(PipSafe)

PipSafe

Fun Poster
Messages
113
Joined
Jun 4, 2014
Messages
113
Reaction score
0
Points
10
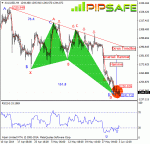
Gold was in a strong and consistent downtrend during the recent Days that sellers were successful in obtaining the lowest price of 1241.712.Currently price in long term time frames like weekly and daily time frames is under 5 day moving average which shows a consistent descending trend in long period of time. As it is obvious in the picture below between the top price of 1330.949 and the bottom price of 1241.712, there is a none AB=CD harmonic pattern with the ratios of 76.4 and 161.8 that with completion of the D point (also formation of butterfly pattern), there is a potential for ascending of price.RSI indicator is in saturation sell area and divergence mode with the price chart that confirms the current bottom price and warns about ascending of price during the next candles. According to the current condition of price, the first warning for Ascending of price is breaking of the resistance level of 1250.826.

Technical Analysis of Gold dated 2014.06.03
 

Attachments

  • 30.7 KB Views: 51
gold

http://cari.gold

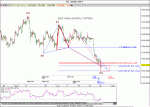
As you can see on the chart, there are 3 consequent patterns have been formed. The capital ABCD are Butterfly and Deep Crab patterns which is expected to see a demand rise up by having its time fulfilled around $1239-$1248.

:)
 

Attachments

As it was mentioned in the Previous analyzes of this currency pair according to the formed signs, there was a potential for ascending of price which finally happened. Buyers were successful in achieving the highest price of 1.10350.As it was mentioned in the previous technical analysis of this currency, in long period of time there is good potential for growth of price and Currently price in long term time frames such as monthly and weekly is above 5-day moving average and warns more ascending in long term interval. Price by reaching to the resistance edge of Up Channel (2 patterns) has stopped from more ascend that shows buyers used this price level to exit their trades.

As it is obvious in the picture below, there is an AB=CD harmonic pattern between the bottom price of 1.05421 and the top price of 1.10350 with none-ideal ratios of 61.8 to 127.2 that warns about descending of price from the D(also formation else of AB=CD pattern in CD wave), point of this pattern. Stoch indicator is in saturation sell area and confirms the current top price, also wars about formation of a top price but because of lack of coordination with the Weekly and Monthly time frames is not much valid. The first warning for ascending of the price in current condition is breaking of the Resistance level of 1.10000.

Technical Analysis of AUD/NZD dated 2014.06.09

7666904_jijj_153560.gif
 
As it was mentioned in the previous technical analysis of Gold dated 2014-06-03, according to the formed technical signs, there was the potential for ascending of price which finally happened. Buyers were successful in achieving the highest price of 1263.59 .Right now price is above 5-day moving daily time frame that show an uptrend during the next candles. According to the formed movements in price chart, between the top price of 1388.86 and the bottom price of 1240.73, there is a none-ideal AB=CD harmonic pattern with the ratios of 50% and 161.8% that warns about ascending of price from D point.
Stoch indicator with the ascending cycle confirms the D point of AB=CD harmonic pattern and warns about the potential of ascending during the next candles. If price rises and buyers success first of the price targets would be alterant level (Change of polarity)of 1269.54.Right now in long term time frames such as Monthly and weekly, there is not any clear reason for decreasing of the price and generally until the mentioned bottom price is preserved, there is the potential for downtrend reformation.

Technical Analysis of Gold dated 2014.06.10


2942349_cjdm_989175.jpg
 
GBP/AUD chart has experienced a descending trend during the recent Days that could record the bottom price of 1.78312. One of the sellers’ targets was the support zone of 1.78304 that they were successful in reaching to it and right now ,the price was not able to descend more by reaching to this level. By forming a Hammer candlestick pattern in mentioned bottom price, there is a potential for creating a bottom price and ascending of price.

In H4 time frame of this currency pair there is Butterfly harmonic pattern between the Top price of 1.81403 and the bottom price of 1.78312 that with completing the D point of this pattern , there is a warning for changes in price.RSI indicator is in saturation Sell area and in divergence mode with the price chart warns about changing price direction during the next candles. If price rises and buyers success first of the price targets would be Down trendline that is obvious in the picture below. Generally according to the formed signs in the chart, until the bottom price of 1.78312 is preserved, price has the potential to correction.

Technical Analysis of GBP/AUD dated 2014.06.11
4643138_icfl_883810.jpg
 
EUR/GBP during the recent Days was in a consistent down trend that sellers were successful in achieving the lowest price of 0.80316.Currently price in monthly and weekly time frames is under 5-day moving average that shows descending of price during the next candles (long term). Price during the downfall with reaching to the supportive level of down channel and Fibonacci level of 161.8 ABC pattern has stopped from more descend and has formed a bottom price (harami pattern) in the level of 0.80316.RSI indicator is in saturation sell area and in divergence mode with the price chart and confirms the bottom price and warns about changing price direction during the next candle. Generally until the supportive level of 0.80316 is preserved, there is the possibility of the price reformation.

Technical Analysis of EUR/GBP dated 2014.06.12

8410777_mkla_182852.jpg
 
AUD/CHF was in a strong and consistent uptrend during the recent months that Buyers were successful in obtaining the highest price of 0.84784.Currently price in monthly, weekly and daily time frames is above 5-day moving average that shows a consistent ascending trend with the potential of more increment in long period of time. In 4H time frame as it is obvious in the picture below , there is Wolf wave pattern and warns the descending of price to the Target line .

According to the formed movements in chart of this currency pair, there is AB=CD (2 Patterns)harmonic pattern with none-ideal ratios of 61.8 and 127.2 between bottom price of 0.81149 and the top price of 0.84784 that by completion of the D point in this pattern, there is warning for ascending of the price and changing price direction. Right now the first warning for descending of the price (in the same direction with harmonic pattern’s signal) is breaking of the supportive level of 0.84092.

Stoch indicator is in saturation Buy area in H4 time frame and in divergence mode with the price chart that confirms the TOP price of 0.84784 warns about changing trend direction. Generally according to the current situation in 4H time frame until the top price of 0.84784 is preserved, price will have the potential of descending but according to the potential of ascending in long period of time, the descending of price is temporary and unstable.


Technical Analysis of AUD/CHF dated 2014.06.13
445272_ejkm_227827.jpg

 
GBP/CHF since 2014.03.17 till now was in a uptrend that Buyers were successful in achieving the highest price of 1.53000. Right now in long term time frames such as monthly and weekly, price is closed above 5-day moving average that shows a consistent uptrend and more ascending in long period of time. Price has been stopped from more ascending with reaching to the resistance edge of up channel technical pattern and also the resistance round level of 1.53000(Buyers use this lever to exit their trades) and starts to descend. As it is obvious in the picture below, there is an AB=CD harmonic pattern between the bottom price of 1.47799 and the top price of 1.53000 with ideal ratios of 0.382 to 2.24 that warns about descending of price from the D point of this pattern.

Currently in 4H time frame with formation of Shooting star (the failure of buyers in reaching to the higher prices) and Engulfing candlestick pattern, price has been stopped from more ascending and there is a possibility of formation of a top price and finally descending of the price. Stoch indicator in 4H time frame is in saturation buy area and with the next cycle warns about descending of price during the next candles. Currently the first important warning for descending of price is breaking of the support level of 1.52387. Generally until the mentioned top price is preserved, there is the potential for uptrend reformation.

Technical Analysis of GBP/CHF dated 2014.06.16

7003999_mnkl_881789.jpg
 
As it was mentioned in the previous technical analysis of USD/CAD pair dated 2014.04.07, according to the formed technical signs, there was the potential for descending of price which finally happened. As it is obvious in the picture below, price during the descending has touched the Up trendline (made of 2 bottom prices) has created the inverted hammer candlestick pattern. Closing of the bullish candle after this pattern will confirm it and warns about ascending of price. In daily time frame and weekly Stoch indicator is in saturation sell area and with the next cycle warns about the ascending of price from the bottom price of 1.08358.The first warning for ascending of price is breaking of the resistance level ( or the yesterday highest price change) 1.08743.Generally according to the current situation of the price chart in daily time frame until the third point of Up trend line is preserved, the price will have the potential to ascend and pass the mentioned bottom price.

Technical Analysis of USD/CAD dated 2014.06.17

1210747_djgm_240628.jpg
 
EUR/NZD was in a strong and consistent downtrend during the recent days that sellers were successful in obtaining the lowest price of 1.55616.price with reaching to the supportive level which is shown in the picture below ( made of 2 bottom prices) and the round level of 1.5555 has stopped from more descend( sellers used this level to exit their trades) and with formation of a bottom price in daily time frame has prepared a field for ascending of price. Formation of Inverted hammer and hammer candlestick patterns with thin body in green area shows indecision market and vulnerability of descending trend.

As it is obvious in the picture below, between the top price of 1.62873 and bottom price of 1.55616 there is AB=CD harmonic pattern with IDEAL ratios of 78.6 and 127.2 that warns the potential of ascending from the D point of this pattern. Stoch indicator in daily time frame is in saturation sell area and warns the potential for ascending and reformation according to the next cycle. Generally according to the current situation, until the bottom price of 1.55616 is preserved, there is the potential for ascending of price and reformation of descending trend.

Technical Analysis of EUR/NZD dated 2014.06.18

9436860_emjh_637219.jpg
 

Live Forex Chart

Currency
Rates
EUR / USD
1.14885
USD / JPY
156.877
GBP / USD
1.33950
USD / CHF
0.82210
USD / CAD
1.39985
EUR / JPY
180.229
AUD / USD
0.71330
Back
Top
Log in Register