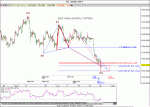
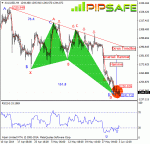
Gold was in a strong and consistent downtrend during the recent Days that sellers were successful in obtaining the lowest price of 1241.712.Currently price in long term time frames like weekly and daily time frames is under 5 day moving average which shows a consistent descending trend in long period of time. As it is obvious in the picture below between the top price of 1330.949 and the bottom price of 1241.712, there is a none AB=CD harmonic pattern with the ratios of 76.4 and 161.8 that with completion of the D point (also formation of butterfly pattern), there is a potential for ascending of price.RSI indicator is in saturation sell area and divergence mode with the price chart that confirms the current bottom price and warns about ascending of price during the next candles. According to the current condition of price, the first warning for Ascending of price is breaking of the resistance level of 1250.826.
Technical Analysis of Gold dated 2014.06.03
Technical Analysis of Gold dated 2014.06.03
Attachments
-
 30.7 KB Views: 52