GBP/USD during the recent week was in a strong and consistent downtrend that sellers were successful in achieving the lowest price of 1.55900.Right now price in long time frames such as monthly, weekly and daily is under 5-day moving average and warns about price increase in long period of time. As it is obvious in the picture below, price during the descending has touched the round supportive level of 1.56000 and has created the hammer candlestick pattern(in daily time frame).
According to the formed price movements in the chart, between the top price of 1.65229 and bottom price of 1.55900,there is AB=CD harmonic pattern with none- ideal ratios of 50 and 161.8 (also at CD wave there us another pattern with ratios of 38.2 and 2.24) that with completion of the D point there will be a warning for ascending of price. As it is obvious in the picture below, Stoch indicator is in saturation sell area and warns about ascending of the price during the next candles.
GBP/NZD during the recent days had a descending trend that could record the bottom price of 1.96181. as it is obvious in the picture below, the price by reaching to the long term ascending trend line ( made of 4 bottom prices)has been stopped and the sellers were unable to pass this support line.
According to the formed price movements in the chart, there is a Gartley harmonic pattern between the bottom price of 1.96181 and top price of 2.10508 that warns about ascending of the price with completion of this pattern ending point. Stoch indicator is in saturation sell area in daily time frame that confirms the harmonic D point and warns about changing price direction during the next candles. Generally according to the formed signs in price chart, until the bottom price of 1.96181 is preserved, there is a potential for reformation and ascending of the price in this currency pair.
Technical Analysis of GBP/NZD Dates 2014.11.19
GBP/NZD Technical Analysis
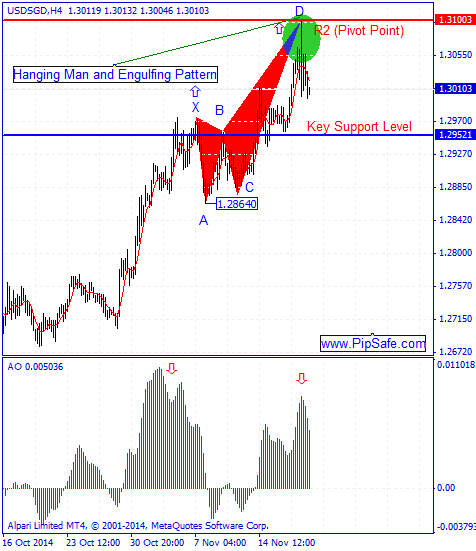
USD/SGD during the recent week was in a strong and consistent uptrend that buyers were successful in achieving the highest price of 1.31003.Right now price by reaching the R2 WPP and also by creating a peak price in 4H time frame has been stopped from more ascend. By forming a Hanging Man and engulfing candlestick pattern in mentioned top price, there is a potential for creating a top price and then descending.
As it is obvious in the picture below, there is a deep crab harmonic pattern between the bottom price of 1.28640 and the top price of 1.31003 that there is a potential for changing price direction from D point of this pattern.Ao indicator is in divergence mode with the price chart that confirms the current top price and warns about descending of price during the next candles.Generally until the top price level of 1.31003 is preserved, price will have the potential for reformation and descending.
Technical Analysis of USD/SGD Dates 2014.11.20
USD/SGD Technical Analysis
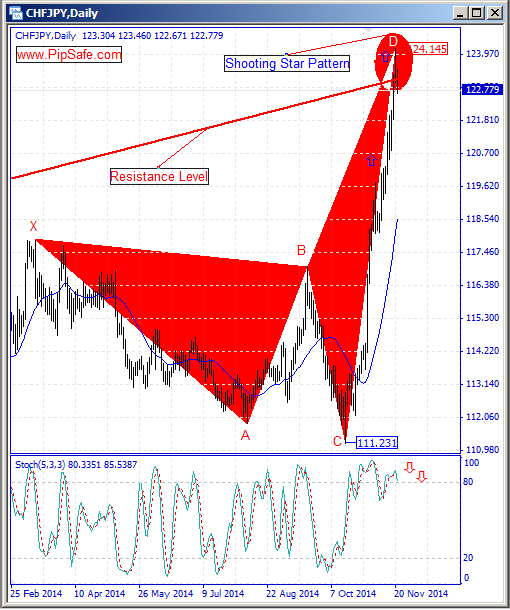
CHF/JPY during the recent weeks was in a strong and consistent uptrend that buyers were successful in achieving the highest price of 124.145. Price has been stopped from more ascend by reaching to the specified resistance levels(made of 2 peak prices) in the picture below and with exit of some buyers from their trades , the Shooting Star candlestick patterns have been created. These candles shows vulnerability and indecision market in ascending or descending of price that for confirmation it needs closing of a bearish candle.
As it is obvious in the picture below, there is a Shark harmonic pattern between the bottom price of 111.231 and top price of 124.145 that warns the price downfall from the D point of this pattern and has been prevented from more increase till now. According to the strong and consistent uptrend, Stoch indicator is in saturation buy area and in divergence mode with the price chart that confirms the created top price and warns about the potential of changing price direction. Generally according to the technical signs in the price chart, until the top price of 124.145 is preserved; there is the potential for descending and price reformation in this currency pair.
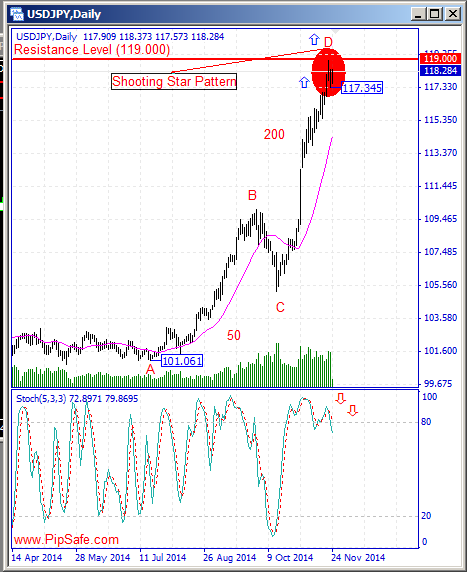
USD/JPY during the recent weeks had a strong ascending trend and could record the top price of 119.000. Right now the mentioned top price is one of the most important and nearest resistance level in front of the price that by breaking of it, the price finds the potential to reach the important resistance level of 119.340 or 120.900 .Price has been stopped from more ascend by reaching to the round resistance level of 119.000(the reason for some buyers to exit their trades) and by making a top price (Shooting Star) in daily time frame has started to reform.
According to the formed price movements in the chart, between the bottom price of 101.061 and top price of 119.000,there is AB=CD harmonic pattern with ideal ratios of 50 and 200 that with completion of the D point there will be a warning for descending of price.Stoch indicator in daily time frame is in saturation buy area and in divergence mode with the price chart that warns about the potential of descending during the next candles. One of the important warnings for decreasing of is breaking of supportive level of 117.345 (Low level of price changes in the previous daily candle).
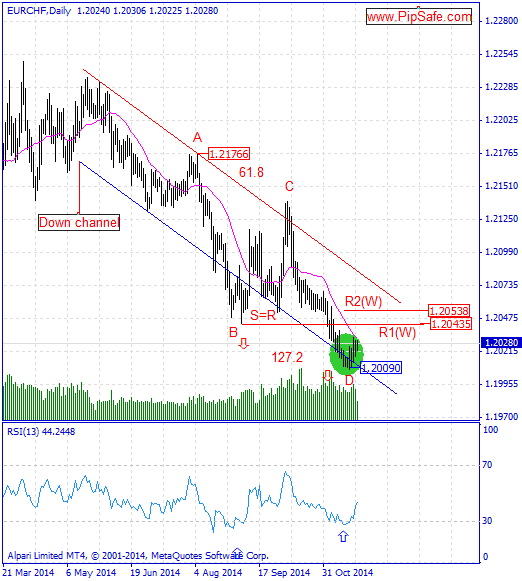
EUR/CHF during the recent month was in a downtrend that sellers were successful in achieving the lowest price of 1.20090.With cashing of some sellers’ trades (formation of candlestick pattern such as Spinning top and Inverted Hammer in weekly time frame) the price ascends and currently with closing of bullish candle on 21th records the bottom price of 1.20090.As it is obvious in the picture below between the top price of 1.21766 and bottom price of 1.20090, there is AB=CD harmonic pattern with the ratios of 61.8 and 127.2 that warns about the potential for ascending of the price.
RSI indicator is in saturation sell area and in divergence mode with the price chart in daily time frame that confirms the bottom price of 1.20090 and warns about changing price direction.Generally according to the formed signs in price chart, until the bottom price of 1.20090 is preserved; price will have the potential for increasing and ascend.
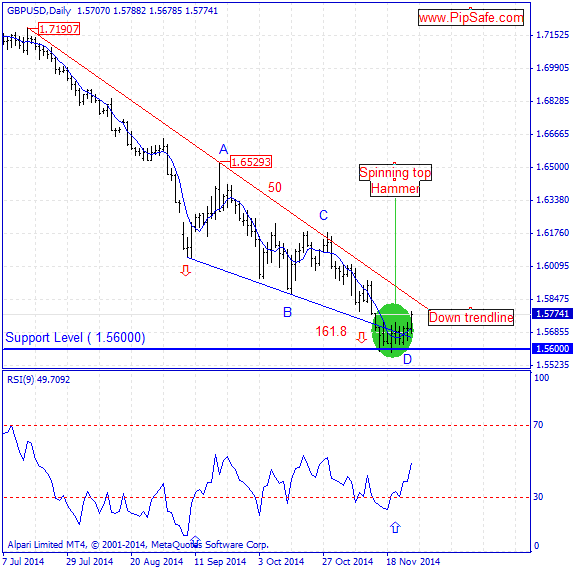
GBP/USD from 2014.07.15 had a strong descending trend with little reformation that shows the decision of sellers in reaching to the long term targets. This currency pair during its movement could record the low price of 1.56000.The price by reaching to the psychic level of 1.56000 could not pass it and retreated which the usage ability of this level can be seen in 1H time frame.
As it is obvious in the picture below, between the top price of 1.65293 and the bottom price of 1.56000, there is AB=CD harmonic pattern with the ratios of 50 and 161.8 that the D point of this pattern is completed and warns about ascending of the price.RSI indicator confirms the mentioned bottom price and it is in saturation sell area and also by being in divergence mode with the price chart warns about the price changing direction.Please note that If price rises and buyers success one of the price targets would be down trendline(made of three top prices). Generally until the supportive level of 1.56000 is preserved , the price will have the potential for reformation of descending trend and reaching to the down trendline .
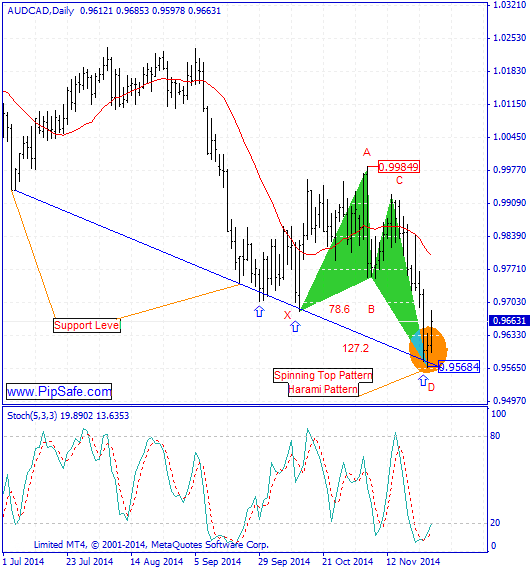
AUD/CAD chart has experienced a strong descending trend during the recent days that could record the bottom price of 0.95684.As it is obvious in the picture below, the price has been stopped from more descending by reaching to the supportive level (made of two bottom prices) and by creating a bottom price(Spinning top and Harami candlestick pattern) in this saturation area starts to ascend which shows the potential for ascending in this currency pair.
As it is obvious in the picture below, between the top price of 0.99849 and the bottom price of 0.95684, there is a butterfly harmonic pattern that with completion of the D point there will be a warning for increasing of the price.Stoch indicator is in saturation sell area and confirms the D point of this pattern by the next cycle and warns about the potential of ascending of the price during the next days.Generally until the price level of 0.95684 is preserved, the price has the potential for ascending and reformation.
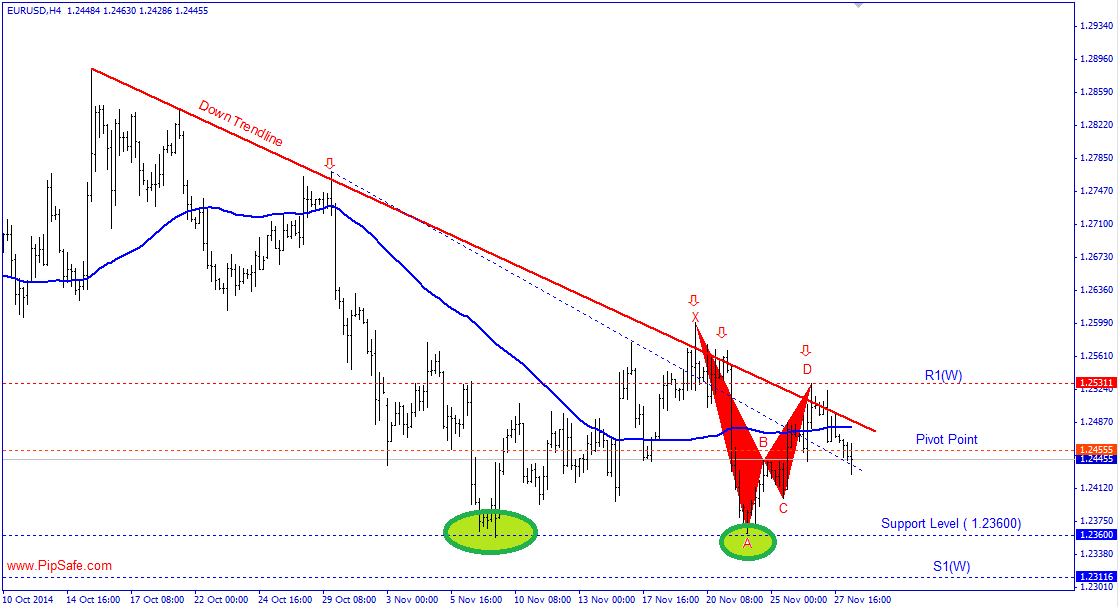
EUR/USD during the recent month was in a strong downtrend that sellers were successful in achieving the lowest price of 1.23600.According to the formed price movements in the chart, there is a Gartley harmonic pattern between the bottom price of 1.23600 and top price of 1.26000 that warns about descending of the price.Currently according to the condition of this currency pair and its strong downtrend in recent months, price is in saturation sell area and warns about a slight reformation in weekly time frame.
Right now, the price is trying to the green supportive level to reform itself and then start its ascending movement, but because of the pressure of the selling and powerful descending trend(Down trendline + harmonic pattern), this try has not been successful yet. The least sign for ascending of price is formation of a bottom price and recording of it in H4 and daily time frames.