BTC USD 81,658.0 Gold USD 4,096.65
Time now: Jun 1, 12:00 AM

Daily Technical Analysis by FxGrow

FxGrow Fundamental Analysis – 04th April, 2017
By FxGrow Investment Research Desk

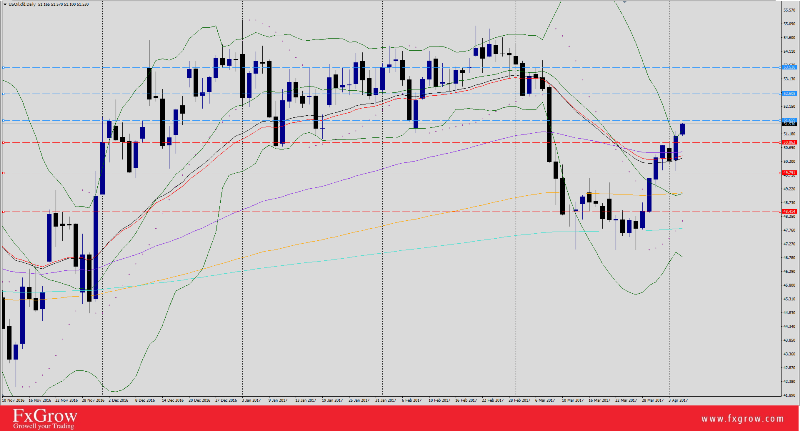
June U.S Dollar Index Technical Overview
US_Dollar_zpsa2onsaws.png


U.S Dollar Index Technical Overview

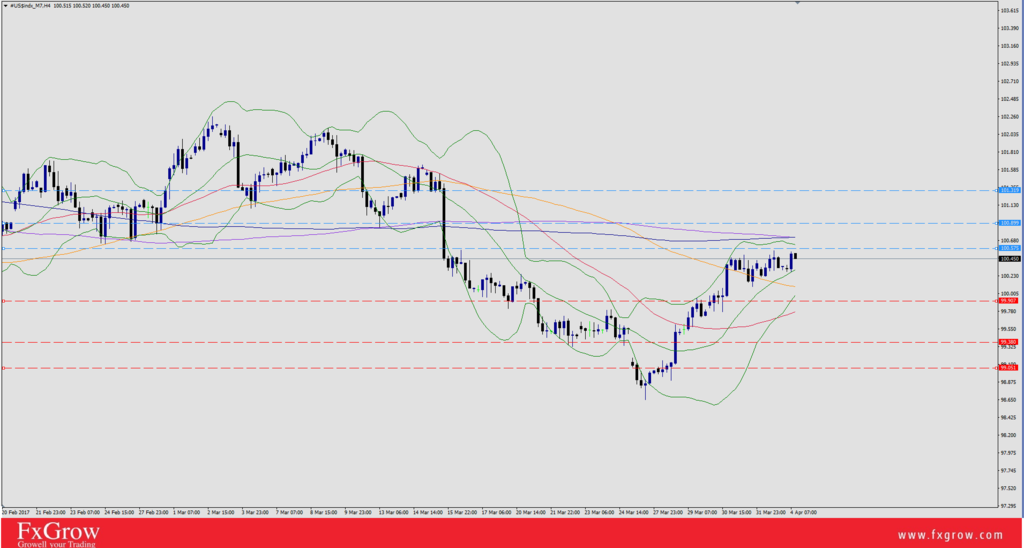
Trend : Sideways/Up


Resistance level: R1 100.57, R2 100.89, R3 101.31


Support levels : S1 99.90, S2 99.38, S3 99.05


Comment : The market is triggering a short term upturn and projects a climb to 101.31. Trade is poised for rallies, although be prepared for near term dips and basing action just under 100 to set up for rallies. A close under 99.38 is needed to rekindle bear trend forces.


For more in depth Research & Analysis please visit FxGrow.http://fxgrow.com/analysis-educatio...cal-analysis-fxgrow-free-forex-analysis-tools

Note: This analysis is intended to provide general information and does not constitute the provision of INVESTMENT ADVICE. Investors should, before acting on this information, consider the appropriateness of this information having regard to their personal objectives, financial situation or needs. We recommend investors obtain investment advice specific to their situation before making any financial investment decision.
 
FxGrow Fundamental Analysis – 04th April, 2017
By FxGrow Investment Research Desk

Copper Technical Overview
Copper_zpsuxrxw2rx.png


Copper Technical Overview

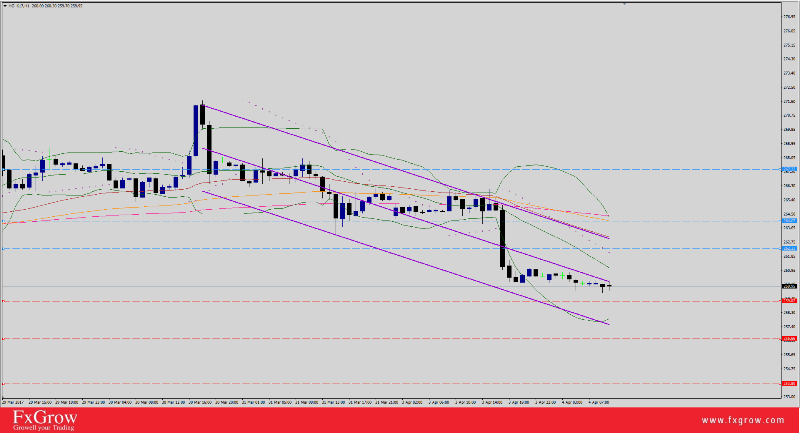
Trend : Bearish Sideways

Daily Pp 261.70

Resistance levels : R1 262.33, R2 264.06, R3 267.32

Support levels : S1 259.02, S2 256.66, S3 253.80

Comment : Yesterday's break marks a short-term reversing turnover and calls for selloffs to press for a breakout under recent congestion swing lows. A close below 258.80 signals for a selling wave 251.60. Trade may again bounce and continue choppy sideways congestion of recent weeks. A close over 267.32 is needed to flip the trend bias back up.

For more in depth Research & Analysis please visit FxGrow.http://fxgrow.com/analysis-educatio...cal-analysis-fxgrow-free-forex-analysis-tools

Note: This analysis is intended to provide general information and does not constitute the provision of INVESTMENT ADVICE. Investors should, before acting on this information, consider the appropriateness of this information having regard to their personal objectives, financial situation or needs. We recommend investors obtain investment advice specific to their situation before making any financial investment decision.
 
FxGrow Fundamental Analysis – 04th April, 2017
By FxGrow Investment Research Desk

USD/JPY Extended Further losses Despite Recovering U.S Dollar
USDJPY_zps70w0wtz9.png


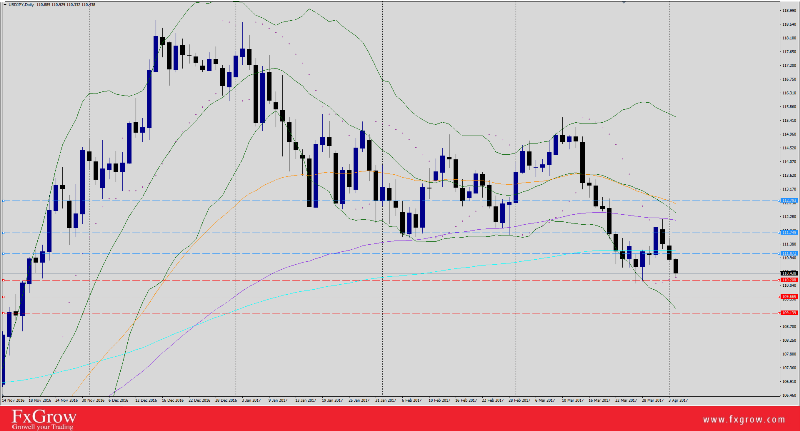
Unlike U.S Dollar soaring rivals, Japanese Yen managed to hold strong positions facing Sharp U.S Dollar tone, and USD/JPY rolled -59-pips today, adding -66-pips loss since Monday. The pair plunged to 110.33 earlier, and when uncertainties aroused by markets and economies, Japanese Yen is often a substitute as sacred haven. The pair bearish forces were supported by BOJ's Tankan report signifying a large manufacturer DI improvement less than expected - Nomura.

Namura report also added “Results not inconsistent with an export-driven economic recovery"
Fundamentals:

1- USD - FOMC meeting tomorrow at 6:00 PM GMT.

2- USD - Non-Farm (NFP) on Friday at 12:30 PM GMT.

Remark : This weekly economic data is light with Japanese Yen, on the other hand, heavy loaded for U.S economy with FOMC meeting in focus, after that NFP on Friday. Look for hints from U.S Fed regarding how many hikes are left and when. As for NFP this Friday, the result will determine USD/JPY trend for the coming days.

Technical overview:

Trend: Sideways

Resistance levels: R1 111.20, R2 111.74, R3 112.79

Support levels: S1 110.20, S2 109.66, S3 109.13

Comment: Current bullish trend of U.S index keeps USD/JPY under pressure despite this week losses. A break below S1 alerts for a bullish shifting forces and only a close below S2, the market will confirm the pair bearish trend. Market will retest last week's strong S1 level and dips should fight to stay above it. A penetration for R1 level will result in buying congestion with respect to strong U.S Dollar with fast upward correction towards R2 level.

For more in depth Research & Analysis please visit FxGrow.http://fxgrow.com/analysis-educatio...cal-analysis-fxgrow-free-forex-analysis-tools

Note: This analysis is intended to provide general information and does not constitute the provision of INVESTMENT ADVICE. Investors should, before acting on this information, consider the appropriateness of this information having regard to their personal objectives, financial situation or needs. We recommend investors obtain investment advice specific to their situation before making any financial investment decision.
 
FxGrow Fundamental Analysis – 05th April, 2017
By FxGrow Investment Research Desk

EUR/USD Steadies Ahead of local Data, Eyes on FOMC Meeting
EURUSD%20investing_zps8dkqjmkb.png


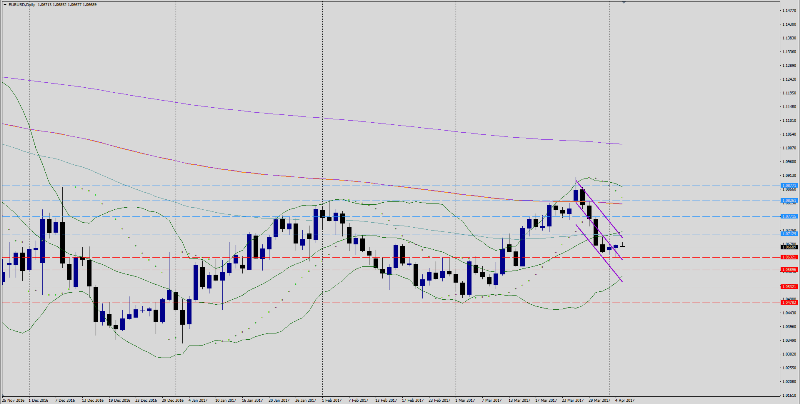
Last week, EUR/USD witnessed an intensive decline and the pair plunged to 1.0649 on Friday after peeking to 1.0906 last Monday. This week, the pair was confined with 50-pips as price action and prolonged the third consolidation consecutive session with a weekly high at 1.0685. Although U.S Dollar has awakened with a 100.59 high yesterday, market is showing some immunity by other currency rivals due to overall political uncertainties and economies are shifting courses at a high pace, add to that, mixed data leaving markets confused and cautious trading.

According to the analysts at Danske Bank, if we are close to a peak in inflation and they are right that the pricing of hikes in the Eurozone will prove premature, EUR/USD should stay under pressure in coming months and fall back towards 1.05 as close-to-neutral positioning in the cross makes room for a revival in relative rates. Eurozone still has many obstacles to overcome before the whole image is drawn, especially the French coming elections and Frexit is already on tongues.

This week, currency majors traded narrow as analysts awaits FOMC meeting minutes today and U.S NFP this Friday which should create higher volatility despite a negative or positive outcome especially EUR/USD. Local EURO services PMI is expected to have minor volatility. The main focus will be on tonight's FOMC meeting with eyes and ears focused on every word, trying to decipher messages, and the process of pricing the market could start all over again and FOMC members will do their best of avoid this scenario.

Fundamentals:

1- EUR - Final Services PMI today at 7:00 AM GMT.

2- USD - FOMC Meeting Minutes today at 6:00 PM GMT.

3- USD - Non-Farm Payrolls on Friday at 12:30 PM GMT.

Remark : U.S Data is heavy this week, but market poised and tied with FOMC meeting and NFP result, which leaves other data less significant.

Technical Overview:

Trend: Bearish / Sideways

Resistance levels : R1 1.0712, R2 1.0771, R3 1.0826, R4 1.0877

Support levels : S1 1.0632, S2 1.0589, S3 1.0532, S4 1.0478

Summary: Overall, the pair remains under pressure by strong U.S Index and market to consider EUR/USD bearish. But economic data this week will determine the trend further more. A penetration for S1 level will increase further selloffs and wash towards S2. A break below S2 level warns for additional intensive declines towards S3&S4. Any close below 1.07 is negative. Rallies that stay capped by 1.0800 should maintain bear forces. Closing above R3 level, traders to take it as sign for shifting trend course and above R4, uptrend is 100% confirmed. Be careful from setbacks as a first test on S&R levels due to high volatility.

For more in depth Research & Analysis please visit FxGrow.http://fxgrow.com/analysis-educatio...cal-analysis-fxgrow-free-forex-analysis-tools

Note: This analysis is intended to provide general information and does not constitute the provision of INVESTMENT ADVICE. Investors should, before acting on this information, consider the appropriateness of this information having regard to their personal objectives, financial situation or needs. We recommend investors obtain investment advice specific to their situation before making any financial investment decision.
 
FxGrow Fundamental Analysis – 05th April, 2017
By FxGrow Investment Research Desk

Crude Oil Surges Over Fears Of Supply Tightening, Eyes on U.S Inventories
Crude_zpstz7cyvbn.png


Fundamentals:

Crude oil level rallied yesterday +$1.41, and added +$0.14 today clocking a high 51.47, with expectation of additional gains, ahead of U.S Crude Inventories today. Oil bullish forces accelerated yesterday over signs of a gradual tightening in global oil inventories and on concerns about a supply outage at a field in the United Kingdom's North Sea that feeds into an international benchmark price.

Another contributor (Iraq), entered the field on Sunday pledging to a full compliance with oil cut deal as OPEC chief hinted. Iraq has assured OPEC that it will fully comply with an agreement to cut oil supply in order to curb crude prices and the deal as a whole is encouraging, OPEC Secretary General Mohammed Barkindo said on Sunday in Baghdad. Iraq's compliance stands now at 98 percent, the nation's oil minister Jabar al-Luaibi told reporters, after addressing a conference in the Iraqi capital, also attended by Barkindo. General compliance with supply cuts by the oil producers was 86 percent in January and 94 percent in February and the market is already balancing, he added.

On the other hand, the OPEC amd Non-OPEC deal for additional six months extension is cooked on a low steam and under the table which leaked optimism to the market as traders are anticipating it. Such deal, if struck, could accelerate rising price pace of crude oil despite U.S increased Shale drilling.

Conclusion: Currently OPEC with above fundamentals have the upper hand, and markets should expect oil prices to climb back to Feb 2017 average $53 bp.

Note: Look forward for U.S crude inventories today at 2:30 PM GMT which will give new perspectives for oil levels depending on the outcome.

Technical Overview:

Resistance levels: R1 51.65, R2 52.60, R3 53.52

Support levels : S1 50.86, S2 49.60, S3 48.41

Comment: The market has turned short-term bullish and calls for a larger bull wave up around R2&R3 levels. Stable action above 51.0 sustains bullish forces and boosts additional hikes. A slip below S1 cautions for near term correction, but only a close below S2 alerts for a trend reversal action and below S3, down-trend is confirmed. R1 level is sensitive as a psychological reminder of 2017 early rallies.

For more in depth Research & Analysis please visit FxGrow.http://fxgrow.com/analysis-educatio...cal-analysis-fxgrow-free-forex-analysis-tools

Note: This analysis is intended to provide general information and does not constitute the provision of INVESTMENT ADVICE. Investors should, before acting on this information, consider the appropriateness of this information having regard to their personal objectives, financial situation or needs. We recommend investors obtain investment advice specific to their situation before making any financial investment decision.
 
FxGrow Fundamental Analysis – 06th April, 2017
By FxGrow Investment Research Desk

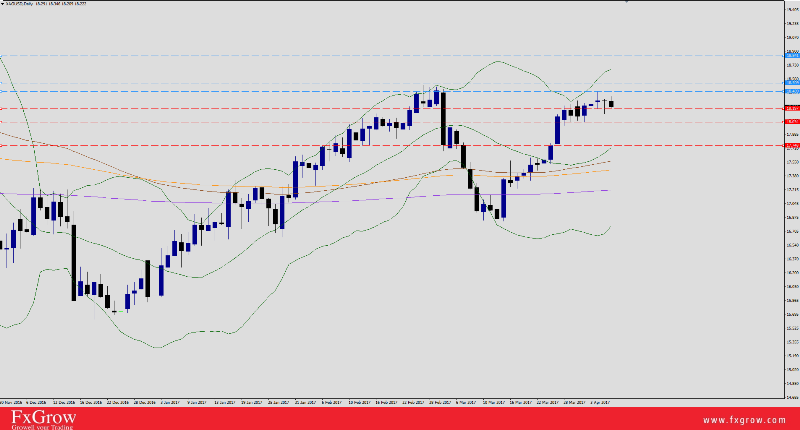
Silver Technical Overview Ahead of U.S Data
Silver_zpsqxss6rlc.png


Silver technical overview

Trend : Bullish

Resistance levels: R1 18.40 , R2 18.50, R3 18.73

Support levels: S1 18.19, S2 18.03, S3 17.74

Comment : The market is staying bullish with yesterday's bounce calling for another push higher. However, trade is pressed up against the previous downturn levels at R1&R2. A close over 18.55 is needed for a larger bull drive to R3 level. Be careful for a stall a stall against R1 and possible back off into flagging congestion. A slip through S2 level cautions for near term selling. A close under S3 is a signal for short term reversing turnover. Keep an eye on U.S Data today and tomorrow which will impact silver levels instantly. Be careful from setbacks as a first test on S&R due to high volatility. Only long positions above or below S&R is a confirmation for levels failure.

For more in depth Research & Analysis please visit FxGrow.http://fxgrow.com/analysis-educatio...cal-analysis-fxgrow-free-forex-analysis-tools

Note: This analysis is intended to provide general information and does not constitute the provision of INVESTMENT ADVICE. Investors should, before acting on this information, consider the appropriateness of this information having regard to their personal objectives, financial situation or needs. We recommend investors obtain investment advice specific to their situation before making any financial investment decision.
 
FxGrow Fundamental Analysis – 06th April, 2017
By FxGrow Investment Research Desk

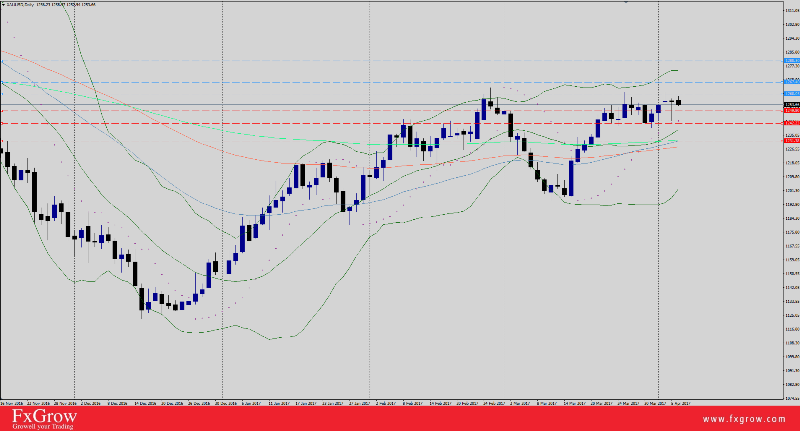
Gold Bull Forces Remain Under Pressure, U.S Data Will Decide
Gold_zpsptl34dn7.png


Gold has postponed breaking the 1260 level for the third consecutive session and for the 8th time in 2017, XAUUSD has built a higher wall being impossible to penetrate. Yesterday, the yellow metal plunged to 1243.75 dramatically over ADP Non-Farm Employment Change with an upbeat 263K while forecasts were 184K. Markets awaited FOMC meeting yesterday with expectations about a precise or clear figure about coming hikes with date, but details were left unspoken, as a result, market reacted negatively and U.S Index shed -$0.69 after peeking to 100.95 earlier. Currently gold trades 1245.30 intraday, with agitated volatility.

The same scenario has been repeated where gold reaches the climax of 1259, then fades aggressively as if the market is on an autopilot mood or Déjà vu. Today and tomorrow, U.S Data will decide once and for all, gold's destination. A break above 1261 will fuel gold bullish candles with fury, whilst, a failure to break above, market could witness pressured selling and gold will plunge below 1245 as a reminder of recent scenarios.

On the other hand, other keys could provoke gold inclines including Trump's political continuous tension with China and doubts about his leadership, North Korea declarations of launching nuclear missile as a test arousing uncertainties, French coming elections with Frexist as what happened on Brexit, markets might head to gold a safe haven substitute when doubts creap into the market.

Fundamentals:

1- USD - Unemployment Claims today at 12:30 PM GMT.

2- USD - Non-Farm Payrolls NFP tomorrow at 12:30 PM GMT.

Technical Overview:

Trend : Bullish Sideways

Resistance levels: R1 1260.05, R2 1267.40, R3 1280.30

Support levels: S1 1249.80, S2 1242.26, S3 1236.75

Comment: Gold levels will be determined depending on U.S Data outcome. As for technical, staying above 1250 rekindles bull forces. A break above R1 with long positions should fuel larger bull hikes towards R2&R3 level. Yesterday's spike rebound has trade positioned for rallies as a restore of confidence. Any penetration for S1 level holds congestion with a reminder of aggressive selloffs towards S2 level. Closing below S2 is a signal for trend reversal and market to consider gold bearish. Expectations of high volatility during economic data release and traders to be careful from setbacks as recent behavior when gold tests support and resistance levels.

For more in depth Research & Analysis please visit FxGrow.http://fxgrow.com/analysis-educatio...cal-analysis-fxgrow-free-forex-analysis-tools

Note: This analysis is intended to provide general information and does not constitute the provision of INVESTMENT ADVICE. Investors should, before acting on this information, consider the appropriateness of this information having regard to their personal objectives, financial situation or needs. We recommend investors obtain investment advice specific to their situation before making any financial investment decision.
 
FxGrow Fundamental Analysis – 07th April, 2017
By FxGrow Investment Research Desk

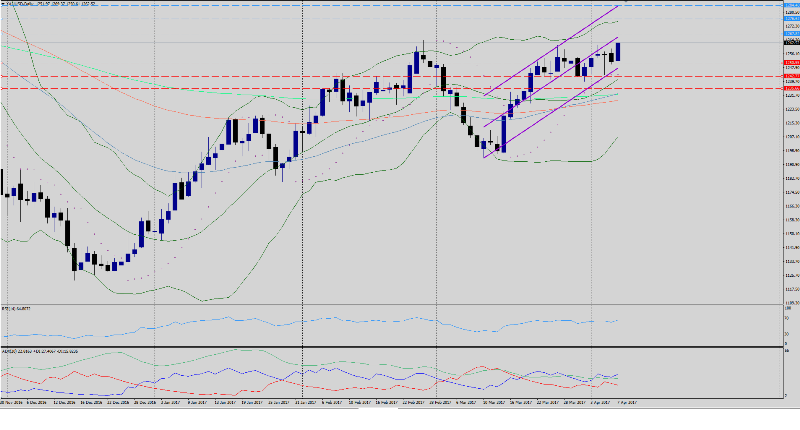
Gold Rockets With Fury Over Trump's Attack Decision
Gold%20investing_zpsifqhtj3o.png


Gold inaugurated early trading at 1255.45 low and clocked a 1269.28 Dec-2016-Fresh highs with +$18.83 price action. Yesterday, Trump hinted that U.S military forces are considering the option of a possible attack on Syrian lands, but no one took his words seriously. Trump had to prove everyone wrong, and the prohibited occured, an attack on Al-Shayrat airfield on Syrian Territories with Tomhauk missiles, but this is not the end of the story.

There are confirmed details that Russian military forces were at Al-Shayrat airfield base which should create further tension between U.S and Russia, and the biggest beneficiary was gold where markets and traders will consider XAUUSD as a safe haven alternative.

This is not the end of gold bullish ride, and tails will extend further political tension supporting gold bullish forces. The first resistance failed at 1260, the second was tested successfully at 1267 with a minor correction, currently the yellow metal is trading 1263 intraday. Expectations that gold will dilate and extend further gains during the coming hours even though U.S Index is strong 100.68 high today. Gold tends to tweet comfortably despite U.S Dollar performance when economic and political uncertainties creeps into market. Gold next destination is 1275>1280 in case R2 level 1267 fails.

Remark: Although markets are awaiting U.S NFP data today at 12:30 PM GMT, NFP could have a minor affect on gold due to the above political fundamentals.

For more in depth Research & Analysis please visit FxGrow.http://fxgrow.com/analysis-educatio...cal-analysis-fxgrow-free-forex-analysis-tools

Note: This analysis is intended to provide general information and does not constitute the provision of INVESTMENT ADVICE. Investors should, before acting on this information, consider the appropriateness of this information having regard to their personal objectives, financial situation or needs. We recommend investors obtain investment advice specific to their situation before making any financial investment decision.
 
FxGrow Fundamental Analysis – 11th April, 2017
By FxGrow Investment Research Desk

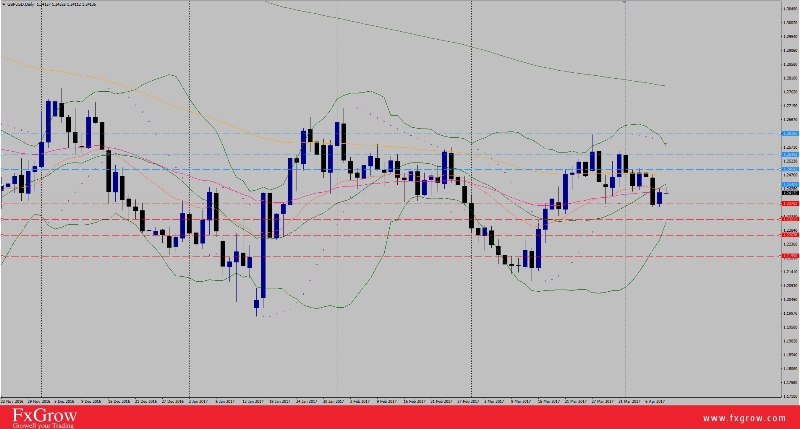
GBP/USD Bullish Momentum Re-Tests Ahead of Local Data
GBPUSD_zps9dac7m4k.png


Sterling showed a significant recovery on Monday with +63-pips price action. Today, GBP/USD was modest with +4 pips profit and the pair clocked 1.2432 high, then retreated 1.4221, at which the pair is currently trading intraday. GBP/USD still under pressure by recent strong U.S Dollar performance as the U.S Index clocked 101.24 April-2017-fresh-highs, although the index currently trades 100.93, is still a threat for the Sterling and promises for further declines for GBP/USD.

Mrs. Yellen, head of U.S Fed crossed wires yesterday with the following headlines and the coming hours will decide how the market will digest Yellen's speech as traders awaited more positive hints for coming U.S Fed hikes.

"I think we have a healthy economy now"

"Whereas before we had our foot pressed down on the gas pedal trying to give the economy all the oomph we possibly could, now allowing the economy to kind of coast and remain on an even keel -- to give it some gas but not so much that we are pressing down hard on the accelerator -- that's a better stance of monetary policy," she said. "We want to be ahead of the curve and not behind it."

Today, UK Data pocket is heavily loaded with Consumer Price Index CPI, Producer Price Index PPI, and Retail Price Index with CPI in focus. The UK CPI is expected to be weaker at 2.2% y/y in March versus a 2.3% reading booked last. On monthly basis, the consumer prices in the UK are expected to arrive at 0.3% versus 0.7% on previous sessions. GBP/USD low volatility is justified by markets being poised for economic data arrival today, but there will volatility after releasing data which will be eyed by BOE correlated with Inflation and coming interest rate decision.

Fundamentals:

1- GBP - CPI + PPI + RPI today at 8:30 AM GMT.

2- GBP - BOE Gov Carney Speech tomorrow at 8:00 AM GMT.

3- GBP - Average Earnings Index 3m/y tomorrow at 8:30 AM GMT.

Technical:

Trend: Bearish Sideways

Resistance levels : R1 1.2444, R2 1.2494, R2 1.2545, R4 1.2618

Support levels : S1 1.2375, S2 1.2321, S3 1.2267, S4 1.2195

Remark : UK Data today is crucial for GBP/USD trend coming hours with expectation of high volatility shortly after release. Although cable trend is currently bearish sideways, the data outcome could re-set GBP/USD Trend. U.S Index levels to be taken highly into consideration.

For more in depth Research & Analysis please visit FxGrow.http://fxgrow.com/analysis-educatio...cal-analysis-fxgrow-free-forex-analysis-tools

Note: This analysis is intended to provide general information and does not constitute the provision of INVESTMENT ADVICE. Investors should, before acting on this information, consider the appropriateness of this information having regard to their personal objectives, financial situation or needs. We recommend investors obtain investment advice specific to their situation before making any financial investment decision.
 
FxGrow Fundamental Analysis – 11th April, 2017
By FxGrow Investment Research Desk

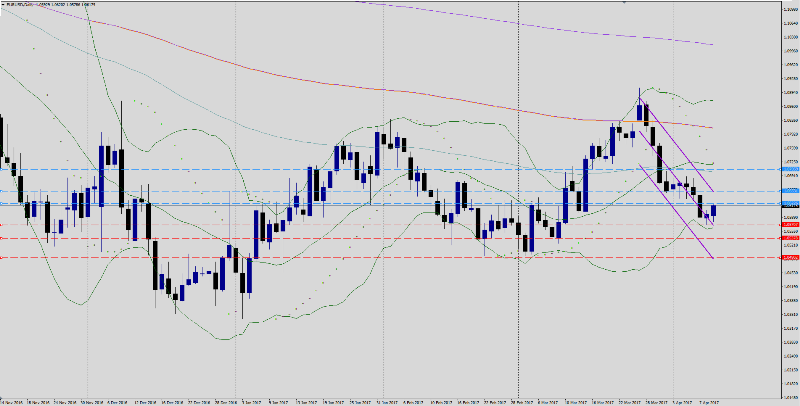
EUR/USD Remains Under Pressure by Stronger U.S Dollar
EURUSD%20investing_zpseemrugde.png


EUR/USD extended the bearish trend for the 12th consecutive session and has been confined with 37-pips price action since yesterday. The pair clocked a 1.0620 high today and remains under pressure by recovering US Dollar as the Index peeked to 101.24 high yesterday. Today U.S Index retreated to 100.73 low, showing signs of weakness following Yellen speech yesterday as the market still not digesting the outcome. Yellen and Co. abandoned the support for U.S Dollar, and left the Index to trade based on U.S upcoming economic events, stressing that U.S economy is doing well overall.

Technical :

Trend : Bearish Sideways

Resistance levels: R1 1.0622, R2 1.0653, R3 1.0705

Support levels: S1 1.0570, S2 1.0537, S3 1.0486

Remark : The market is bearish and Friday's drop out from sideways congestion around 1.07+/- alerts for fro another aggressive selling wave to reach S2. Any corrective congestion trapped within the lower half of Friday's range will stay aligned for selloffs. A close above R3 level is needed to spark bullish forces and trend reversal.

For more in depth Research & Analysis please visit FxGrow.http://fxgrow.com/analysis-educatio...cal-analysis-fxgrow-free-forex-analysis-tools

Note: This analysis is intended to provide general information and does not constitute the provision of INVESTMENT ADVICE. Investors should, before acting on this information, consider the appropriateness of this information having regard to their personal objectives, financial situation or needs. We recommend investors obtain investment advice specific to their situation before making any financial investment decision.
 

Live Forex Chart

Currency
Rates
EUR / USD
1.11388
USD / JPY
158.202
GBP / USD
1.31685
USD / CHF
0.83454
USD / CAD
1.42465
EUR / JPY
176.621
AUD / USD
0.69623
Back
Top
Log in Register