BTC USD 83,713.9 Gold USD 4,178.75
Time now: Jun 1, 12:00 AM

Daily Technical Analysis by FxGrow

FxGrow Support

Active Member
Messages
1,073
Joined
May 6, 2015
Messages
1,073
Reaction score
2
Points
25
Dear Forum Members!

Here you can find Daily Technical Analysis of Major Currencies.

We hope that this information will be helpful for your trading.

Best Regards
FxGrow Support
-------------------------------------------------------------------------------

Terms used in our Analysis

RSI (14) - Relative strength index 14 days Time frame
MACD (12, 26) - Moving Average Convergence Divergence 12 day EMA - 26 day EMA
EMA - Exponential moving average
ADX (14) - Average Directional Index 14 days
ATR (14) - Average True Range 14 days
SMA - Simple Moving Average
MA x - Moving Average where x is the number of days
STOCH RSI (14) - Stochastic RSI 14 days
William %R - Momentum Indicator
CCI(14) - Commodity Channel Index
ROC - Rate of Change

-------------------------------------------------------------------------------
 
Daily Technical Analysis – 14th May, 2015
By FxGrow Research & Analysis Team

AUDUSD

AUDUSD14may15_zpsftpef9yd.png


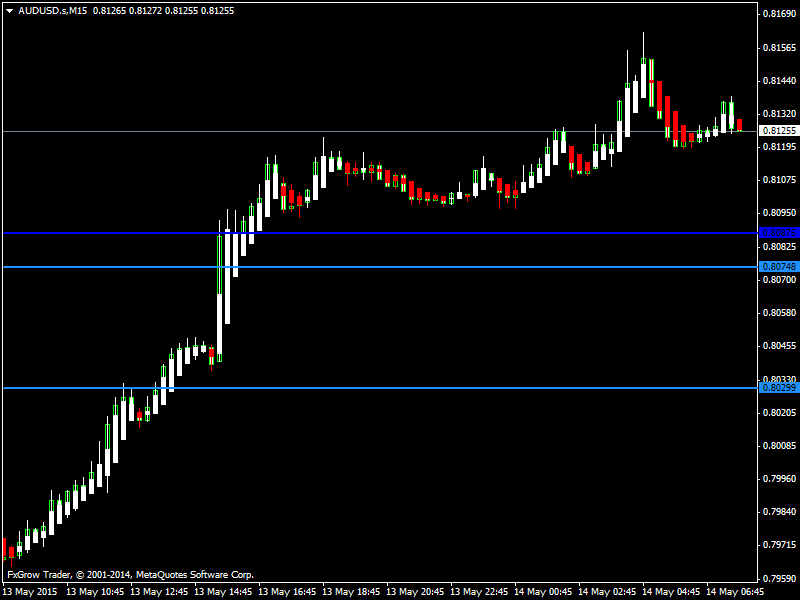
AUDUSD is in a strong bullish momentum surging ahead of 0.8100 and the near term bias is bullish with targets of 0.8200 to 0.8230

RSI (14), MACD (12, 26) and CCI (14) indicate a BUY while STOCHRSI (14) is oversold. Average True Range (14) indicates Less Volatility.

Support is at 0.8029 while Resistance is at 0.8162

14th May 2015 – 05:04hrs GMT


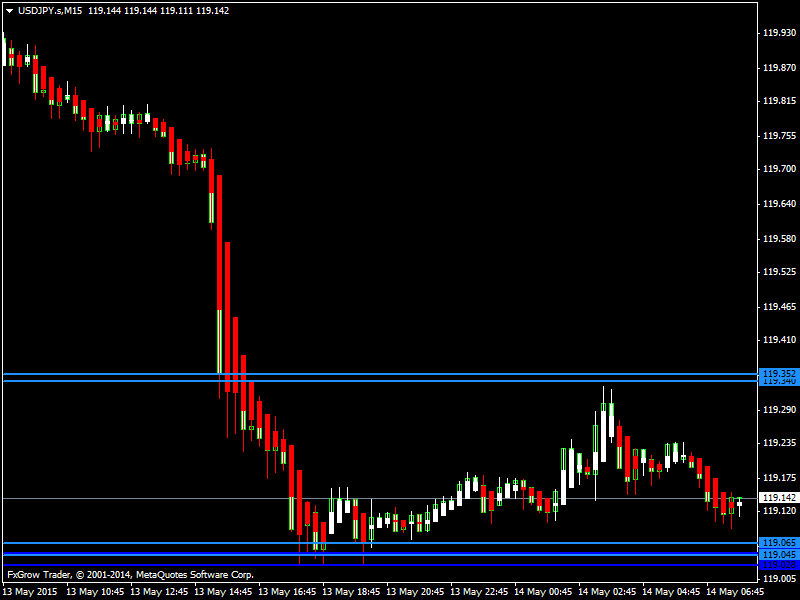
USDJPY

USDJPY14may15_zpsqolickmd.png


USDJPY remains bearish trading at 119.18 in the Asian trading session. The near term bias is bearish to Neutral with targets of 118.50

RSI (14), MACD (12, 26) indicate a SELL; STOCH (9,6) is Neutral; STOCHRSI(14) is overbought; while Average True Range (14) indicates Less Volatility.

Support is at 119.04 while Resistance is at 119.35

14th May 2015 – 05:07hrs GMT

For more in depth Research & Analysis please visit FxGrow.

Note: This analysis is intended to provide general information and does not constitute the provision of INVESTMENT ADVICE. Investors should, before acting on this information, consider the appropriateness of this information having regard to their personal objectives, financial situation or needs. We recommend investors obtain investment advice specific to their situation before making any financial investment decision.
 
Daily Technical Analysis – 15th May, 2015
By FxGrow Research & Analysis Team

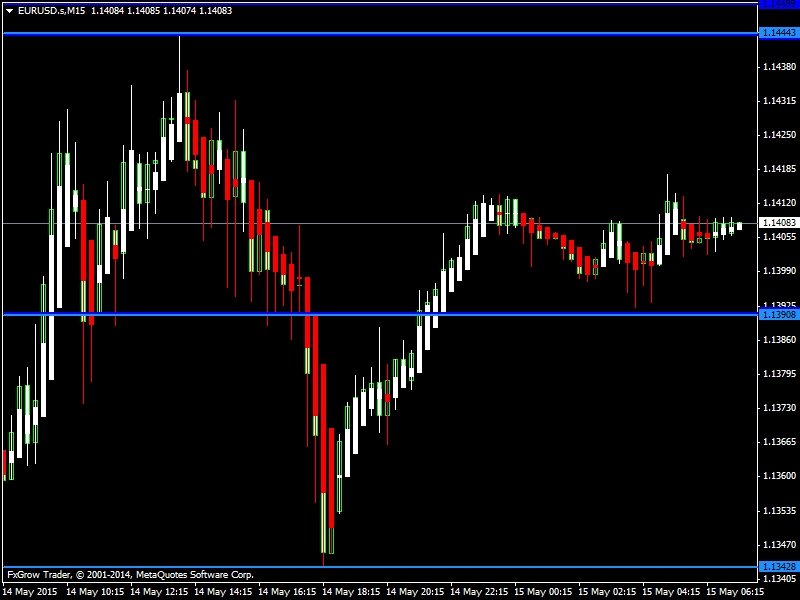
EURUSD

EURUSD15may15_zpsflottet2.png


EURUSD continues its bullish momentum crossing 1.1440 yesterday. The near term bias is bullish with targets of 1.1500 to 1.1540

RSI (14), MACD (12, 26), CCI (14), STOCH (9, 6) indicate a BUY; STOCHRSI (14) is Overbought; while Average True Range (14) indicates Less Volatility.

Support is at 1.1342 while Resistance is at 1.1444 and 1.1449

15th May 2015 – 04:34hrs GMT


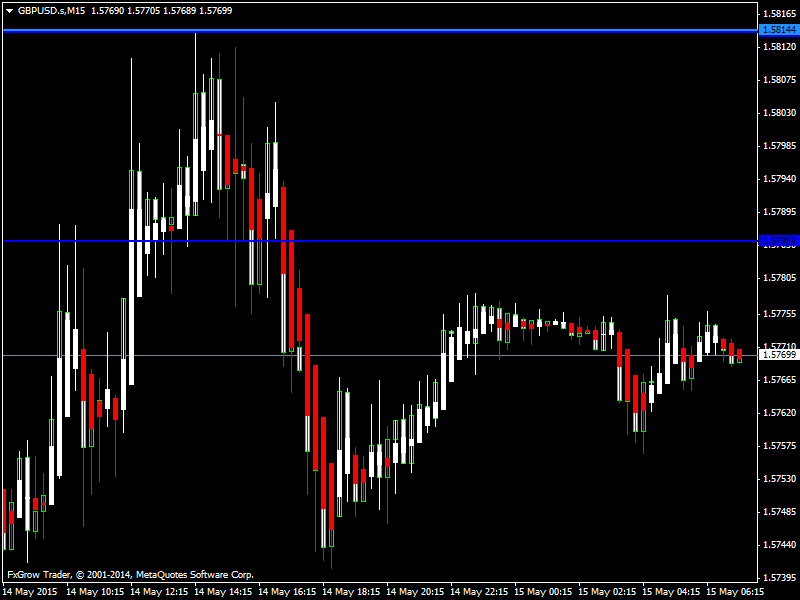
GBPUSD

GBPUSD15may15_zpsfz4nihi6.png


GBPUSD continues its bullish tone crossing 1.5800 yesterday. Some correction is expected in the European trading session and the near term bias is Neutral to bullish with targets of 1.5850

RSI (14), CCI (14) is Neutral; MACD (12, 26), STOCH (9, 6) indicate a BUY; while Average True Range (14) indicates Less Volatility.

Support is at 1.5763 while Resistance is at 1.5814

15th May 2015 – 04:40hrs GMT

For more in depth Research & Analysis please visit FxGrow.

Note: This analysis is intended to provide general information and does not constitute the provision of INVESTMENT ADVICE. Investors should, before acting on this information, consider the appropriateness of this information having regard to their personal objectives, financial situation or needs. We recommend investors obtain investment advice specific to their situation before making any financial investment decision.
 
Daily Technical Analysis – 15th May, 2015
By FxGrow Research & Analysis Team

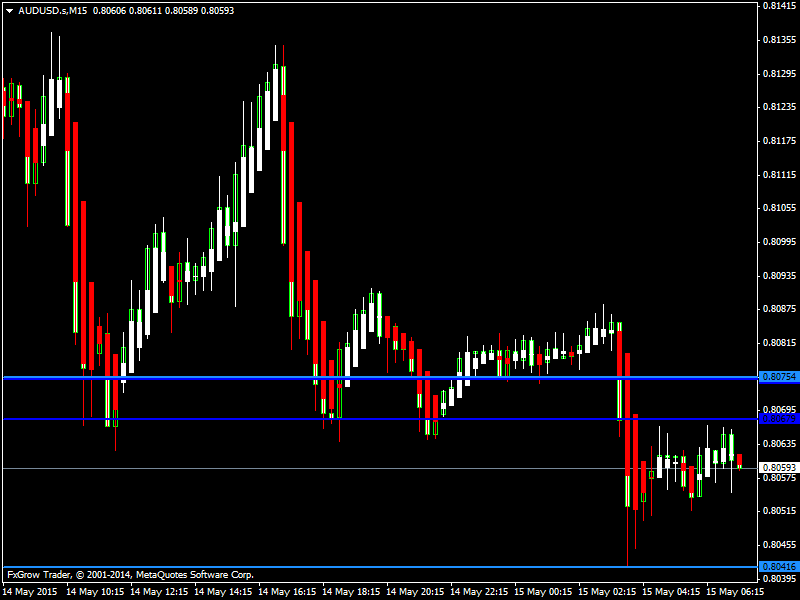
AUDUSD

AUDUSD15may15_zpsqiivxtiv.png


AUDUSD came down yesterday and is presently in the bearish tone trading below 0.8100 the near term bias is bearish with targets of 0.8000 to 0.7950

RSI (14), MACD (12, 26), CCI (14), ADX (14) indicate a SELL while STOCHRSI (14) is Oversold. Average True Range (14) indicates Less Volatility.

Support is at 0.8041 while Resistance is at 0.8162

15th May 2015 – 04:47hrs GMT


USDJPY

USDJPY15may15_zpsyudschkt.png


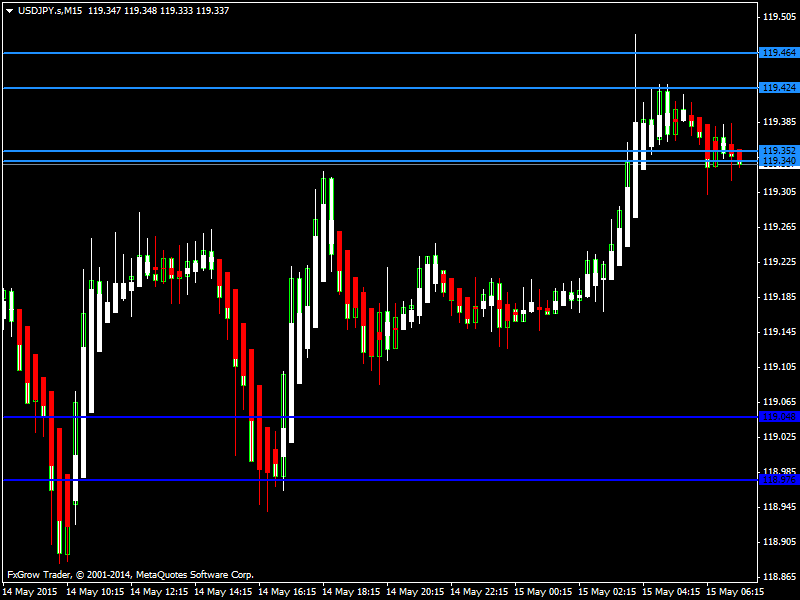
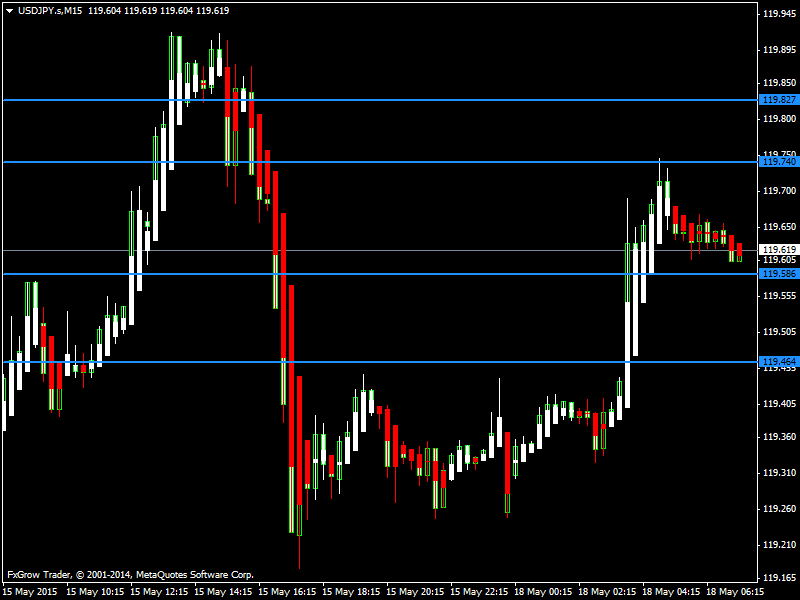
USDJPY is in Bullish trend crossing 119.40 in the Asian trading session. The near term bias is bullish with targets of 120.00

RSI (14), MACD (12, 26), STOCH (9, 6), STOCHRSI (14) indicate a BUY; while Average True Range (14) indicates Less Volatility.

Support is at 118.97 while Resistance is at 119.46

15th May 2015 – 04:53hrs GMT

For more in depth Research & Analysis please visit FxGrow.

Note: This analysis is intended to provide general information and does not constitute the provision of INVESTMENT ADVICE. Investors should, before acting on this information, consider the appropriateness of this information having regard to their personal objectives, financial situation or needs. We recommend investors obtain investment advice specific to their situation before making any financial investment decision.
 
Daily Technical Analysis – 18th May, 2015
By FxGrow Research & Analysis Team

EURUSD

EURUSD18may15_zpste7knbgd.png


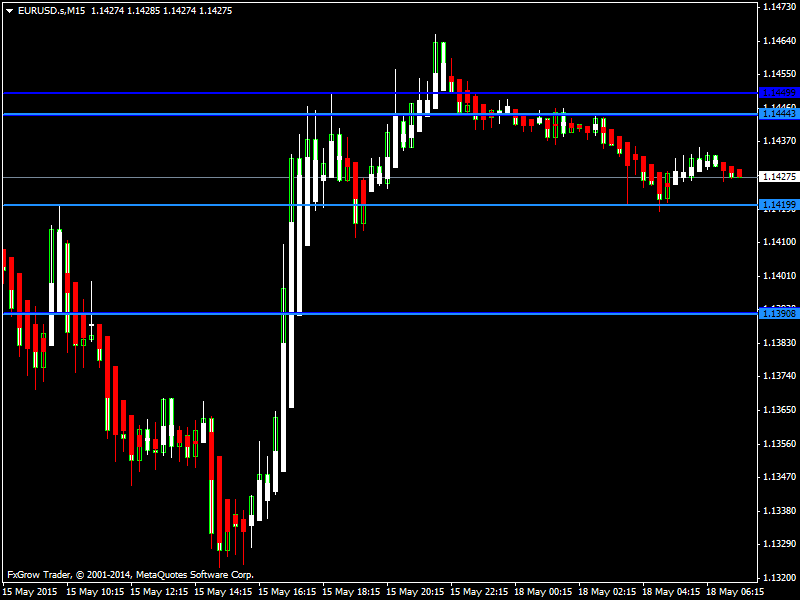
EURUSD regained its bullish trend crossing 1.1460 on Friday and is trading above 1.1400 in the Asian trading session. The near term bias is Neutral to Bullish with some correction possible in the European trading session.

RSI (14) is Neutral; MACD (12, 26), MA100, MA200 indicate a BUY; STOCHRSI (14) is Oversold; while Average True Range (14) indicates Less Volatility.

Support is at 1.1322 while Resistance is at 1.1459 and 1.1465

18th May 2015 – 04:35hrs GMT


GBPUSD

GBPUSD18may15_zps8rop02wz.png


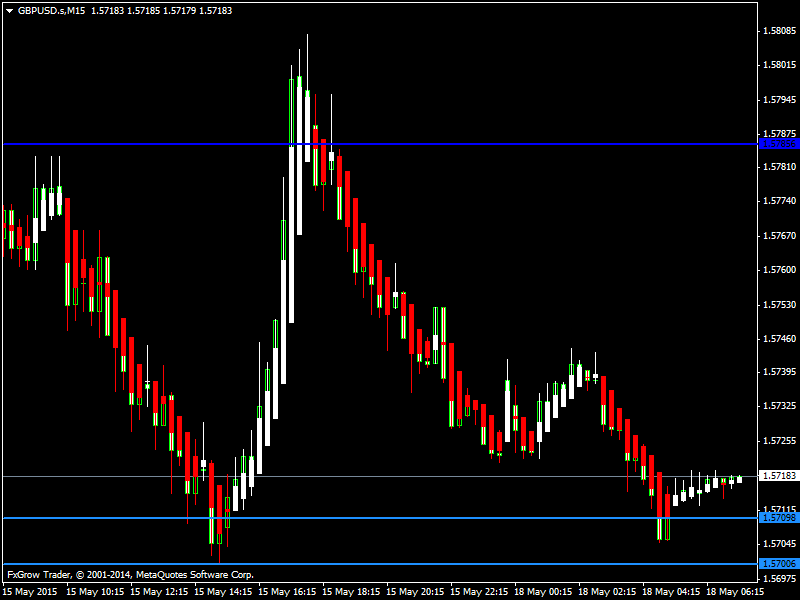
GBPUSD could not retain its bullish trend on Friday and came down below 1.5750 Further correction is possible today within the range of 1.5700 The near term bias is Neutral to Bullish with targets of 1.5810

RSI (14), STOCHRSI (14) is Neutral; MA100 and MA200 indicate a BUY; while Average True Range (14) indicates Less Volatility.

Support is at 1.5700 while Resistance is at 1.5785 and 1.5807

18th May 2015 – 04:42hrs GMT

For more in depth Research & Analysis please visit FxGrow.

Note: This analysis is intended to provide general information and does not constitute the provision of INVESTMENT ADVICE. Investors should, before acting on this information, consider the appropriateness of this information having regard to their personal objectives, financial situation or needs. We recommend investors obtain investment advice specific to their situation before making any financial investment decision.
 
Daily Technical Analysis – 18th May, 2015
By FxGrow Research & Analysis Team

AUDUSD

AUDUSD18may15_zpsfexy1n6l.png


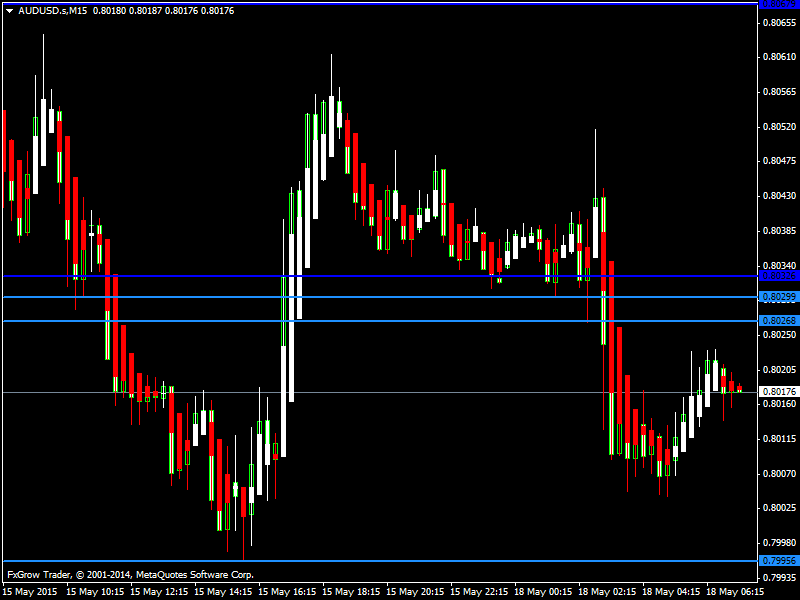
AUDUSD is in bearish trend trading at 0.8017 in the Asian trading session. The support level of 0.8000 could easily be broken in the European trading session with targets of 0.7950 to 0.7920 today.

RSI (14), MACD (12, 26), CCI (14), STOCHRSI (14) indicate a SELL; while Average True Range (14) indicates Less Volatility.

Support is at 0.7995 while Resistance is at 0.8067

18th May 2015 – 04:49hrs GMT


USDJPY

USDJPY18may15_zps7krnvtnz.png


USDJPY has started its bullish trend with the pair trading above 119.50 in the Asian trading session. The near term bias is Neutral to bullish with targets of 120.20

RSI (14), MACD (12, 26), STOCH (9, 6) indicate a BUY; STOCHRSI (14) is Overbought; while Average True Range (14) indicates Less Volatility.

Support is at 119.46 while Resistance is at 119.82 and 119.92

18th May 2015 – 04:54hrs GMT

For more in depth Research & Analysis please visit FxGrow.

Note: This analysis is intended to provide general information and does not constitute the provision of INVESTMENT ADVICE. Investors should, before acting on this information, consider the appropriateness of this information having regard to their personal objectives, financial situation or needs. We recommend investors obtain investment advice specific to their situation before making any financial investment decision.
 
Daily Technical Analysis – 19th May, 2015
By FxGrow Research & Analysis Team

EURUSD

EURUSD19may15_zpspgfwpel7.png


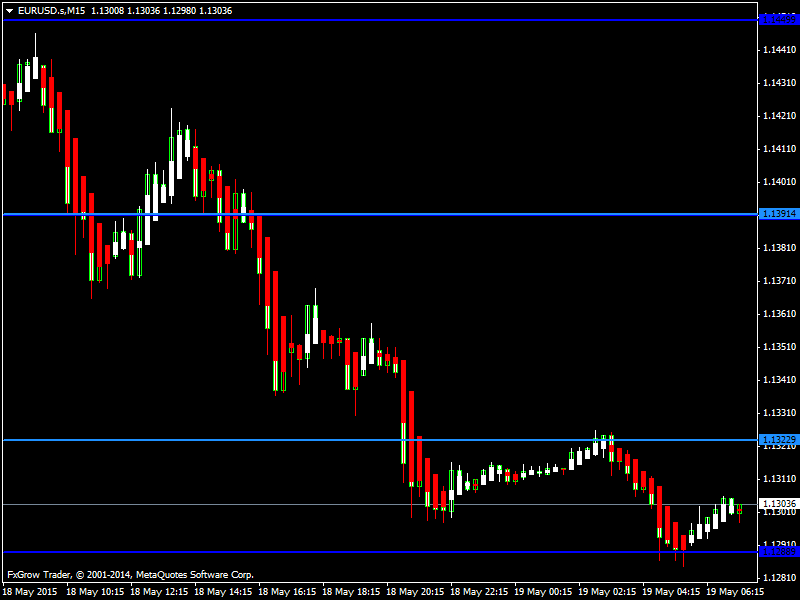
EURUSD started its bearish trend yesterday and came below its support level of 1.1322 In the Asian trading session it touched 1.1300 levels today. The near term bias is bearish but overall scenario remains bullish with targets of 1.1450 to 1.1500

RSI (14), MACD (12, 26), STOCH (9, 6), CCI (14) indicate a SELL; while Average True Range (14) indicates Less Volatility.

Support is at 1.1288 while Resistance is at 1.1391 and 1.1449

19th May 2015 – 04:36hrs GMT


GBPUSD

GBPUSD19may15_zps6lgk6wkj.png


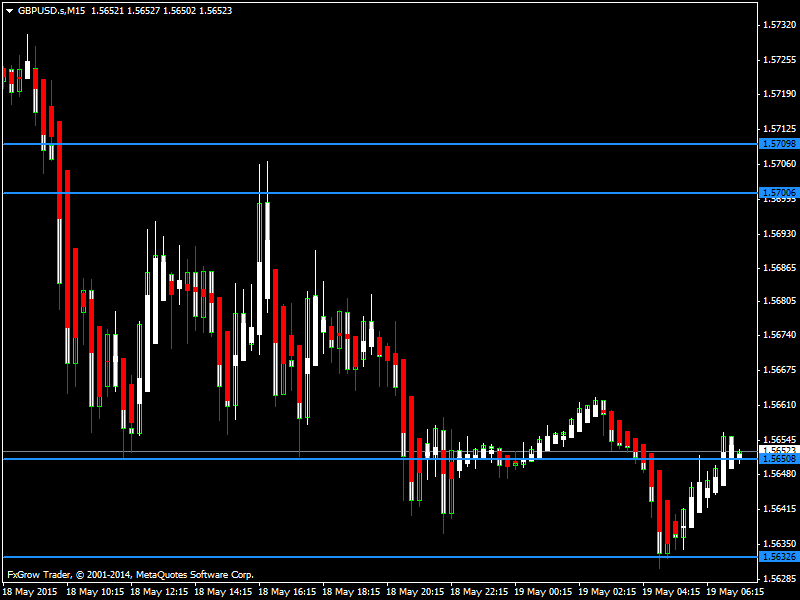
GBPUSD is in a bearish momentum with the pair trading at 1.5650 in the Asian trading session. The near term bias remains Neutral to bearish with some sideways movements possible in the European trading session. Overall scenario remains bullish with targets of 1.5700 to 1.5750

RSI (14), MACD (12, 26), ROC indicate a SELL; STOCH (9, 6) and CCI (14) are Neutral; while Average True Range (14) indicates Less Volatility.

Support is at 1.5632 while Resistance is at 1.5700 and 1.5709

19th May 2015 – 04:45hrs GMT

For more in depth Research & Analysis please visit FxGrow.

Note: This analysis is intended to provide general information and does not constitute the provision of INVESTMENT ADVICE. Investors should, before acting on this information, consider the appropriateness of this information having regard to their personal objectives, financial situation or needs. We recommend investors obtain investment advice specific to their situation before making any financial investment decision.
 
Daily Technical Analysis – 19th May, 2015
By FxGrow Research & Analysis Team

AUDUSD

AUDUSD19may15_zpsmp1uwiat.png


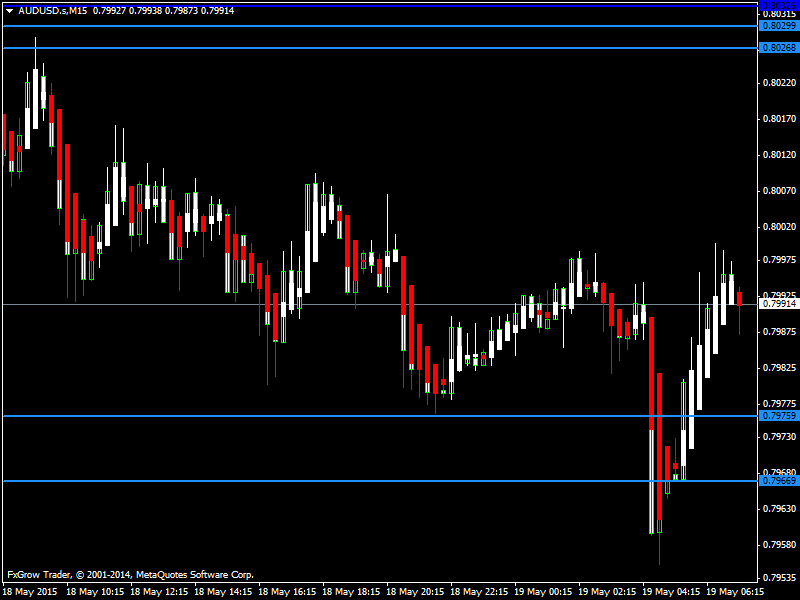
AUDUSD remained bearish yesterday coming down below 0.8000 In the Asian trading session the pair touched a low of 0.7960 but then it rebounded to 0.7990 The near term bias remains Neutral to Bullish with sideways movements expected in the European trading session.

RSI (14), CCI (14) are Neutral; STOCH(9,6), ADX(14) indicate a BUY; STOCHRSI (14) is Overbought; while Average True Range (14) indicates Less Volatility.

Support is at 0.7966 while Resistance is at 0.8026 and 0.8032

19th May 2015 – 04:51hrs GMT


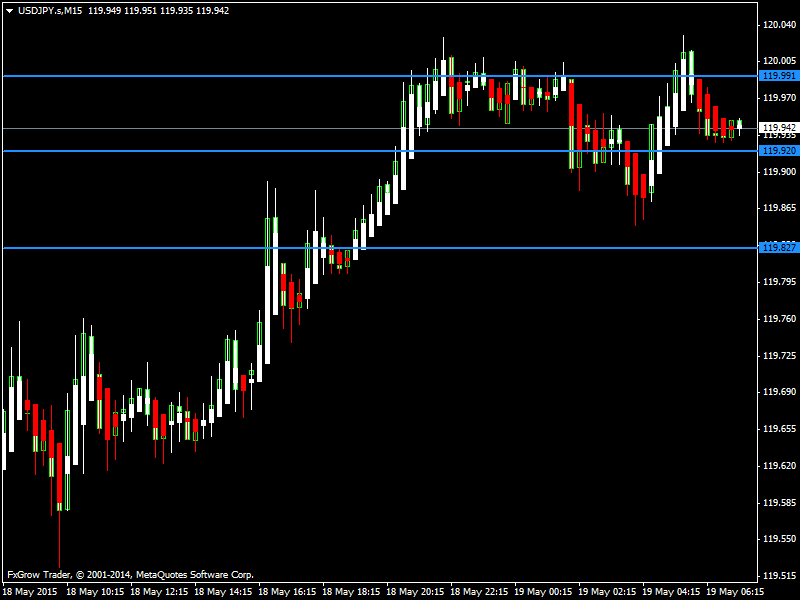
USDJPY

USDJPY19may15_zpsavfny4fk.png


USDJPY is in a Bullish trend with the pair crossing 120.00 in the Asian trading session. The near term bias remains Neutral to Bullish within range of 120.00 to 120.50

RSI (14), MACD (12, 26), ADX (14) indicate a BUY; STOCHRSI (14) is Oversold; while Average True Range (14) indicates Less Volatility.

Support is at 119.82 while Resistance is at 119.99

19th May 2015 – 04:56hrs GMT

For more in depth Research & Analysis please visit FxGrow.

Note: This analysis is intended to provide general information and does not constitute the provision of INVESTMENT ADVICE. Investors should, before acting on this information, consider the appropriateness of this information having regard to their personal objectives, financial situation or needs. We recommend investors obtain investment advice specific to their situation before making any financial investment decision.
 
Daily Technical Analysis – 20th May, 2015
By FxGrow Research & Analysis Team

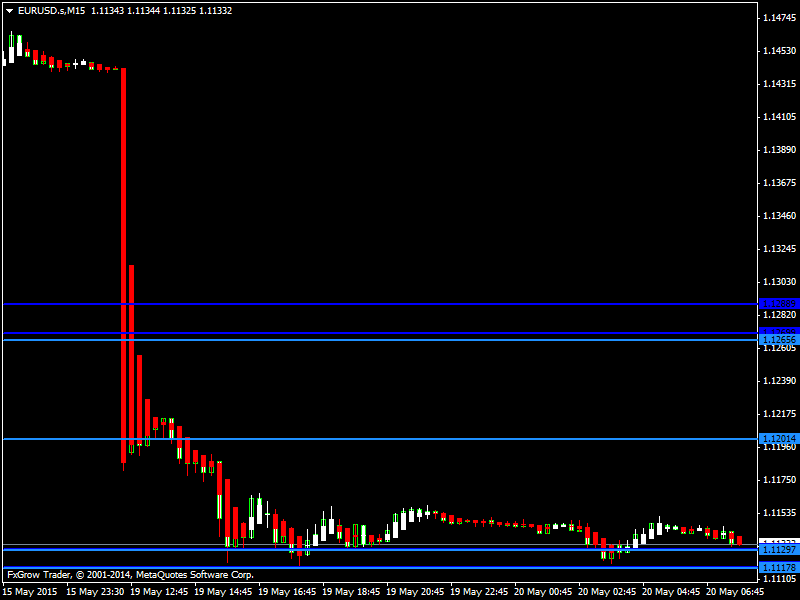
EURUSD

EURUSD20may15_zps9bgnphk3.png


EURUSD had a strong bearish momentum yesterday falling below 1.1150 to trade at 1.1129 in the Asian Trading session. The near term bias remains bearish with targets of 1.1100 to 1.1050

RSI (14), MACD (12, 26), ADX (14), CCI (14) indicate a SELL; while Average True Range (14) indicates Less Volatility.

Support is at 1.1117 while Resistance is at 1.1265 and 1.1288

20th May 2015 – 05:11hrs GMT


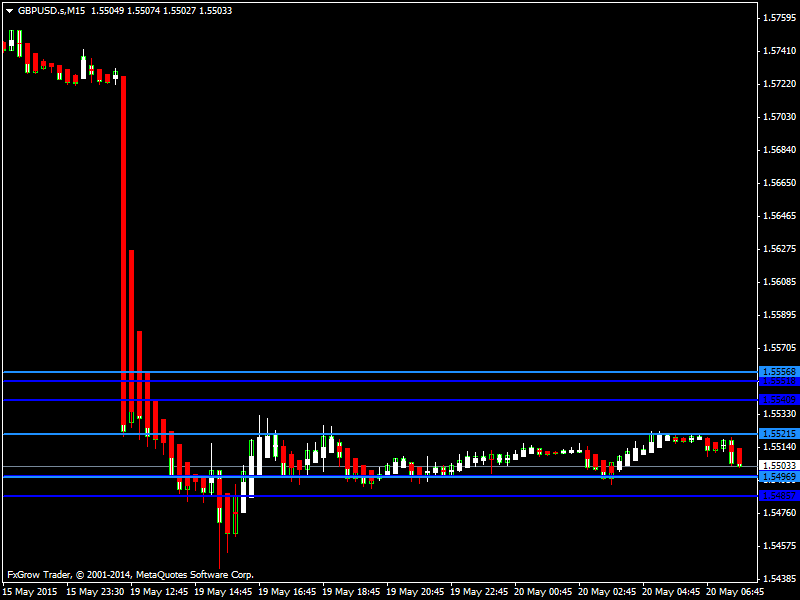
GBPUSD

GBPUSD20may15_zps23rkmhqd.png


GBPUSD is moving in a bearish momentum with the pair testing 1.5460 yesterday. It is expected to move in a low range and the near term bias remains bearish with targets of 1.5450 to 1.5400

RSI (14), MACD (12, 26), ROC, ADX (14) indicate a SELL; STOCH (9, 6) is Neutral; while Average True Range (14) indicates Less Volatility.

Support is at 1.5444 while Resistance is at 1.5556

20th May 2015 – 05:26hrs GMT

For more in depth Research & Analysis please visit FxGrow.

Note: This analysis is intended to provide general information and does not constitute the provision of INVESTMENT ADVICE. Investors should, before acting on this information, consider the appropriateness of this information having regard to their personal objectives, financial situation or needs. We recommend investors obtain investment advice specific to their situation before making any financial investment decision.
 
Daily Technical Analysis – 20th May, 2015
By FxGrow Research & Analysis Team

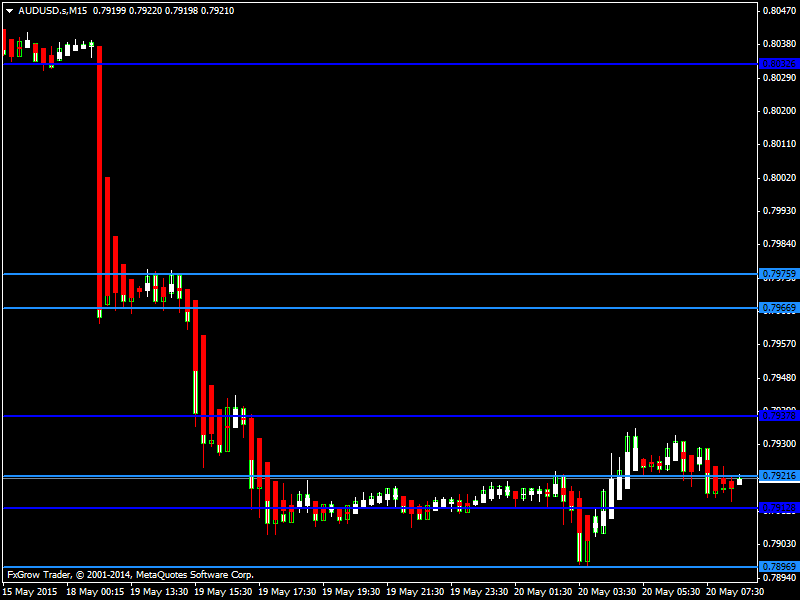
AUDUSD

AUDUSD20may15_zpsgg3ygsfs.png


AUDUSD continues its bearish trend dropping below 0.7900 in the Asian trading session. The near term bias is Neutral to Bearish within range of 0.7880 to 0.7840 with some sideways movements expected in the European trading session.

RSI (14), MACD (12, 26) indicate a SELL; ADX (14) and CCI (14) are Neutral; STOCHRSI (14) is overbought; while Average True Range (14) indicates Less Volatility.

Support is at 0.7896 while Resistance is at 0.7975 and 0.8032

20th May 2015 – 05:32hrs GMT


USDJPY

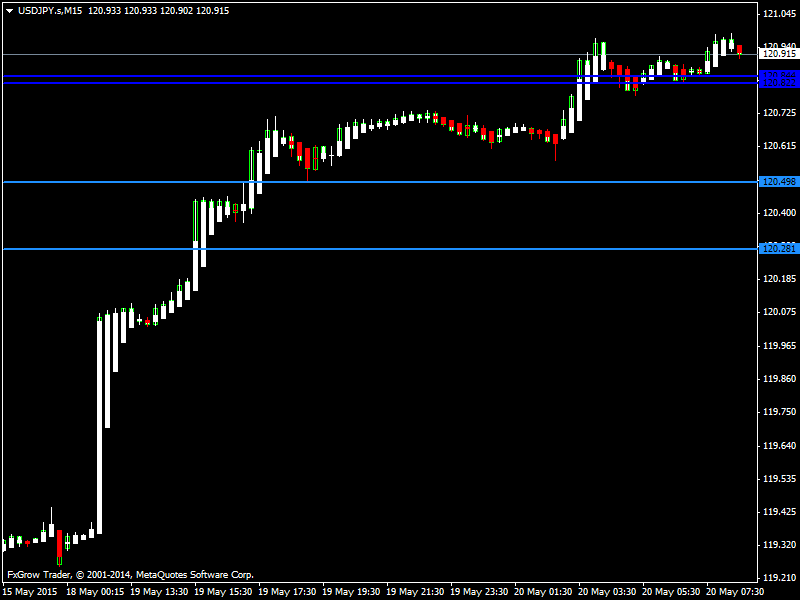
USDJPY20may15_zpsluyculnp.png


USDJPY maintains its Bullish tone crossing 120.95 in the Asian trading session. Some correction in prices and sideways movements are possible in the European trading session. The near term bias remains Bullish with targets of 121.50 to 122.00

RSI (14), MACD (12, 26), ADX (14), STOCH (9, 6) indicate a BUY; while Average True Range (14) indicates Less Volatility.

Support is at 120.28 while Resistance is at 121.17

20th May 2015 – 05:40hrs GMT

For more in depth Research & Analysis please visit FxGrow.

Note: This analysis is intended to provide general information and does not constitute the provision of INVESTMENT ADVICE. Investors should, before acting on this information, consider the appropriateness of this information having regard to their personal objectives, financial situation or needs. We recommend investors obtain investment advice specific to their situation before making any financial investment decision.
 

Live Forex Chart

Currency
Rates
EUR / USD
1.13044
USD / JPY
157.946
GBP / USD
1.32415
USD / CHF
0.83531
USD / CAD
1.42404
EUR / JPY
178.548
AUD / USD
0.69532
Back
Top
Log in Register