BTC USD 83,095.9 Gold USD 4,155.26
Time now: Jun 1, 12:00 AM

Daily Technical Analysis by FxGrow

FxGrow Fundamental Analysis – 20th March, 2017
By FxGrow Investment Research Desk

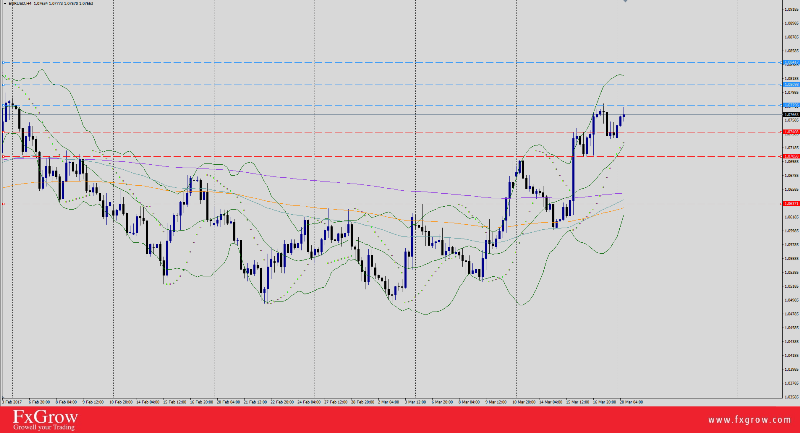
EUR/USD Prolongs Further Gains Ahead of Weidmann Speech
EURUSD_zpsxvilhupm.png


EUR/USD extended the bullish momentum for the fourth consecutive session and clocks 1.0765 on Monday’s trading session. Overall, the pair added +162-pips since last Wednesday as U.S Dollar dips furthermore and today U.S Index dipped to 99.81 Feb-8-fresh-lows.

Elections in Holland with PM Rutte declared winner over anti-Islam and anti-EU Wilders, boosted the EURO and kept hopes for the EU, and Netherlands is still in the EU frame. On the other hand, according to the Odoxa poll, Macron keeps the upper edge to win the French presidential election race ahead a first televised debate. (Reuters).

Macron, a former economy minister running as an independent centrist, would lead first-round voting with 26.5 percent, just ahead of far-right leader Marine Le Pen (Anti-EU) on 26 percent, before beating her 64-36 in the run-off

Overall, optimism over the EU has flourished after the Brexit harsh experience. Taking the current situation for pale greenback and political overviews in Europe, EUR/USD is heading for additional gains.

Fundamentals:

1- EUR- German Buba President Weidmann Speech today at 5:45 PM GMT.

2- USD - FOMC member Evans speech today at 5:10 PM GMT.

3- USD – President Trump speech today at 11:30 PM GMT.

Technical:

Trend: Bullish sideways

Resistance levels: R1 1.0774, R2 1.0809, R3 1.0841.

Support levels: S1 1.0740, S2 1.0705, S3 1.0637.

Remark: The market posture is bullish and signals for larger emerging upswing to reach R2. U.S Index is currently weak which gives the advantage for EUR/USD to reach for higher levels. A penetration for R1 level signals additional bullish waves towards R2&R3 levels. Stalling below S1 level holds the bullish trend temporarily. Closing below S3 level is needed for market trend reversal.

For more in depth Research & Analysis please visit FxGrow.http://fxgrow.com/analysis-educatio...cal-analysis-fxgrow-free-forex-analysis-tools

Note: This analysis is intended to provide general information and does not constitute the provision of INVESTMENT ADVICE. Investors should, before acting on this information, consider the appropriateness of this information having regard to their personal objectives, financial situation or needs. We recommend investors obtain investment advice specific to their situation before making any financial investment decision.
 
FxGrow Fundamental Analysis – 20th March, 2017
By FxGrow Investment Research Desk

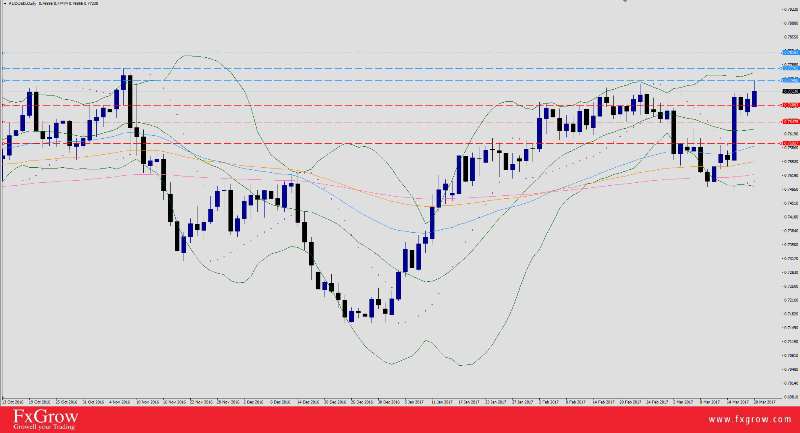
Aussie Surges to 2017-Fresh-highs Ahead of RBA Meeting
AUDUSD_zps6anrj3a1.png


AUD/USD is building on last week's strong gains and has surpassed it with a 2017-fresh-highs at 0.7747. The pair hawkish tone found comfort with US Dollar Index bottoming to 99.81 earlier today, lowest since 6 weeks and weaker US treasury bond yields were seen lending additional support to higher-yielding currencies - like the Aussie. As for AUD, eyes now are centered on RBA Monetary Policy Meeting and markets will be searching for clues as to a hawkish or dovish tilt from the minutes.

As for US Dollar, the greenback is on a date with FOMC member Evans, after that Trump speech with expectation of high volatility depending on the speech's content.

Fundamentals:

1- AUD- RBA Monetary Policy Meeting tomorrow 12:30 AM GMT.

2- USD - FOMC member Evans speech today at 5:10 PM GMT.

3- USD - President Trump speech today at 11:30 PM GMT.

Technical:

Daily Pp 0.7703

Resistance levels: R1 0.7748, R2 0.7787, R3 0.7816

Support levels : S1 0.7688, S2 0.7647, S3 0.7595

Remark : Currently US Index is weak which gives the advantage for the Aussie to score further gains but market should pay attention to Evans speech today, any hints about Fed hikes should boost US Dollar. Also, Trump's speech not to be missed. As for Australian Dollar, RBA meeting might project new insights for AUD depending on the hints sent. Closing above R1 suggests further attacks at R2 level. On the other hand, a penetration for S1 will increase selloffs and wash towards S2. Closing below S3 levels is a signal that the market has ended bullish waves and cable to be considered bearish with intensive declines.

For more in depth Research & Analysis please visit FxGrow.http://fxgrow.com/analysis-educatio...cal-analysis-fxgrow-free-forex-analysis-tools

Note: This analysis is intended to provide general information and does not constitute the provision of INVESTMENT ADVICE. Investors should, before acting on this information, consider the appropriateness of this information having regard to their personal objectives, financial situation or needs. We recommend investors obtain investment advice specific to their situation before making any financial investment decision.
 
FxGrow Fundamental Analysis – 21st March, 2017
By FxGrow Investment Research Desk

Sterling Digests Friday's highs, Eyes on Local Data
GBPUSD_zpsauxapfoh.png


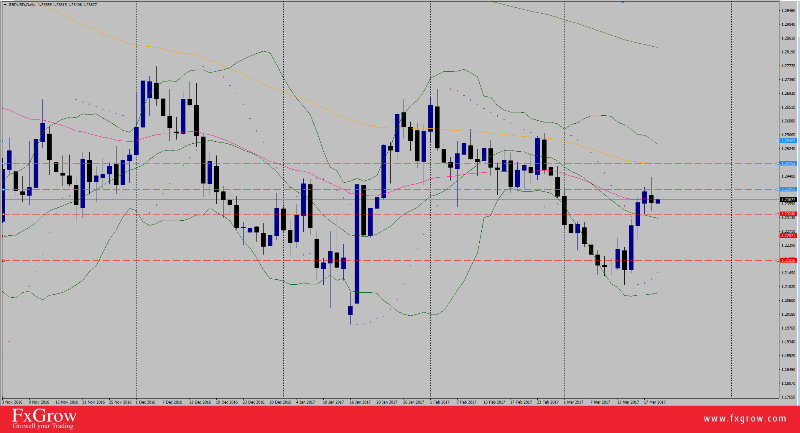
GBP/USD was on top performance since last Wednesday with +326-pips gains and 1.2435 high yesterday. The pair was jinxed by awakening U.S Dollar index, surging +$0.23 at 100.16 high weekly highs, currently 100.09 intraday with indications for additional bullish gains. GBP/USD failed to sustain the 1.24 level and plunged today to 1.2354 low.

UK Parliament gave authorization to PM May, set to release article 50 not longer by 29 March which will launch the Brexit process, starting a two-year time frame to get a smooth deal that satisfies both parts (EU&UK). Following the announcement, EU Commission chief spokesman Margaritis Schinas said at a briefing in Brussels that the EU is ready to begin talks "immediately" and that they had a comprehensive plan in place.

GBP/USD levels awaits multiple inflation figures today, including Producer Price Index, Consumer Price Index, and Retail Price Index, all of which will set the tone for GBP today and next week facing reviving USD. Just last week the BOE came out more hawkish than expected. They hinted that there is less of a barrier to rate hikes than some expect with one member voting for a hike outright. Rising inflation is a major concern of the Bank of England as they do not want to get behind the curve. If CPI ticks up over 2% in this reading it could move the pound. UK local data today will set the course for coming BOE interest rates decision and markets could start the process of pricing the market.

Fundamental:

1- GBP CPI today at 9:30 AM GMT.

2- GBP PPI today at 9:30 AM GMT.

3- GBP Public Sector Net Borrowing today at 9:30 AM GMT.

4- GBP RPI y/y today at 9:30 AM GMT.

5- GBP BOE Gov Carney Speech at 10:35 AM GMT.

Technical :

Daily Pp 1.2376

Trend : Bearish Sideways

Resistance levels : R1 1.2399, R2 1.2478, R3 1.2546.

Support levels : S1 1.2324, S2 1.2257, S3 1.2181.

Remark : UK data today not to be missed with indications for GBP/USD levels for the coming days as it will the set the course for BOE coming interest rates decision. Keep an eye on U.S Dollar Index. Closing below S1 is a reminder of last week's retracements and the pair could witness intensive declines and wash towards S2&S3 levels. On the other hand, stalling above R1 level is an indication for trend reversal with additional attacks bullish waves towards R2 level.

For more in depth Research & Analysis please visit FxGrow.http://fxgrow.com/analysis-educatio...cal-analysis-fxgrow-free-forex-analysis-tools

Note: This analysis is intended to provide general information and does not constitute the provision of INVESTMENT ADVICE. Investors should, before acting on this information, consider the appropriateness of this information having regard to their personal objectives, financial situation or needs. We recommend investors obtain investment advice specific to their situation before making any financial investment decision.
 
FxGrow Fundamental Analysis – 21st March, 2017
By FxGrow Investment Research Desk

Japanese Yen Sharpens Ahead of Local Data
USDJPY_zpsekogsfxa.png


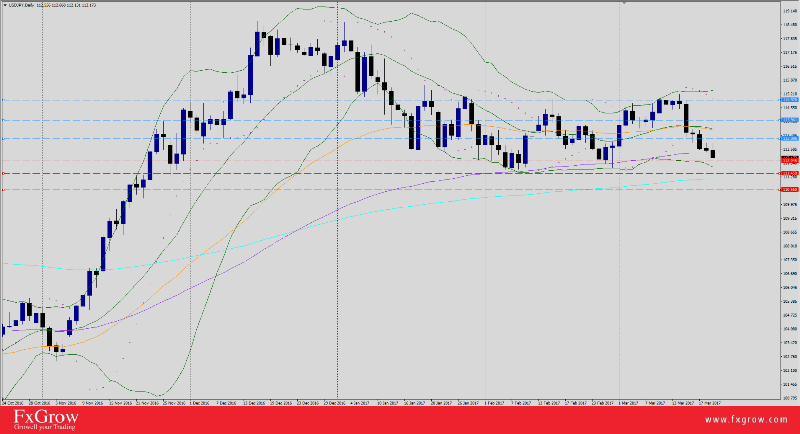
U.S Dollar lost the tight grip and all rivals are taking advantage of pale greenback with 99.53 low today and U.S index on the path of further losses. USD/JPY currently bearish and the pair added extra consecutive bearish session to 5 initial with 112.26 low, and with current situation of US Dollar, the pair might dip lower.

BOJ board member Iwata crossed the wires last minutes, via Reuters, making a speech in parliament.

Key Headlines:

"JPY Could Weaken Vs USD Based On Interest Rate Differentials"

"Stresses Rate Differentials Are Not Only Factor In Determining FX Levels"

"Difficult to narrow output gap weak yen"

Iwata confirmed that interest rates are not the only factor for Yen bullish gains taking into consideration the collapsing U.S Dollar.

Fundamentals:

1- JPY Monetary Policy Meeting Minutes today at 11:50 PM GMT.

2- JPY Japanese Trade Balance today at 11:50 PM GMT.

3- JPY All Industries Activity m/m tomorrow 4:30 AM GMT.

Technical:

Trend : Bearish

Resistance levels : R1 113.08, R2 113.96, R3 114.92

Support levels : S1 112.04, S2 111.45, S3 110.66

Remark : With U.S data empty pocket today and tomorrow, and taking current situation of weak US Dollar, the is set for additional losses. Keep an eye on US Index levels correlated with Yellen speech on Thursday. A penetration for R2 and closing above it is a signal for trend reversal. Be careful for setbacks on support and resistance levels as a first test.

For more in depth Research & Analysis please visit FxGrow.http://fxgrow.com/analysis-educatio...cal-analysis-fxgrow-free-forex-analysis-tools

Note: This analysis is intended to provide general information and does not constitute the provision of INVESTMENT ADVICE. Investors should, before acting on this information, consider the appropriateness of this information having regard to their personal objectives, financial situation or needs. We recommend investors obtain investment advice specific to their situation before making any financial investment decision.

 
FxGrow Fundamental Analysis – 21st March, 2017
By FxGrow Investment Research Desk

Oil levels Declines Over Concerns Of Bloated U.S Storage, Awaiting U.S Inventories
crude_zpshue1qvkq.jpg


Fundamentals :

Oil prices dipped on Wednesday at 47.80 low as rising crude stocks in the United States underscored an ongoing global fuel supply overhang despite an OPEC-led effort to cut output. U.S. crude oil inventories surged by 4.5 million barrels in the week to March 17 to 533.6 million barrels, the American Petroleum Institute (API) said late on Tuesday.

"The American Petroleum Institutes' crude inventories stuck the knife into crude overnight, coming in at a 4.5 million barrel increase against an expected increase of 2.8 million barrels," said Jeffrey Halley, senior market analyst at futures brokerage OANDA in Singapore.

"If the API stuck the knife in, tonight's EIA Crude Inventory figures may twist it. A blowout above the 2.1 million barrel increase expected, may well torpedo oil below the waterline," he added.

New production projects and a fresh shale boom could boost oil output by a million barrels per year and result in an oversupply in the next couple of years, according to Goldman Sachs.

OPEC's landmark decision to limit output for the first time in eight years in a bid to arrest the existing supply glut reduced price volatility and increased stability, unintentionally helping the shale producers, the bank said.

"OPEC's decision in November 2016 to cut production was rational, in our view, and fit into its role of inventory manager of last resort," Goldman said.

"However, the unintended consequence was to underwrite shale activity through a bullish credit market at a time when delayed delivery of the 2011-13 capex boom could lead to record non-OPEC production growth in 2018."

The Organization of the Petroleum Exporting Countries (OPEC) agreed to curb its output by about 1.2 million barrels per day (bpd) from Jan. 1 this year. Russia and 10 other non-OPEC producers agreed to jointly cut by an additional 600,000 bpd.

Sources within the Organization of the Petroleum Exporting Countries have indicated that its members increasingly favor extended production cuts but want the backing of non-OPEC oil producers, such as Russia, which have yet to deliver fully on existing reductions. ( CNBC )

PEC compliance in Feb 2017 was estimated over 94% which helped oil boosters to sustain levels above $52 bp on average but the war continues between the US and OPEC counties with opposed interests.

Russia has reduced oil production through first 2017 quarter by 200000 bpd and promised to increase further reductions to 300000 bdp by end of April or May with OPEC plan being in accord. According to sources to CNBC, OPEC is on the edge of striking a powerful strike where the cartel is considering extending initial Vienna deal till end of 2017 if OPEC and Non-OPEC counties agree to further oil reduction to curb market demand, but details about quotas were not specified. Markets, although OPEC next move is currently cooked in a low steam, are looking forward for such deal in which, in case established or achieved, should energize oil bullish levels back to Feb 2017 prices.

Conclusion : Currently US has the upper with increase shale drilling and inventories storage. The rift continues and the war tone is ascending between U.S and OPEC, each trying to drive oil levels higher and lower depending on their economic interests. Keep an eye on OPEC next chess move which will set oil course for the coming weeks. Look forward for U.S crude inventories today set for a release at 2:30 PM GMT.

Technical Overview

The market currently bearish due to the above mentioned data, but OPEC keep an eye on OPEC coming moves. If OPEC managed to struck the deal with extension till end of 2017, crude levels will sustain the $50>$52 levels. In absence of news from Organization of the Petroleum Exporting Countries, markets should expect further declines with $47<$46 as targets.

For more in depth Research & Analysis please visit FxGrow.http://fxgrow.com/analysis-education/fxgrow-academia/fxgrow-blog

Note: This analysis is intended to provide general information and does not constitute the provision of INVESTMENT ADVICE. Investors should, before acting on this information, consider the appropriateness of this information having regard to their personal objectives, financial situation or needs. We recommend investors obtain investment advice specific to their situation before making any financial investment decision.
 
FxGrow Fundamental Analysis – 22nd March, 2017
By FxGrow Investment Research Desk

Kiwi Trades flat Ahead of RBNZ's Wheeler Speech
NZDUSD_zpsjljqjc3u.png


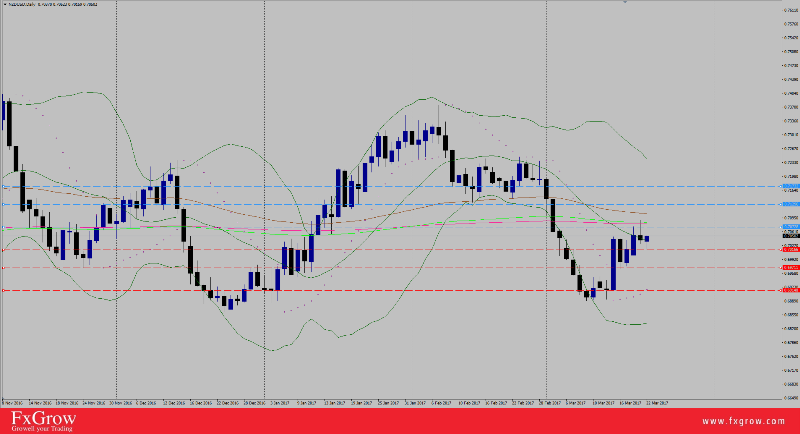
NZD/USD rallied yesterday to 0.7089 high following positive Global Diary Trade (GDT) with 1.7% compared to -6.3% on previous session. Kiwi boosters found comfort with collapsing U.S Index yesterday with 99.44 low. Today, the pair has managed to recover few pips from session low and is currently trading around 0.7032 handle. A fresh wave of global risk aversion, coupled with a modest US Dollar recovery from multi-week lows, has been key factors weighing on the major on Wednesday.

Eyes now are focused on RBNZ interest rate decision with high forecasts that rates to be left at current 1.75%. However, since rates are a done deal, the market will be looking for any hawkish signasl they can find from Gov Wheeler. This central bank is notorious for talking their currency down and Gov Wheeler may take this opportunity to drive the currency lower. However, if he sounds more upbeat or offers any hawkish hints there may be an opportunity to buy the kiwi.


Fundamentals:

1- NZD Interest Rate Decision today at 8:00 PM GMT.

2- NZD RBNZ Wheeler speech today at 8:00 PM GMT.

3- USD Unemployment Claims tomorrow at 12:30 PM GMT.

4- USD speech tomorrow at 12:45 PM GMT.

Technical:

Trend: Bearish Sideways

Resistance levels : R1 0.7072, R2 0.7129, R3 0.7132

Support levels : S1 0.7016, S2 0.6971 , S3 0.6914

Remark : Look forward for Kiwi local data today. U.S data tomorrow not to be missed especially Yellen speech which will determine U.S index levels for the coming days.

For more in depth Research & Analysis please visit FxGrow.http://fxgrow.com/analysis-educatio...cal-analysis-fxgrow-free-forex-analysis-tools

Note: This analysis is intended to provide general information and does not constitute the provision of INVESTMENT ADVICE. Investors should, before acting on this information, consider the appropriateness of this information having regard to their personal objectives, financial situation or needs. We recommend investors obtain investment advice specific to their situation before making any financial investment decision.
 
FxGrow Fundamental Analysis – 23rd March, 2017
By FxGrow Investment Research Desk

Gold Seeks Further Gains Over Crisp U.S Dollar, Eyes on Yellen
Gold_zps1gv9w8bu.png


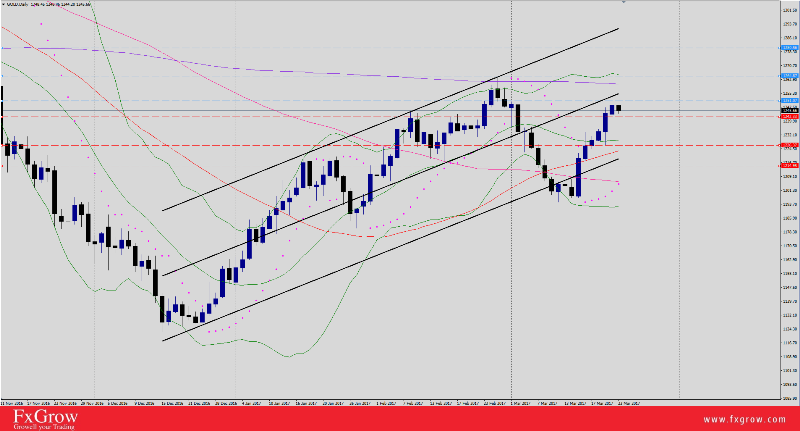
Gold has prolonged bullish trading session with a 1251.34 high yesterday and currently, XAUUSD is confined 47-pips range price action, slightly above 50-SMA (H1). Overall, gold added +$53.89 since March Fed hike. USD collapsed dramatically on Tuesday and extended losses yesterday at 99.32 low, digging deeper for 2017-new-lows at 99.19, which supported gold bullish momentum.

History and logic suggest that when the United States starts a monetary tightening cycle, gold will under-perform, since as a non-yielding asset it loses out to instruments that will enjoy higher yields from the rising rates.

According to the World Gold Council (WGC), China's gold demand has dropped this year, with third quarter consumer demand at 182.5 tons, down 22% from the same period in 2015, while India's 194.8 tons is 28% lower. Analysts are expecting China's and India's gold demand to remain steady in 2017.. China and India are the world's biggest gold-consuming nations.

Today, U.S economic data is heavy first with Unemployment claims which in case positive, should re-balance U.S index levels with upward correction, but the main focus is on Yellen speech and traders will try to decipher words and signals out of her speech.

Fundamentals:

1- USD unemployment rate today at 12:30 PM GMT.

2- USD Yellen speech today at 12:45 PM GMT.

Technical :

Trend : Bullish Sideways

Daily Pp 1247

Resistance levels : R1 1252.20, R2 1264.87, R3 1280.76

Support levels : S1 1242.33, S2 1230.62, S3 1218.83

Remark : Overall gold is bullish but U.S data today is vital especially Yellen speech in relation with low USD levels. Stalling above R1 level is a Déjà vu of last 2 weeks rallies with R2 level as target. Closing above R2 projects further bullish attacks at R3 level. A stall around 1251 could prompt setbacks, but trade should hold within Tuesday's range to maintain strong bull forces. Closing below S2 alerts for trend reversal and market to consider gold bearish. U.S index is the main player.

For more in depth Research & Analysis please visit FxGrow.http://fxgrow.com/analysis-educatio...cal-analysis-fxgrow-free-forex-analysis-tools

Note: This analysis is intended to provide general information and does not constitute the provision of INVESTMENT ADVICE. Investors should, before acting on this information, consider the appropriateness of this information having regard to their personal objectives, financial situation or needs. We recommend investors obtain investment advice specific to their situation before making any financial investment decision.

 
FxGrow Fundamental Analysis – 23rd March, 2017
By FxGrow Investment Research Desk

Wallowing U.S Index and Supper Yellen with Possible Scenarios
Yellen_zpsmcxbjqo6.jpg


Since FOMC epic decision with 0.25% hike to initial 0.75%, U.S Index has collapsed dramatically. After peeking to $102.26 Feb-highs, the Index has shed -$2.94 and anchored yesterday at $99.32, closing to 2017 lowest at $99.19. Below are the factors contributing to bearish U.S Index Foreces.

1- Markers had already priced in and traded on the fact that Fed hike was inevitable. So basically, the FOMC decision had zero contribution to the market "Buy the rumor sell the fact " fitted like the last peace of puzzle and the USD decline picture was drawn.

2- Traders were awaiting further instructions by Yellen and Co. about coming Fed hikes, but details were not listed.

3- Doubts about Trump's capacity to provide the right leadership for Republican party have been creeping into the market fueled by allegations about links of his election campaign with relation to Russian contributes and recent Trump's real estate bought by Russians as Greg Gibbs, Director at Amplifying Global FX Capital pointed yesterday. Also Trump's bombastic style including wild claims about wire taps for the white house when he addressed journalists in previous appearances.

Fact : Combine these above elements, no wonder why U.S Index has tumbled and in case of further declines, it's logic.

Now after we have briefed the above, the real question is, How will Yellen play along today when she appears preceded by U.S Unemployment Claims. If Yellen came out with promises about coming hikes, markets will start pricing in and trading on her words and the whole cycle ( U.S Index ) will be repeated again as Déjà vu. Recent speeches of FOMC's members Dudley and Evans with their declrelations supports the coming scenario further more. So, Yellen will try to avoid this scenario and turn into different aspect in which she will focus on how strong the U.S economy is supported by positive unemployment data, inflation rate, recent CPI, NFP, and retails sales which should boost U.S Index to a 100.46 where trend will make a reverse and turn bullish.

Remark: Previous unemployment claims were 240K and forecasts for today are 241, narrowing down the gaps between the number, skepticism or confusion about comparison between recent, initial, and forecasts will be tight. Traders always tend to read the data in different way when recent is more than forecasts but less then previous, along with it, bearish and bullish volatility.

For more in depth Research & Analysis please visit FxGrow.http://fxgrow.com/analysis-education/fxgrow-academia/fxgrow-blog

Note: This analysis is intended to provide general information and does not constitute the provision of INVESTMENT ADVICE. Investors should, before acting on this information, consider the appropriateness of this information having regard to their personal objectives, financial situation or needs. We recommend investors obtain investment advice specific to their situation before making any financial investment decision.
 
FxGrow Fundamental Analysis – 24th March, 2017
By FxGrow Investment Research Desk

EUR/USD Guarding Tuesday's Gains Ahead of Local Data
EURUSD_zps6mzaqi82.png


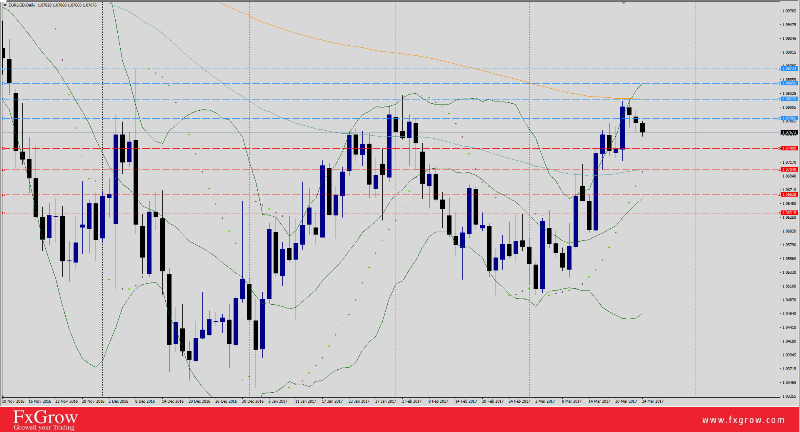
EUR/USD inaugurated Friday's trading sessions with aggressive selling and lost -26-pips after clocking a high 1.0786. The pair peeked to 1.0819 on Monday and prolonged additional 5-pips on Tuesday over arousing political optimism driven by Netherlands recent elections and French polls claiming Macron ahead of Le Pen ( Anti EU). However, the political optimism was jinxed by stingy reviving U.S Index today with a 99.79 high today.

Yesterday, U.S unemployment claims were negative with 258K compared to 241K on previous sessions but markets were focused on Yellen speech, and as always, Yellen will always be Yellen with her vague hints. Markets were expecting a support for U.S Index justified by Yellen timing and collapsing U.S Index, but the lady didn't even comment on monetary policy. Eyes today are shifted towards Trump health care program which should boost U.S Dollar up or down, depending on the final outcome.

Today, EU economic pocket is heavy from French and Germany, services and manufacturing PMI, which will give an estimate on how the EU economy is heading and it's health.

Fundamentals :

1- EUR - French Flash Manufacturing and services PMI today at 8:00 AM GMT.

2- -EUR - German Flash Manufacturing and services PMI today at 8:30 AM GMT.

3- EUR - EU Flash Manufacturing and services PMI today at 9:00 AM GMT.

4- USD - Core Durable Goods Orders today at 12:30 PM GMT.

Technical :

Trend : Bullish Sideways

Resistance levels : R1 1.0790, R2 1.0822, R3 1.0843, R4 1.0866

Support levels : S1 1.0744, S2 1.0705, S3 1.0662, S4 1.0635

Remark :Currently the pair is still considered bullish due to weaker U.S Dollar with sideways options due to the ebb and flow between EUR and USD. The above variety of economic news will decide how cable trend will settle in the coming hours. Keep an eyes on U.S index with coloration of U.S data and Trump health care voting today.

For more in depth Research & Analysis please visit FxGrow.http://fxgrow.com/analysis-education/fxgrow-academia/fxgrow-blog

Note: This analysis is intended to provide general information and does not constitute the provision of INVESTMENT ADVICE. Investors should, before acting on this information, consider the appropriateness of this information having regard to their personal objectives, financial situation or needs. We recommend investors obtain investment advice specific to their situation before making any financial investment decision.
 
FxGrow Fundamental Analysis – 24th March, 2017
By FxGrow Investment Research Desk

USD/CAD Remains Bullish Despite Bearish U.S Dollar
USDCAD_zpsqgwnsqxj.png


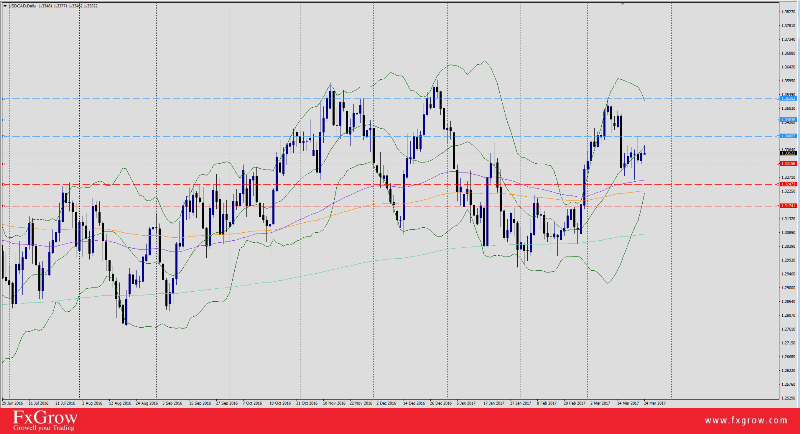
Although U.S Dollar is toothless for the past 12 consecutive sessions with 99.32 weekly-fresh-lows, USD/CAD remained bullish today and confined with 31-pips price action. Unlike USD rivals, the Loonie failed to take advantage of weaker U.S Dollar, tailed by collapsing crude oil levels for the past 2 weeks. The pair clocked 1.3377 high and currently shifting sail course and reversing daily bullish candle to inverse hammer candle supported by rising crude oil levels. The pair is currently trading 1.3354, slightly above its daily Pp 1.3341.

Loonie economic data is colorful today, but the main focus will be on Consumer Price Index ( CPI ), taking into consideration that inflation currently has reached 2.13%. Today's data could be an indicator for the coming BOC meeting for interest rates.

Fundamentals:

1- CAD - CPI today at 12:30 PM GMT.

2- CAD - CPI common, CPI median, and CPI trimmed y/y today at 12:30 PM GMT.

3- USD - Core Durable goods today at 12:30 PM GMT.

Technical :

Trend : Bullish sideways

Resistance levels : R1 1.3408, R2 1.3463, R3 1.3535

Support levels : S1 1.3315, S2 1.3247, S3 1.3174

Remark : Keep an eyes on U.S Index levels as its a measurement for USD/CAD performance. Also, Canadian today is vital on the short and long run.


For more in depth Research & Analysis please visit FxGrow.http://fxgrow.com/analysis-educatio...cal-analysis-fxgrow-free-forex-analysis-tools

Note: This analysis is intended to provide general information and does not constitute the provision of INVESTMENT ADVICE. Investors should, before acting on this information, consider the appropriateness of this information having regard to their personal objectives, financial situation or needs. We recommend investors obtain investment advice specific to their situation before making any financial investment decision.
 

Live Forex Chart

Currency
Rates
EUR / USD
1.12012
USD / JPY
158.449
GBP / USD
1.32573
USD / CHF
0.83257
USD / CAD
1.42077
EUR / JPY
177.339
AUD / USD
0.69840
Back
Top
Log in Register