BTC USD 83,204.4 Gold USD 4,110.89
Time now: Jun 1, 12:00 AM

Daily Technical Analysis by FxGrow

Daily Technical Analysis – 17th July, 2015
By FxGrow Research & Analysis Team

AUDUSD
AUDUSD17July15_zps2woibxzp.png


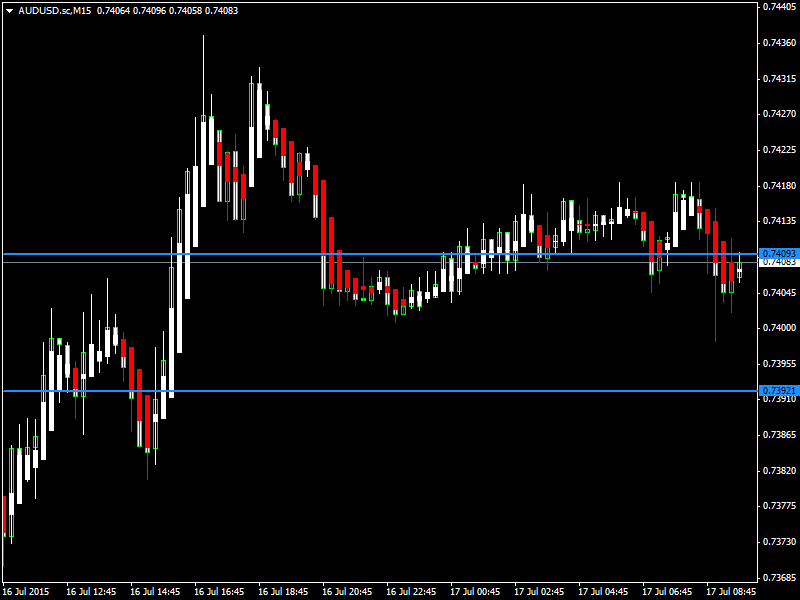
AUDUSD was bullish yesterday as it touched a high of 0.7434 and remained firm towards the end of the trading session. Now the pair is trading below its 20day moving average of 0.7411 in the European trading session. The near term bias remains Neutral to Bearish with targets of 0.7350

RSI (14), ADX (14) are Neutral; ADX (14), CCI (14), Ultimate Oscillator, ROC, MA100, MA200 indicate a SELL; STOCHRSI (14) is Oversold; while Average True Range (14) indicates Less Volatility.

Support is at 0.7349 while Resistance is at 0.7437

17th July 2015 – 07:11hrs GMT


USDJPY
USDJPY17July15_zpsxctdgskv.png


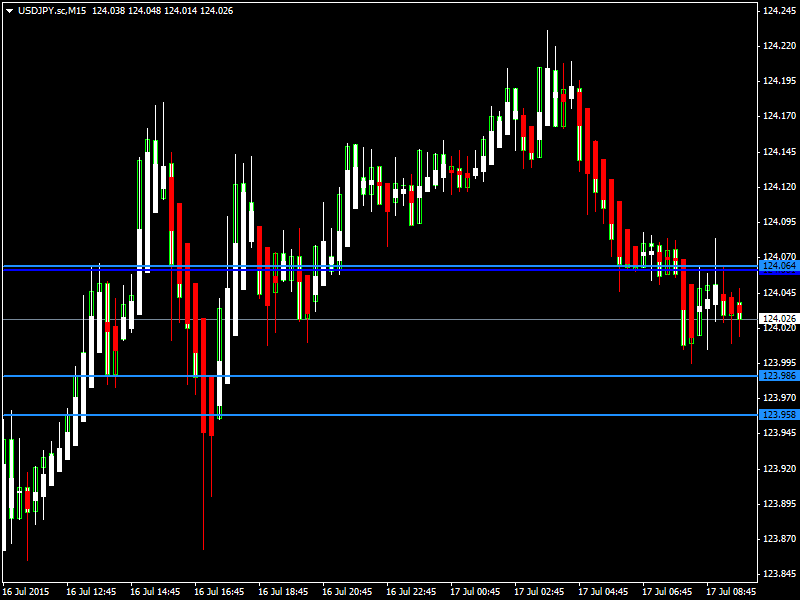
USDJPY was bullish yesterday as it touched a high of 124.16 and remained firm towards the end of the trading session. Now the pair is trading below its 20day moving average of 124.09 in the European trading session. The near term bias remains Bearish with targets of 123.50

RSI (14), STOCH (9, 6), ADX (14), CCI (14), Ultimate Oscillator, ROC indicate a SELL; STOCHRSI (14) is Oversold; while Average True Range (14) indicates Less Volatility.

Support is at 123.73 while Resistance is at 124.23

17th July2015 – 07:14hrs GMT

For more in depth Research & Analysis please visit FxGrow.

Note: This analysis is intended to provide general information and does not constitute the provision of INVESTMENT ADVICE. Investors should, before acting on this information, consider the appropriateness of this information having regard to their personal objectives, financial situation or needs. We recommend investors obtain investment advice specific to their situation before making any financial investment decision.
 
Daily Technical Analysis – 20th July, 2015
By FxGrow Research & Analysis Team

EURUSD

EURUSD20July15_zpsxft109yy.png


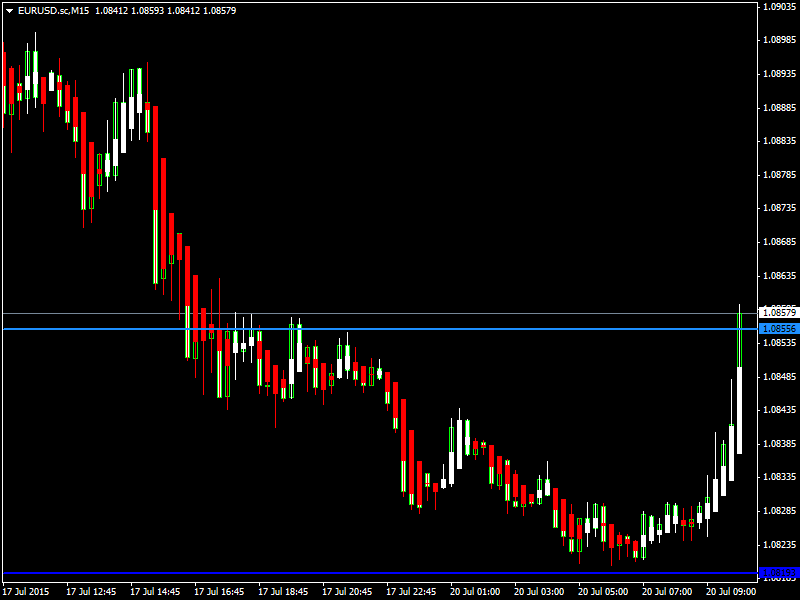
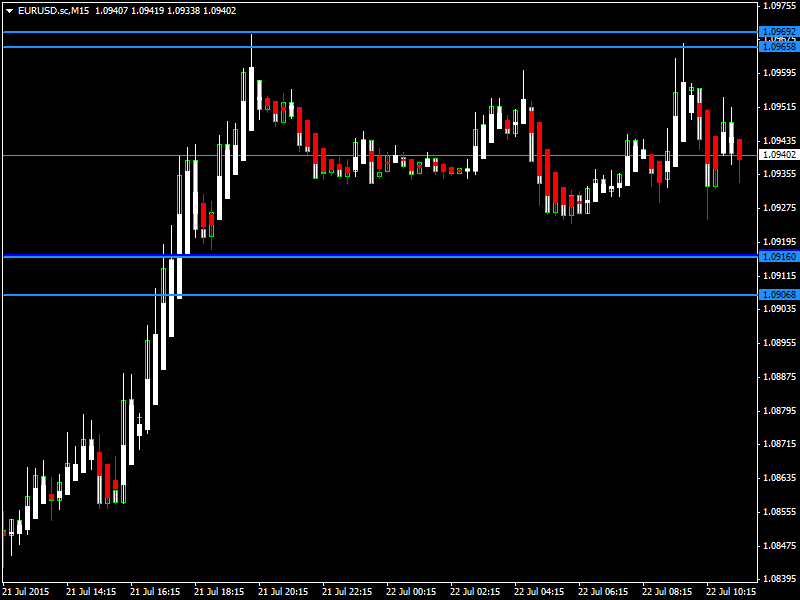
EURUSD had a bearish trend last week and opened this week lower touching a low of 1.0820 in the Asian trading session. Now the pair is trading above its 20day moving average of 1.0840 in the European trading session. The near term bias remains Neutral to Bullish with targets of 1.0910

RSI (14) is Neutral; ADX (14), CCI (14), Ultimate Oscillator, ROC indicate a BUY; STOCHRSI (14) is Overbought; while Average True Range (14) indicates Less Volatility.

Support is at 1.0820 while Resistance is at 1.0906

20th July 2015 – 07:21hrs GMT


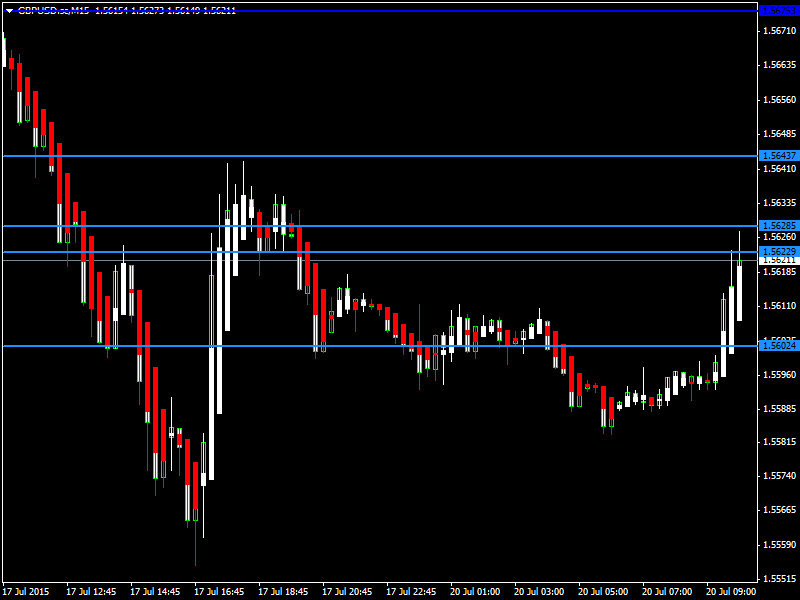
GBPUSD

GBPUSD20July15_zps9veghal9.png


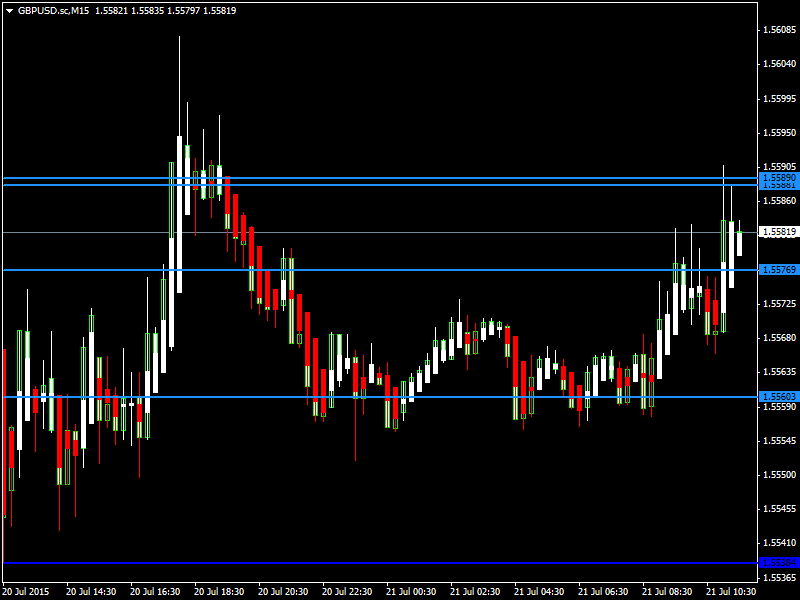
GBPUSD had a bullish trend last week and opened this week flat. Now the pair is trading above its 20day moving average of 1.5604 in the European trading session. The near term bias remains Neutral to Bullish with targets of 1.5700

RSI (14) is Neutral; ADX (14), CCI (14), ROC, MA100, MA200 indicate a BUY; STOCHRSI (14) is Overbought; while Average True Range (14) indicates Less Volatility.

Support is at 1.5589 while Resistance is at 1.5675

20th July 2015 – 07:26hrs GMT

For more in depth Research & Analysis please visit FxGrow.

Note: This analysis is intended to provide general information and does not constitute the provision of INVESTMENT ADVICE. Investors should, before acting on this information, consider the appropriateness of this information having regard to their personal objectives, financial situation or needs. We recommend investors obtain investment advice specific to their situation before making any financial investment decision.
 
Daily Technical Analysis – 20th July, 2015
By FxGrow Research & Analysis Team

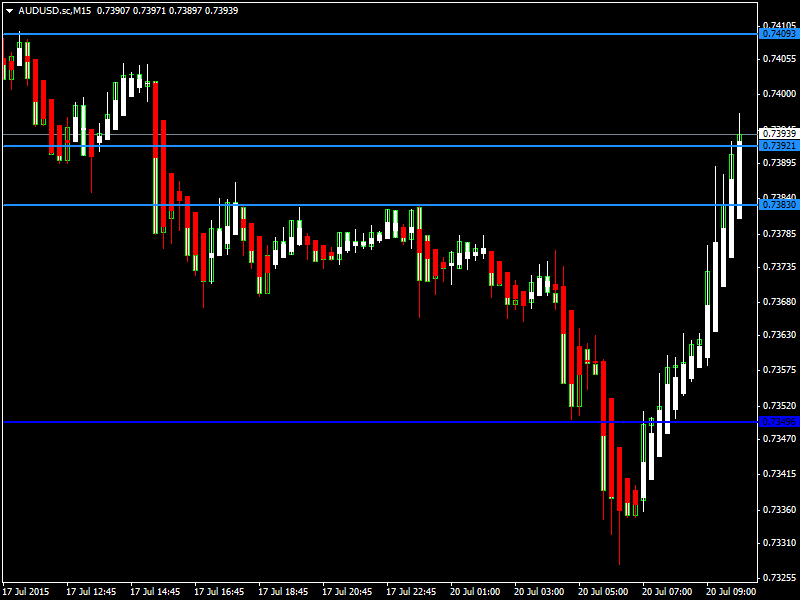
AUDUSD

AUDUSD20July15_zps2fr9auwd.png


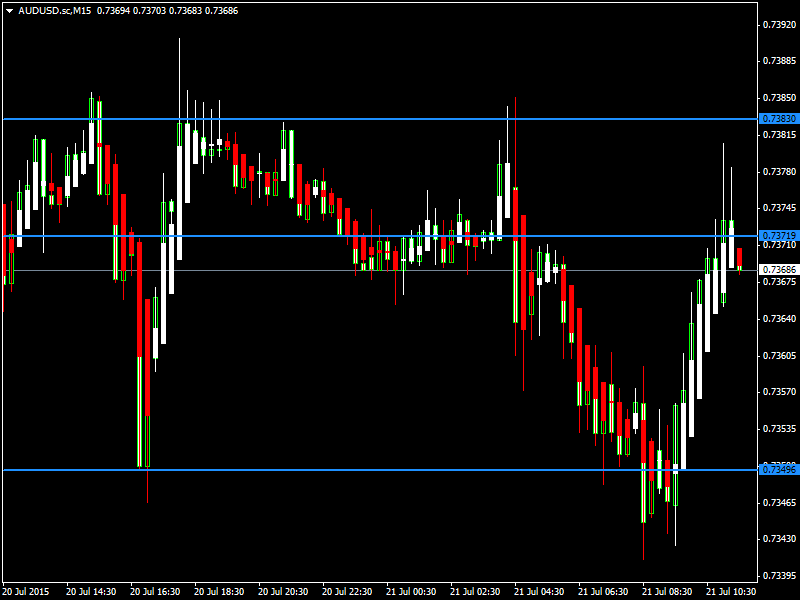
AUDUSD was indecisive last week and opened the week lower touching a low of 0.7326 in the Asian trading session. Now the pair is above its 20day moving average of 0.7371 in the European trading session. The near term bias remains Neutral to Bullish with targets of 0.7430

RSI (14), STOCH (9, 6) are Neutral; ADX (14), CCI (14), Ultimate Oscillator, ROC indicate a BUY; STOCHRSI (14) is Overbought; while Average True Range (14) indicates High Volatility.

Support is at 0.7334 while Resistance is at 0.7404

20th July 2015 – 07:34hrs GMT


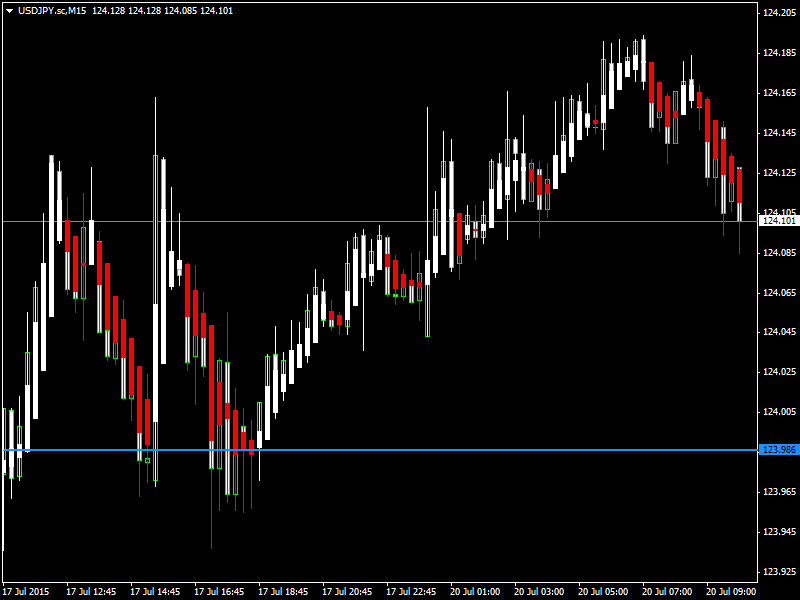
USDJPY

USDJPY20July15_zpsrpxkrmjz.png


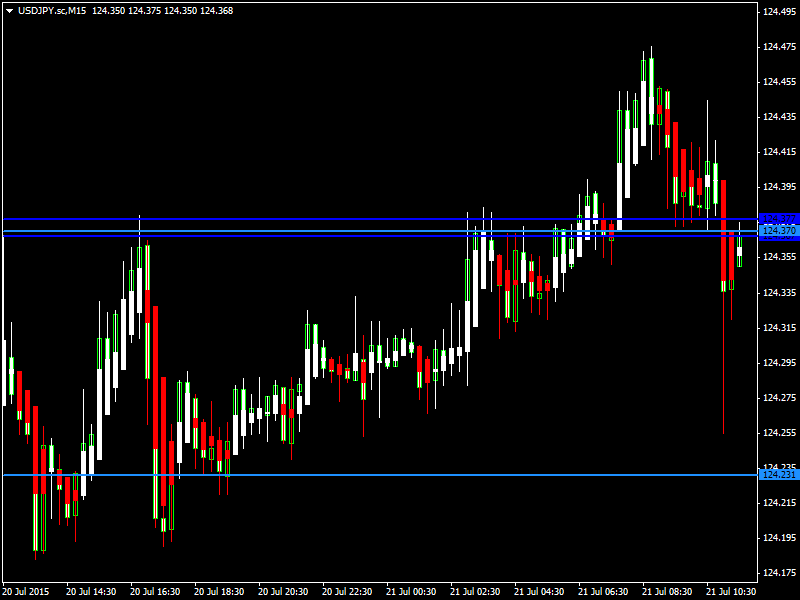
USDJPY was bullish last week and opened the week at 124.03 today. Now the pair is trading below its 20day moving average of 124.10 in the European trading session. The near term bias remains Neutral to Bullish with targets of 124.70

RSI (14), CCI (14) are Neutral; STOCH (9, 6), MACD (12, 26), Ultimate Oscillator, ROC, MA100, MA200 indicate a BUY; STOCHRSI (14) is Oversold; while Average True Range (14) indicates Less Volatility.

Support is at 123.91 while Resistance is at 124.19

20th July2015 – 07:41hrs GMT

For more in depth Research & Analysis please visit FxGrow.

Note: This analysis is intended to provide general information and does not constitute the provision of INVESTMENT ADVICE. Investors should, before acting on this information, consider the appropriateness of this information having regard to their personal objectives, financial situation or needs. We recommend investors obtain investment advice specific to their situation before making any financial investment decision.
 
Daily Technical Analysis – 21st July, 2015
By FxGrow Research & Analysis Team

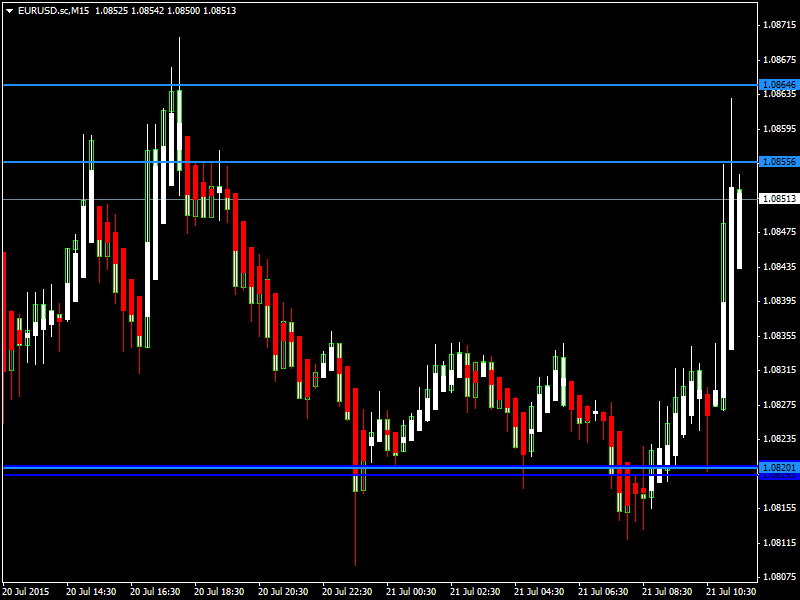
EURUSD

EURUSD21July15_zpsn2sp7h13.png


EURUSD was indecisive yesterday as it touched a high of 1.0866 and a low of 1.0815 remaining weak towards the end of the trading session. Now the pair is trading above its 20day moving average of 1.0833 in the European trading session. The near term bias remains Bullish with targets of 1.0900

RSI (14), ADX (14), Ultimate Oscillator, ROC indicate a BUY; STOCHRSI (14) is Overbought; while Average True Range (14) indicates Less Volatility.

Support is at 1.0820 while Resistance is at 1.0864

21st July 2015 – 08:45hrs GMT


GBPUSD

GBPUSD21July15_zpsk0hnxgkq.png


GBPUSD was indecisive yesterday as it touched a high of 1.5625 and a low of 1.5537 remaining weak towards the end of the trading session. Now the pair is trading above its 20day moving average of 1.5569 in the European trading session. The near term bias remains Neutral to Bearish with targets of 1.5500

RSI (14), ADX (14) are Neutral; STOCH (9, 6), MACD (12, 26), Ultimate Oscillator, MA100 indicate a SELL; STOCHRSI (14) is Overbought; while Average True Range (14) indicates Less Volatility.

Support is at 1.5538 while Resistance is at 1.5588

21st July 2015 – 08:53hrs GMT

For more in depth Research & Analysis please visit FxGrow.

Note: This analysis is intended to provide general information and does not constitute the provision of INVESTMENT ADVICE. Investors should, before acting on this information, consider the appropriateness of this information having regard to their personal objectives, financial situation or needs. We recommend investors obtain investment advice specific to their situation before making any financial investment decision.c
 
Daily Technical Analysis – 21st July, 2015
By FxGrow Research & Analysis Team

AUDUSD

AUDUSD21July15_zpsbmbpq1s1.png


AUDUSD was bearish yesterday as it touched a low of 0.7340 remaining weak towards the end of the trading session. Now the pair is trading just above its 20day moving average of 0.7368 in the European trading session. The near term bias remains Neutral to Bearish with targets of 0.7300

RSI (14) is Neutral; STOCH (9, 6), MACD (12, 26), ROC, MA100, MA200 indicate a SELL; STOCHRSI (14) is Overbought; while Average True Range (14) indicates High Volatility.

Support is at 0.7327 while Resistance is at 0.7383

21st July 2015 – 08:58hrs GMT


USDJPY

USDJPY21July15_zpsc8ngkor4.png


USDJPY was slightly bullish yesterday but did not make any significant moves. Now the pair is trading just below its 20day moving average of 124.33 in the European trading session. The near term bias remains Neutral to Bullish with targets of 124.75

RSI (14), CCI (14) are Neutral; STOCH (9, 6), MACD (12, 26), ADX (14), Ultimate Oscillator, ROC, MA100, MA200 indicate a BUY; STOCHRSI (14) is Oversold; while Average True Range (14) indicates Less Volatility.

Support is at 124.23 while Resistance is at 124.47

21st July2015 – 09:06hrs GMT

For more in depth Research & Analysis please visit FxGrow.

Note: This analysis is intended to provide general information and does not constitute the provision of INVESTMENT ADVICE. Investors should, before acting on this information, consider the appropriateness of this information having regard to their personal objectives, financial situation or needs. We recommend investors obtain investment advice specific to their situation before making any financial investment decision.
 
Daily Technical Analysis – 22nd July, 2015
By FxGrow Research & Analysis Team

EURUSD

EURUSD22July15_zps4y9wlfhi.png


EURUSD was bullish yesterday as it touched a high of 1.0967 yesterday and remained firm towards the end of the trading session. Now the pair is trading just above its 20day moving average of 1.0938 in the European trading session. The near term bias remains Neutral to Bullish with targets of 1.1000

CCI (14) is Neutral; RSI (14), MACD (12, 26), Ultimate Oscillator, MA100 indicate a BUY; STOCHRSI (14) is Oversold; while Average True Range (14) indicates Less Volatility.

Support is at 1.0819 while Resistance is at 1.0969

22nd July 2015 – 08:30hrs GMT


GBPUSD

GBPUSD22July15_zpsseqdjmfl.png


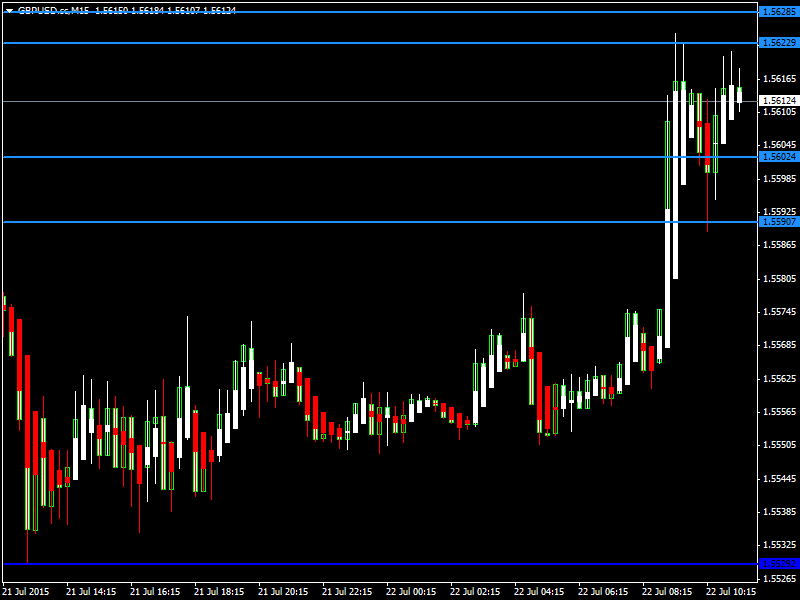
GBPUSD was indecisive yesterday and remained in a range bound trading towards the end of the trading session. Now the pair is trading above its 20day moving average of 1.5568 in the European trading session. The near term bias remains Bullish with targets of 1.5650

RSI (14), ADX (14), MACD (12, 26), Ultimate Oscillator, ROC, MA100, MA200 indicate a BUY; STOCHRSI (14) is Overbought; while Average True Range (14) indicates High Volatility.

Support is at 1.5529 while Resistance is at 1.5650

22nd July 2015 – 08:43hrs GMT

For more in depth Research & Analysis please visit FxGrow.

Note: This analysis is intended to provide general information and does not constitute the provision of INVESTMENT ADVICE. Investors should, before acting on this information, consider the appropriateness of this information having regard to their personal objectives, financial situation or needs. We recommend investors obtain investment advice specific to their situation before making any financial investment decision.
 
Daily Technical Analysis – 22nd July, 2015
By FxGrow Research & Analysis Team

AUDUSD

AUDUSD22July15_zpsb7rq6bay.png


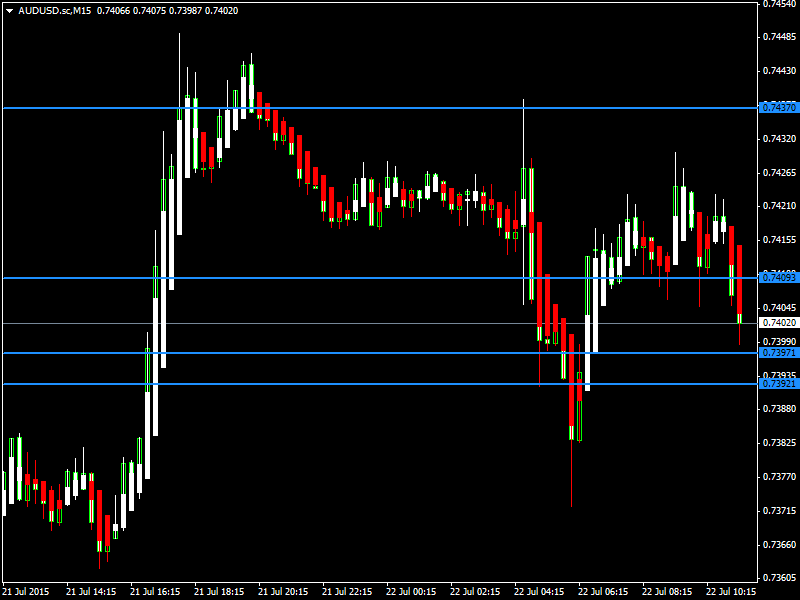
AUDUSD was bullish yesterday as it touched a high of 0.7444 remaining strong towards the end of the trading session. Now the pair is trading just below its 20day moving average of 0.7419 in the European trading session. The near term bias remains Neutral to Bearish with targets of 0.7350

RSI (14) is Neutral; ADX (14), CCI (14), ROC, MA200 indicate a SELL; STOCHRSI (14) is Oversold; while Average True Range (14) indicates Less Volatility.

Support is at 0.7392 while Resistance is at 0.7449

22nd July 2015 – 09:07hrs GMT


USDJPY

USDJPY22July15_zps5wlbhtez.png


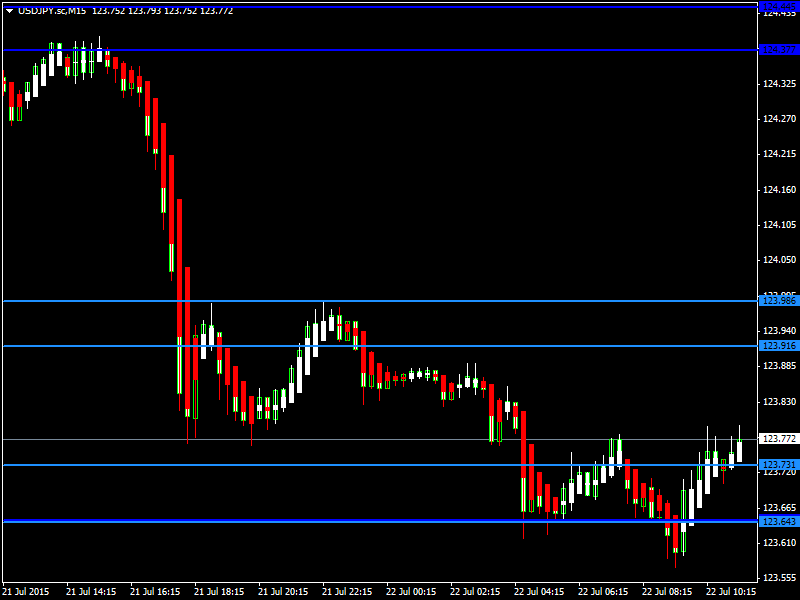
USDJPY was bearish yesterday as it touched a low of 123.77 and remained weak towards the end of the trading session. Now the pair is trading just below its 20day moving average of 123.80 in the European trading session. The near term bias remains Bearish with targets of 123.10

RSI (14), STOCH (9, 6), MACD (12, 26), ADX (14), Ultimate Oscillator, ROC, MA100 indicate a SELL; STOCHRSI (14) is Overbought; while Average True Range (14) indicates Less Volatility.

Support is at 123.64 while Resistance is at 124.44

22nd July2015 – 09:12hrs GMT

For more in depth Research & Analysis please visit FxGrow.

Note: This analysis is intended to provide general information and does not constitute the provision of INVESTMENT ADVICE. Investors should, before acting on this information, consider the appropriateness of this information having regard to their personal objectives, financial situation or needs. We recommend investors obtain investment advice specific to their situation before making any financial investment decision.
 
Daily Technical Analysis – 23rd July, 2015
By FxGrow Research & Analysis Team

EURUSD

EURUSD23July15_zpskgxbafuf.png


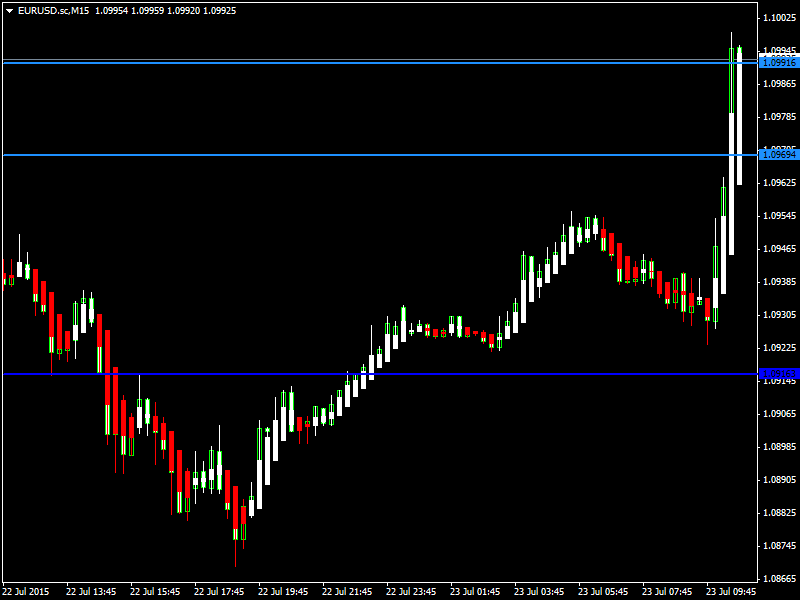
EURUSD was indecisive yesterday as it touched a high of 1.0961 and a low of 1.0871 remaining weak towards the end of the trading session. Now the pair is trading above its 20day moving average of 1.0925 in the European trading session. The near term bias remains Bullish with targets of 1.1050

RSI (14), MACD (12, 26), ADX (14), Ultimate Oscillator, ROC, MA100, MA200 indicate a BUY; STOCHRSI (14) is Overbought; while Average True Range (14) indicates Less Volatility.

Support is at 1.0916 while Resistance is at 1.0991

23rd July 2015 – 07:51hrs GMT


GBPUSD

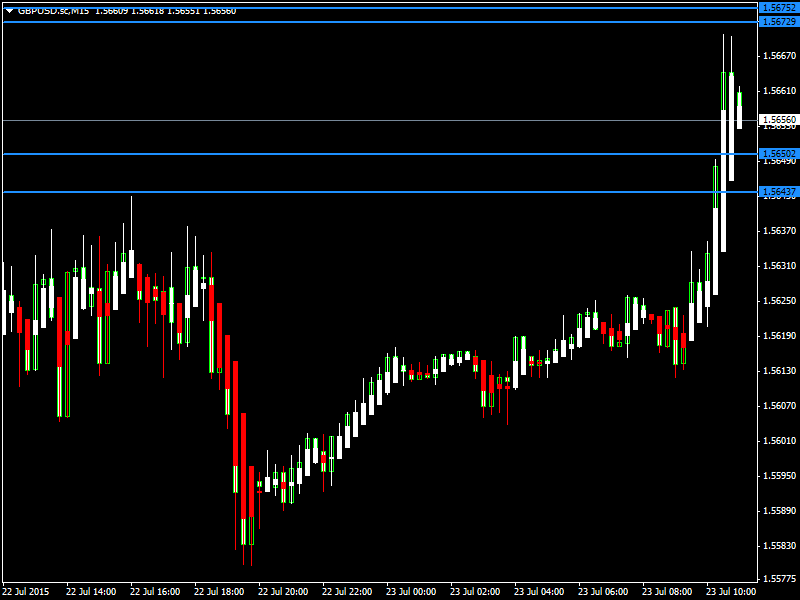
GBPUSD23July15_zpsitbc0g6r.png


GBPUSD was bullish yesterday as it touched a high of 1.5638 yesterday but came down towards the end of the trading session. Now the pair is trading above its 20day moving average of 1.5619 in the European trading session. The near term bias remains Bullish with targets of 1.5700

RSI (14), ADX (14), MACD (12, 26), Ultimate Oscillator, ROC, MA100, MA200 indicate a BUY; STOCHRSI (14) is Overbought; while Average True Range (14) indicates Less Volatility.

Support is at 1.5631 while Resistance is at 1.5731

23rd July 2015 – 08:11hrs GMT

For more in depth Research & Analysis please visit FxGrow.

Note: This analysis is intended to provide general information and does not constitute the provision of INVESTMENT ADVICE. Investors should, before acting on this information, consider the appropriateness of this information having regard to their personal objectives, financial situation or needs. We recommend investors obtain investment advice specific to their situation before making any financial investment decision.
 
Daily Technical Analysis – 23rd July, 2015
By FxGrow Research & Analysis Team

AUDUSD

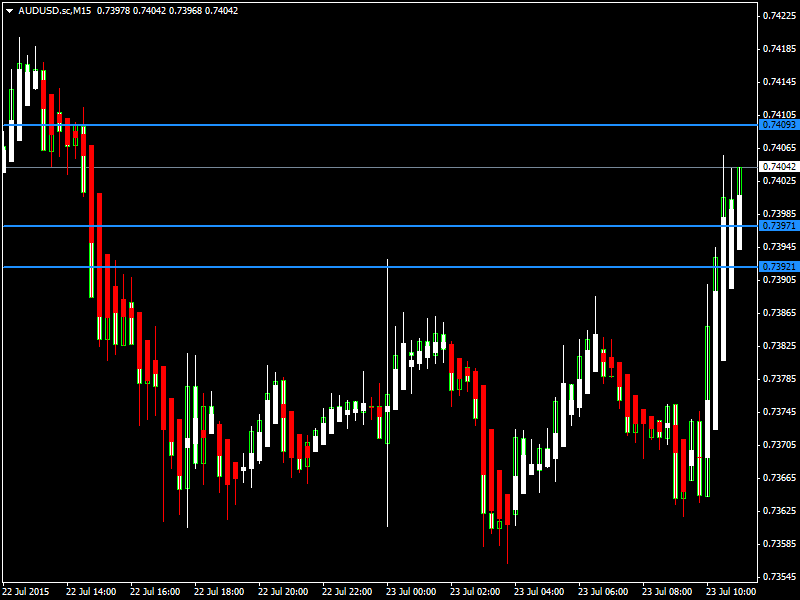
AUDUSD23July15_zpsukjtwknp.png


AUDUSD was bearish yesterday as it touched a low of 0.7360 and remained weak towards the end of the trading session. Now the pair is trading above its 20day moving average of 0.7377 in the European trading session. The near term bias remains Neutral to Bullish with targets of 0.7450

STOCH (9, 6), ADX (14) are Neutral; RSI (14), Ultimate Oscillator, ROC, MA100, MA200 indicate a BUY; STOCHRSI (14) is Overbought; while Average True Range (14) indicates Less Volatility.

Support is at 0.7374 while Resistance is at 0.7456

23rd July 2015 – 08:29hrs GMT


USDJPY

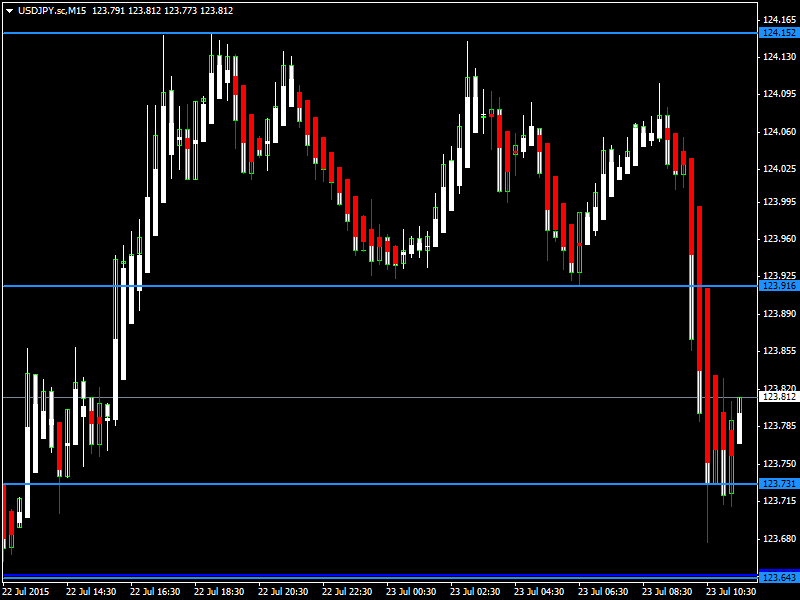
USDJPY23July15_zpsdk2yujlp.png


USDJPY was bullish yesterday as it touched a high of 124.13 and remained strong towards the end of the trading session. Now the pair is trading below its 20day moving average of 124.00 in the European trading session. The near term bias remains Bearish with targets of 123.00

RSI (14), MACD (12, 26), Ultimate Oscillator, ROC, MA100, MA200 indicate a SELL; STOCHRSI (14) is Oversold; while Average True Range (14) indicates High Volatility.

Support is at 123.57 while Resistance is at 124.15

23rd July2015 – 08:34hrs GMT

For more in depth Research & Analysis please visit FxGrow.

Note: This analysis is intended to provide general information and does not constitute the provision of INVESTMENT ADVICE. Investors should, before acting on this information, consider the appropriateness of this information having regard to their personal objectives, financial situation or needs. We recommend investors obtain investment advice specific to their situation before making any financial investment decision.
 
Daily Technical Analysis – 27th July, 2015
By FxGrow Research & Analysis Team

EURUSD

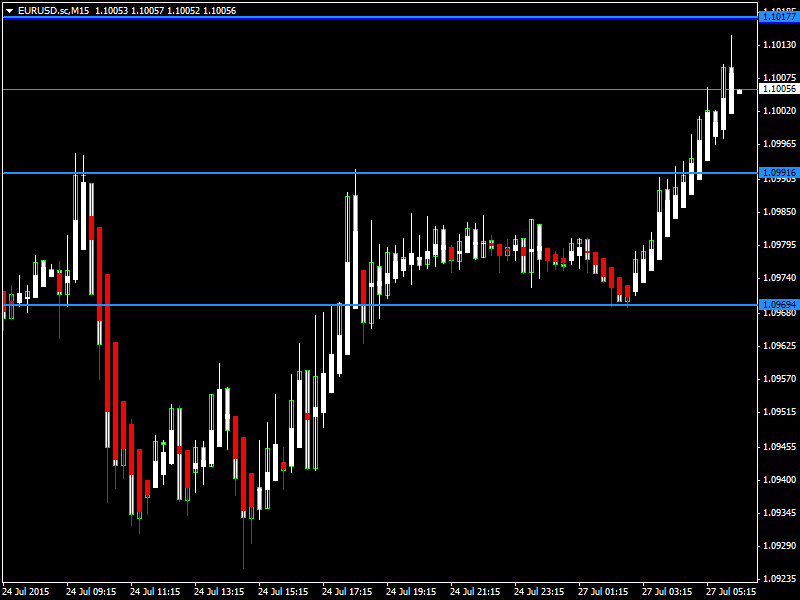
EURUSD27July15_zpsolx3bkbx.png


EURUSD was bearish last week and opened the week higher in the early Asian trading session. Now the pair is trading above its 20day moving average of 1.0971 in the Asian trading session. The near term bias remains Bullish with targets of 1.1070

RSI (14), STOCH (9, 6), MACD (12, 26), ADX (14), Ultimate Oscillator, ROC, MA100, MA200 indicate a BUY; STOCHRSI (14) is Overbought; while Average True Range (14) indicates Less Volatility.

Support is at 1.0969 while Resistance is at 1.1017

27th July 2015 – 03:21hrs GMT


GBPUSD

GBPUSD27July15_zpsyqrnqmen.png


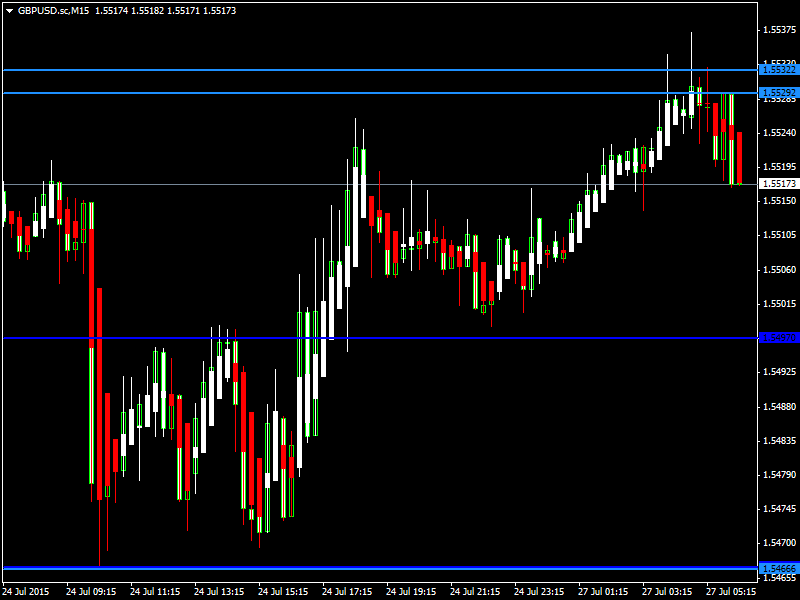
GBPUSD was bullish last week and opened the week lower in the early Asian trading session. Now the pair is trading above its 20day moving average of 1.5507 in the Asian trading session. The near term bias remains Neutral to Bullish with targets of 1.5580

RSI (14) is Neutral; STOCH (9, 6), ADX (14), CCI (14), Ultimate Oscillator, ROC indicate a BUY; while Average True Range (14) indicates Less Volatility.

Support is at 1.5466 while Resistance is at 1.5532

27th July 2015 – 03:25hrs GMT

For more in depth Research & Analysis please visit FxGrow.

Note: This analysis is intended to provide general information and does not constitute the provision of INVESTMENT ADVICE. Investors should, before acting on this information, consider the appropriateness of this information having regard to their personal objectives, financial situation or needs. We recommend investors obtain investment advice specific to their situation before making any financial investment decision.
 

Live Forex Chart

Currency
Rates
EUR / USD
1.11974
USD / JPY
158.007
GBP / USD
1.32144
USD / CHF
0.83279
USD / CAD
1.42544
EUR / JPY
176.990
AUD / USD
0.69624
Back
Top
Log in Register