BTC USD 86,110.4 Gold USD 4,161.99
Time now: Jun 1, 12:00 AM

Daily Technical Analysis by FxGrow

Daily Technical Analysis – 02nd July, 2015
By FxGrow Research & Analysis Team

EURUSD

eg4zfb.jpg


EURUSD was broadly lower yesterday and touched a low of 1.1051 and remained weak towards the end of the trading session. Now the pair is trading just near its 20day moving average of 1.1071 in the European trading session. The near term bias remains Neutral to Bearish with targets of 1.1010

STOCH (9, 6), ADX (14), CCI (14) are Neutral; RSI (14), MACD (12, 26), Ultimate Oscillator, ROC, MA100, MA200 indicate a SELL; STOCHRSI (14) is Overbought; while Average True Range (14) indicates Less Volatility.

Support is at 1.1031 while Resistance is at 1.1134

02nd July 2015 – 04:33hrs GMT


GBPUSD

6jlzbq.jpg


GBPUSD was bearish yesterday and touched a low of 1.5606 remaining weak towards the end of the trading session. Now the pair is trading below its 20day moving average of 1.5621 in the European trading session. The near term bias remains Neutral to Bearish.

STOCH (9, 6), CCI (14) are Neutral; RSI (14), ADX (14), MACD (12, 26), Ultimate Oscillator, ROC indicate a SELL; while Average True Range (14) indicates Less Volatility.

Support is at 1.5587 while Resistance is at 1.5652

02nd July 2015 – 04:43hrs GMT

For more in depth Research & Analysis please visit FxGrow.

Note: This analysis is intended to provide general information and does not constitute the provision of INVESTMENT ADVICE. Investors should, before acting on this information, consider the appropriateness of this information having regard to their personal objectives, financial situation or needs. We recommend investors obtain investment advice specific to their situation before making any financial investment decision.
 
Daily Technical Analysis – 02nd July, 2015
By FxGrow Research & Analysis Team

AUDUSD

14ya0w7.jpg


AUDUSD was moderately higher yesterday touching a high of 0.7714 but then it came down towards the end of the trading session. Now the pair is trading just below its 20day moving average of 0.7659 in the European trading session. The near term bias remains Neutral to Bearish with targets of 0.7600

CCI (14), STOCH (9, 6) are Neutral; MACD (12, 26), RSI(14), ROC, MA100, MA200 indicate a SELL; STOCHRSI (14) is Overbought; while Average True Range (14) indicates Less Volatility.

Support is at 0.7634 while Resistance is at 0.7738

02nd July 2015 – 04:49hrs GMT


USDJPY

1ffhjl.jpg


USDJPY was bullish yesterday and remained firm towards the end of the trading session. Now it is trading above its 20day moving average of 123.16 in the European trading session. The near term bias remains Bullish with targets of 124.00

RSI (14), STOCH (9, 6), MACD (12, 26), ADX (14), CCI (14), Ultimate Oscillator, ROC indicate a BUY; while Average True Range (14) indicates Less Volatility.

Support is at 122.60 while Resistance is at 122.89

02nd July 2015 – 04:58hrs GMT

For more in depth Research & Analysis please visit FxGrow.

Note: This analysis is intended to provide general information and does not constitute the provision of INVESTMENT ADVICE. Investors should, before acting on this information, consider the appropriateness of this information having regard to their personal objectives, financial situation or needs. We recommend investors obtain investment advice specific to their situation before making any financial investment decision.
 
Daily Technical Analysis – 03rd July, 2015
By FxGrow Research & Analysis Team

EURUSD

21b57dk.jpg


EURUSD remained indecisive yesterday with a mild recovery on the upper side. Now the pair is trading just above its 20day moving average of 1.1087 in the Asian trading session. The near term bias remains Neutral to Bullish with targets of 1.1150

STOCH (9, 6) is Neutral; RSI (14), STOCHRSI (14), MACD (12, 26), ADX (14), Ultimate Oscillator, ROC indicate a BUY; while Average True Range (14) indicates Less Volatility.

Support is at 1.1048 while Resistance is at 1.1119

03rd July 2015 – 04:00hrs GMT


GBPUSD

34qsc91.jpg


GBPUSD remained indecisive yesterday as it touched a low of 1.5560 and a high of 1.5638. Now the pair is trading just above its 20day moving average of 1.5608 in the Asian trading session. The near term bias remains Neutral to Bullish with targets of 1.5660

STOCH (9, 6), CCI (14) are Neutral; RSI (14), ADX (14), MACD (12, 26), Ultimate Oscillator, ROC indicate a SELL; while Average True Range (14) indicates Less Volatility.

Support is at 1.5560 while Resistance is at 1.5624

03rd July 2015 – 04:08hrs GMT

For more in depth Research & Analysis please visit FxGrow.

Note: This analysis is intended to provide general information and does not constitute the provision of INVESTMENT ADVICE. Investors should, before acting on this information, consider the appropriateness of this information having regard to their personal objectives, financial situation or needs. We recommend investors obtain investment advice specific to their situation before making any financial investment decision.
 
Daily Technical Analysis – 03rd July, 2015
By FxGrow Research & Analysis Team

AUDUSD

xpoivn.jpg


AUDUSD was lower yesterday and touched a low of 0.7588 but then it corrected upwards towards the end of the trading session. Now the pair is trading below its 20day moving average of 0.7618 in the Asian trading session. The near term bias remains Neutral to Bearish with targets of 0.7510

STOCH (9, 6) is Neutral; MACD (12, 26), ADX (14), CCI (14), Ultimate Oscillator, ROC, MA100, MA200 indicate a SELL; STOCHRSI (14) is Oversold; while Average True Range (14) indicates Less Volatility.

Support is at 0.7572 while Resistance is at 0.7616

03rd July 2015 – 04:14hrs GMT


USDJPY

11liedt.jpg


USDJPY moved upwards hitting a top of 123.70 but then it corrected lower towards the end of the trading session. Now it is trading below its 20day moving average of 123.13 in the Asian trading session. The near term bias remains Neutral to Bearish.

RSI (14), ADX (14), CCI (14) are Neutral; MACD (12, 26), ROC, MA200 indicate a SELL; while Average True Range (14) indicates Less Volatility.

Support is at 122.80 while Resistance is at 123.70

03rd July 2015 – 04:20hrs GMT

For more in depth Research & Analysis please visit FxGrow.

Note: This analysis is intended to provide general information and does not constitute the provision of INVESTMENT ADVICE. Investors should, before acting on this information, consider the appropriateness of this information having regard to their personal objectives, financial situation or needs. We recommend investors obtain investment advice specific to their situation before making any financial investment decision.
 
very easy to understand..keep it up !
 
Daily Technical Analysis – 06th July, 2015
By FxGrow Research & Analysis Team

EURUSD

EURUSD06July15_zps7saxqxjo.png


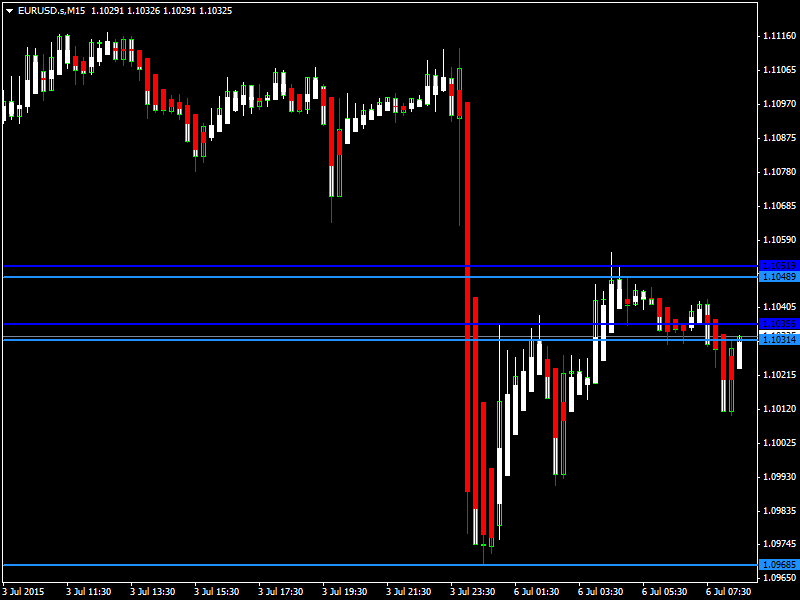
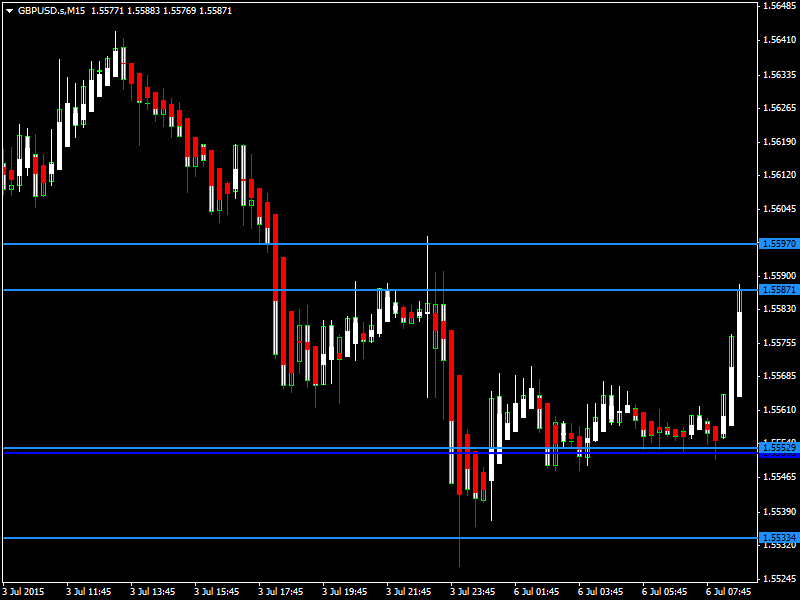
EURUSD opened the week lower touching a low of 1.0968 in the early Asian trading session. Now the pair is trading just below its 20day moving average of 1.1065 in the European trading session. The near term bias remains Neutral to Bearish with targets of 1.0950

RSI (14), STOCH (9, 6) are Neutral; MACD (12, 26), ADX (14), Ultimate Oscillator, ROC, MA100, MA200 indicate a SELL; while Average True Range (14) indicates High Volatility.

Support is at 1.1031 while Resistance is at 1.1117

06th July 2015 – 05:46hrs GMT


GBPUSD

GBPUSD06July15_zps4ifgojlv.png


GBPUSD opened the week lower touching a low of 1.5538 in the early Asian trading session. Now the pair is trading just above its 20day moving average of 1.5580 in the European trading session. The near term bias remains Neutral to Bearish with targets of 1.5500

RSI (14) is Neutral; STOCH (9, 6), MACD (12, 26), Ultimate Oscillator, MA100, MA200 indicate a SELL; while Average True Range (14) indicates Less Volatility.
Support is at 1.5552 while Resistance is at 1.5624

06th July 2015 – 06:01hrs GMT

For more in depth Research & Analysis please visit FxGrow.

Note: This analysis is intended to provide general information and does not constitute the provision of INVESTMENT ADVICE. Investors should, before acting on this information, consider the appropriateness of this information having regard to their personal objectives, financial situation or needs. We recommend investors obtain investment advice specific to their situation before making any financial investment decision.
 
Daily Technical Analysis – 06th July, 2015
By FxGrow Research & Analysis Team

AUDUSD

AUDUSD06July15_zpslqqdcgma.png


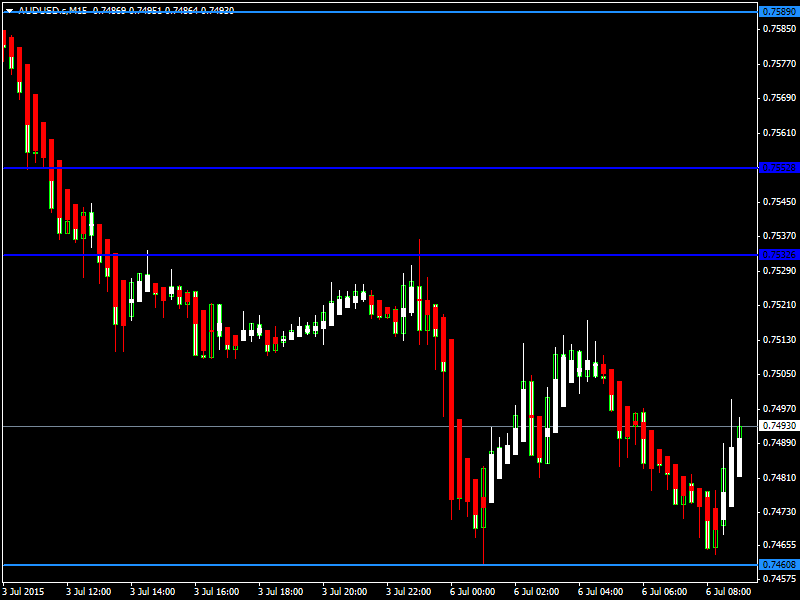
AUDUSD opened the week lower but then consolidated upwards in the early Asian trading session. Now the pair is trading below its 20day moving average of 0.7505 in the European trading session. The near term bias remains Bearish with targets of 0.7400

RSI (14), STOCH (9, 6), MACD (12, 26), ADX (14), ROC, MA100, MA200 indicate a SELL; while Average True Range (14) indicates High Volatility.

Support is at 0.7460 while Resistance is at 0.7598

06th July 2015 – 06:09hrs GMT


USDJPY

USDJPY06July15_zpsvmztgh0j.png


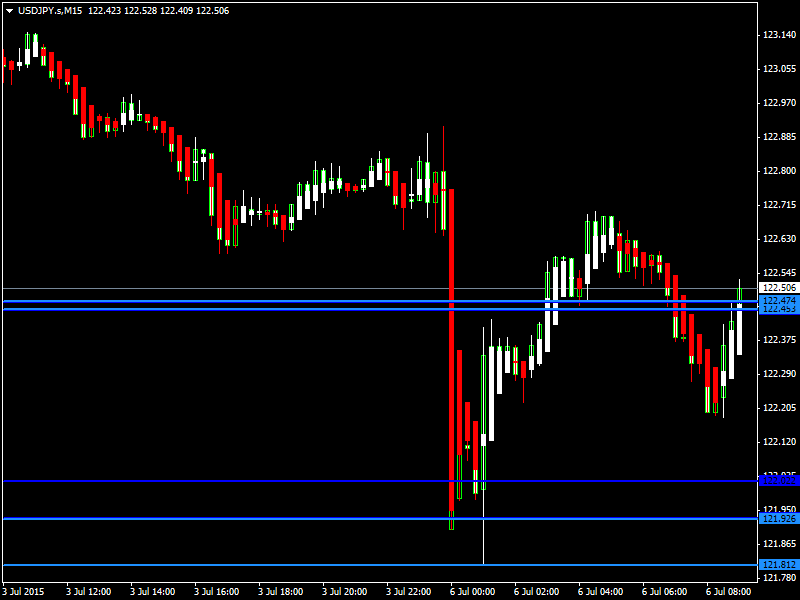
USDJPY opened the week lower touching a low of 121.85 in the early Asian trading session. Now it is trading below its 20day moving average of 122.60 in the European trading session. The near term bias remains Bullish with targets of 123.00

RSI (14) is Neutral; STOCH(9,6), Williams %R, Ultimate Oscillator indicate a BUY; while Average True Range (14) indicates High Volatility.

Support is at 121.81 while Resistance is at 122.84

06th July2015 – 06:13hrs GMT

For more in depth Research & Analysis please visit FxGrow.

Note: This analysis is intended to provide general information and does not constitute the provision of INVESTMENT ADVICE. Investors should, before acting on this information, consider the appropriateness of this information having regard to their personal objectives, financial situation or needs. We recommend investors obtain investment advice specific to their situation before making any financial investment decision.
 
Daily Technical Analysis – 09th July, 2015
By FxGrow Research & Analysis Team

EURUSD

EURUSD09July15_zpsmdnyxqhc.png


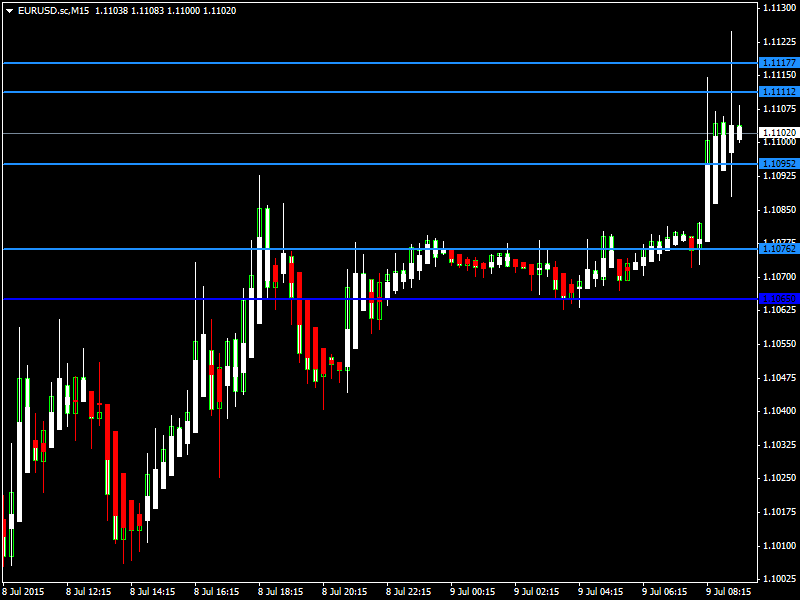
EURUSD had a bullish trend yesterday and touched a high of 1.1091 and remained firm towards the end of the trading session. Now the pair is trading above its 20day moving average of 1.1067 in the European trading session. The near term bias remains Bullish with targets of 1.1160

RSI (14), MACD (12, 26), ADX (14), Ultimate Oscillator, ROC, MA100, MA200 indicate a BUY; STOCHRSI (14) is Overbought; while Average True Range (14) indicates Less Volatility.

Support is at 1.1065 while Resistance is at 1.1131

09th July 2015 – 06:25hrs GMT


GBPUSD

GBPUSD09July15_zpsbgigafvw.png


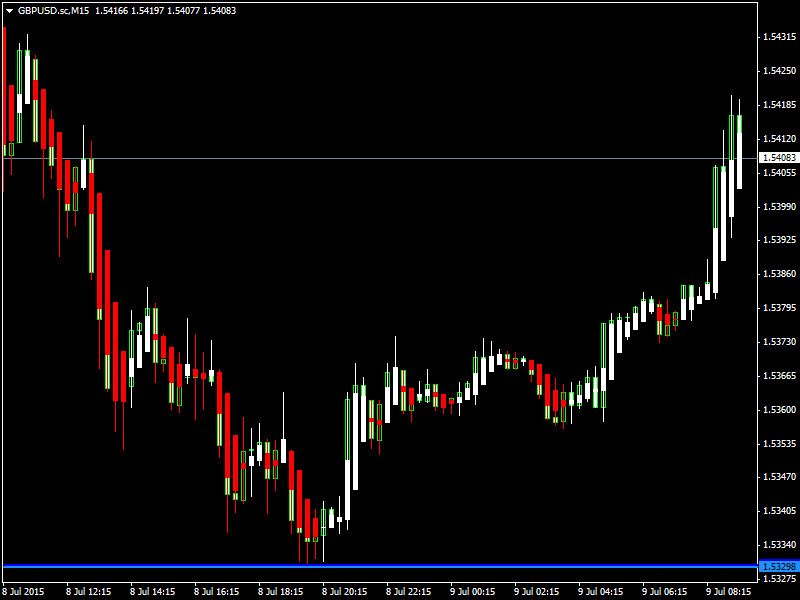
GBPUSD had a bearish momentum yesterday and touched a low of 1.5329 but then it corrected upwards towards the end of the trading session. Now the pair is trading above its 20day moving average of 1.5367 in the European trading session. The near term bias remains Neutral to Bullish with targets of 1.5450

STOCH (9, 6) is Neutral; RSI (14), ADX (14), Ultimate Oscillator, ROC indicate a BUY; STOCHRSI (14) is Overbought; while Average True Range (14) indicates Less Volatility.
Support is at 1.5351 while Resistance is at 1.5450

09th July 2015 – 06:30hrs GMT

For more in depth Research & Analysis please visit FxGrow.

Note: This analysis is intended to provide general information and does not constitute the provision of INVESTMENT ADVICE. Investors should, before acting on this information, consider the appropriateness of this information having regard to their personal objectives, financial situation or needs. We recommend investors obtain investment advice specific to their situation before making any financial investment decision.
 
Daily Technical Analysis – 09th July, 2015
By FxGrow Research & Analysis Team

AUDUSD

AUDUSD09July15_zpspnpjmaal.png


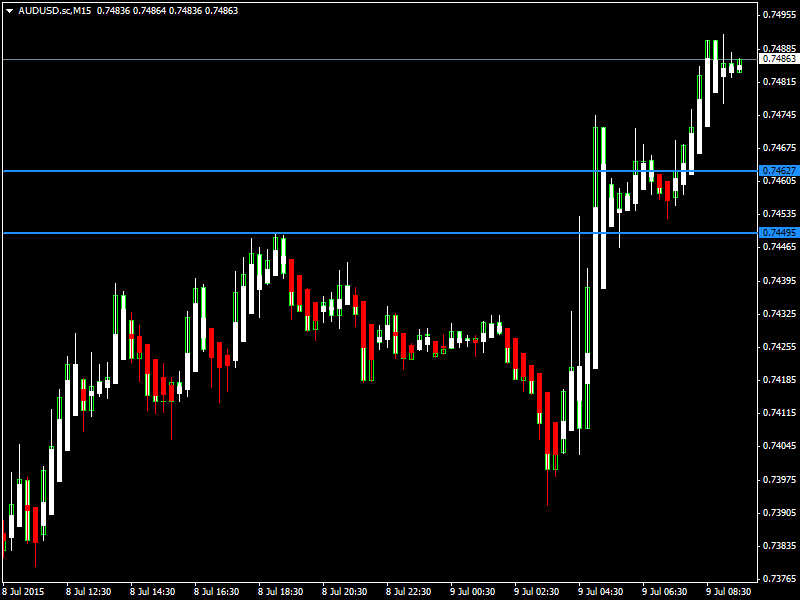
AUDUSD remained indecisive yesterday as it touched a low of 0.7370 and a high of 0.7448 towards the end of the trading session. Now the pair is trading above its 20day moving average of 0.7439 in the European trading session. The near term bias remains Bullish with targets of 0.7500

RSI (14), STOCH (9, 6), MACD (12, 26), ADX (14), ROC, Ultimate Oscillator indicate a BUY; STOCHRSI (14) is Overbought; while Average True Range (14) indicates Less Volatility.

Support is at 0.7371 while Resistance is at 0.7516

09th July 2015 – 06:37hrs GMT


USDJPY

USDJPY09July15_zps7hrquusp.png


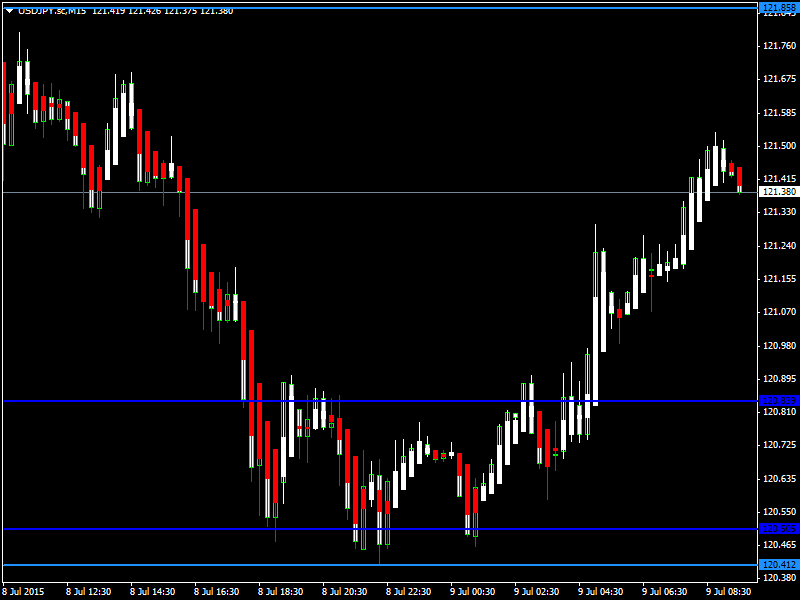
USDJPY was strongly bearish yesterday as it touched a low of 120.40 and remained weak towards the end of the trading session. Now it is trading above its 20day moving average of 120.97 in the European trading session. The near term bias remains Neutral to Bullish with targets of 122.00

RSI (14) is Neutral; STOCH (9, 6), ADX (14), CCI (14), Ultimate Oscillator, ROC indicate a BUY; STOCHRSI (14) is Overbought; while Average True Range (14) indicates Less Volatility.

Support is at 120.41 while Resistance is at 121.94

09th July2015 – 06:42hrs GMT

For more in depth Research & Analysis please visit FxGrow.

Note: This analysis is intended to provide general information and does not constitute the provision of INVESTMENT ADVICE. Investors should, before acting on this information, consider the appropriateness of this information having regard to their personal objectives, financial situation or needs. We recommend investors obtain investment advice specific to their situation before making any financial investment decision.
 
Daily Technical Analysis – 10th July, 2015
By FxGrow Research & Analysis Team

EURUSD

EURUSD10July15_zpsg7cws9qq.png


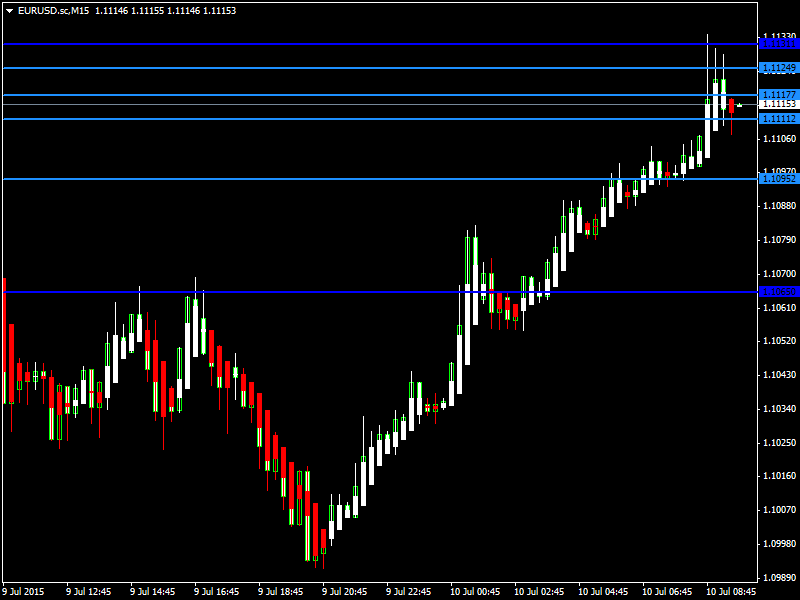
EURUSD was indecisive yesterday as it touched a low of 1.0990 and then moved upwards at the end of the trading session. Now the pair is trading above its 20day moving average of 1.1114 in the European trading session. The near term bias remains Bullish with targets of 1.1160 to 1.1180

RSI (14), STOCH (9, 6), MACD (12, 26), ADX (14), Ultimate Oscillator, ROC, MA100, MA200 indicate a BUY; STOCHRSI (14) is Overbought; while Average True Range (14) indicates Less Volatility.

Support is at 1.1061 while Resistance is at 1.1172

10th July 2015 – 06:52hrs GMT


GBPUSD

GBPUSD10July15_zps1wt4xyl9.png


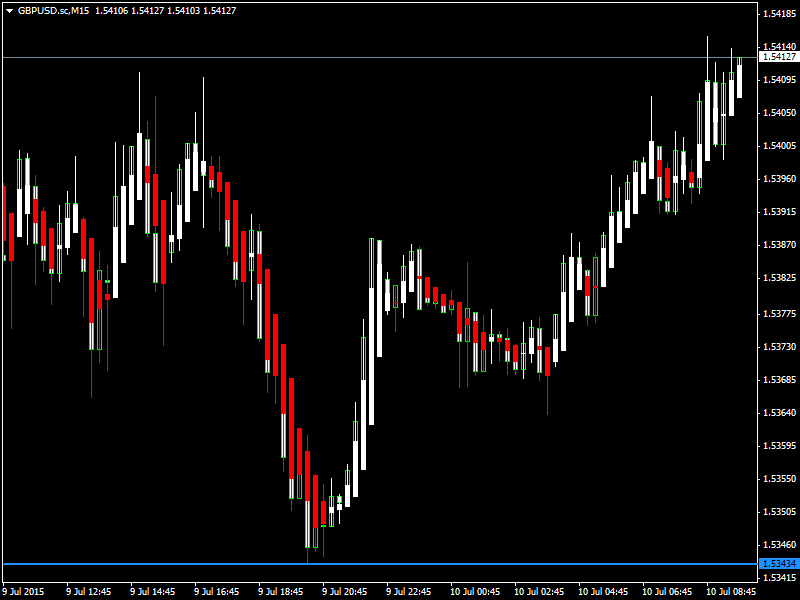
GBPUSD was indecisive yesterday as it touched a high of 1.5418 and a low of 1.5342 towards the end of the trading session. Now the pair is trading above its 20day moving average of 1.5383 in the European trading session. The near term bias remains Bullish with targets of 1.5450

STOCH (9, 6), RSI (14), MACD (12, 26), ADX (14), Ultimate Oscillator, ROC indicate a BUY; STOCHRSI (14) is Overbought; while Average True Range (14) indicates Less Volatility.

Support is at 1.5343 while Resistance is at 1.5420

10th July 2015 – 06:57hrs GMT

For more in depth Research & Analysis please visit FxGrow.

Note: This analysis is intended to provide general information and does not constitute the provision of INVESTMENT ADVICE. Investors should, before acting on this information, consider the appropriateness of this information having regard to their personal objectives, financial situation or needs. We recommend investors obtain investment advice specific to their situation before making any financial investment decision.
 

Live Forex Chart

Currency
Rates
EUR / USD
1.11998
USD / JPY
157.916
GBP / USD
1.32210
USD / CHF
0.83008
USD / CAD
1.42545
EUR / JPY
176.863
AUD / USD
0.69618
Back
Top
Log in Register