BTC USD 85,346.6 Gold USD 4,140.83
Time now: Jun 1, 12:00 AM

Daily Technical Analysis by FxGrow

Daily Technical Analysis – 25th June, 2015
By FxGrow Research & Analysis Team

EURUSD
EURUSD25June15_zps8ii3rnog.png


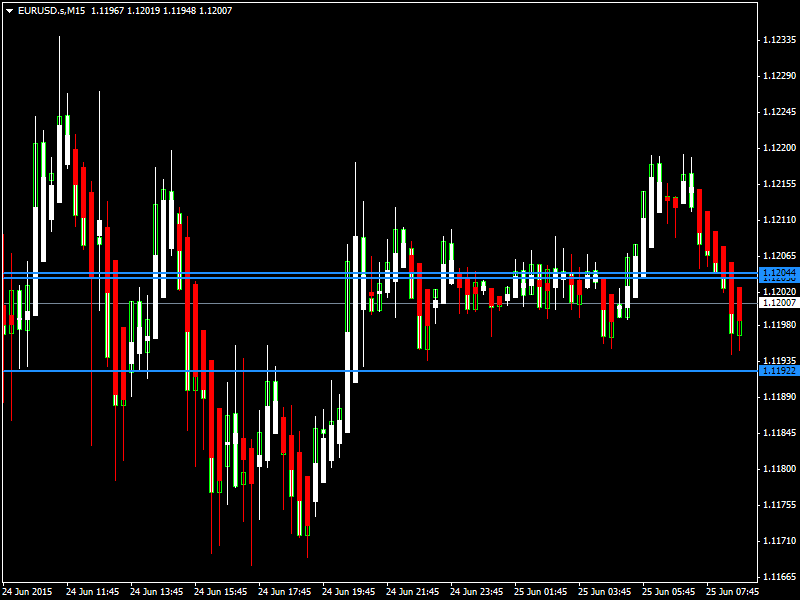
EURUSD was indecisive yesterday and remained neutral towards the end of the trading session. Now the pair is trading just near its 20day moving average of 1.1201 in the European trading session. The near term bias remains Neutral to Bearish with targets of 1.1150

RSI (14), CCI (14) are Neutral; ADX (14), Ultimate Oscillator, MA100, MA200 indicate a SELL; STOCHRSI (14) is Oversold; while Average True Range (14) indicates Less Volatility.

Support is at 1.1188 while Resistance is at 1.1216

25th June 2015 – 06:06hrs GMT


GBPUSD
GBPUSD25June15_zpsdudgmyjm.png


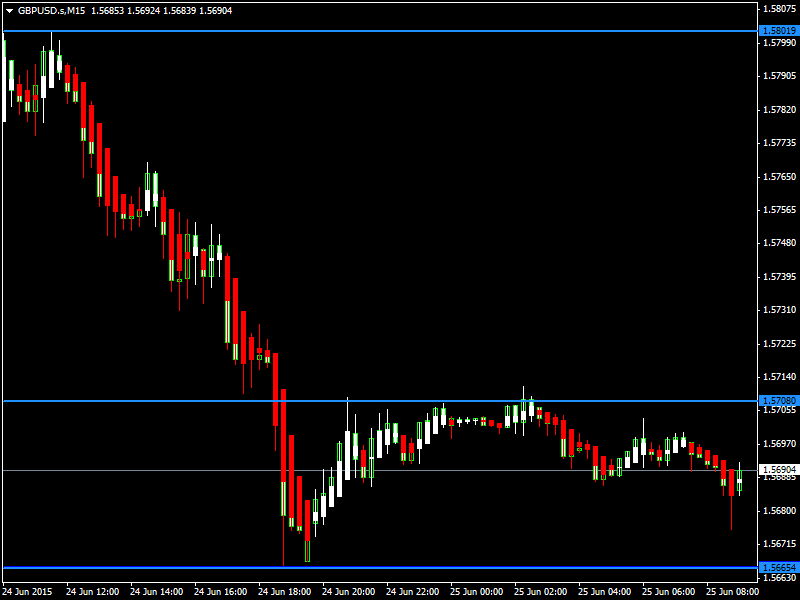
GBPUSD was indecisive yesterday remaining weak towards the end of the trading session. Now the pair is trading below its 20day moving average of 1.5706 in the European trading session. The near term bias remains Neutral to Bearish with targets of 1.5650

RSI (14), STOCH (9, 6), MACD (12, 26), CCI (14), MA100 indicate a SELL; ADX (14) is Neutral; while Average True Range (14) indicates Less Volatility.

Support is at 1.5665 while Resistance is at 1.5801

25th June 2015 – 06:10hrs GMT

For more in depth Research & Analysis please visit FxGrow.

Note: This analysis is intended to provide general information and does not constitute the provision of INVESTMENT ADVICE. Investors should, before acting on this information, consider the appropriateness of this information having regard to their personal objectives, financial situation or needs. We recommend investors obtain investment advice specific to their situation before making any financial investment decision.
 
Daily Technical Analysis – 25th June, 2015
By FxGrow Research & Analysis Team

AUDUSD

AUDUSD25June15_zpsqjgix4fc.png


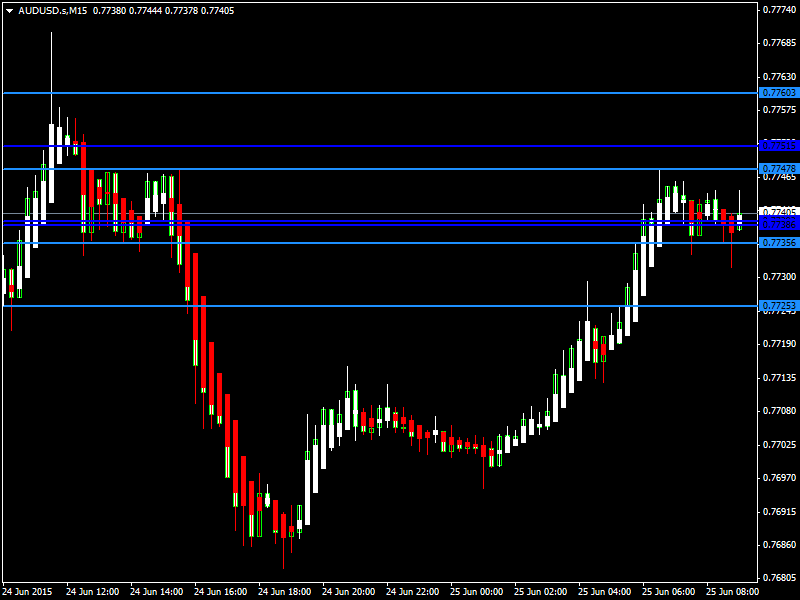
AUDUSD was lower yesterday and touched a low of 0.7683 but then it corrected upwards towards the end of the trading session. Now the pair is trading above its 20day moving average of 0.7717 in the European trading session. The near term bias remains Bullish with targets of 0.7800

RSI (14), STOCH (9, 6), MACD (12, 26), ADX (14), Ultimate Oscillator, ROC indicate a BUY; while Average True Range (14) indicates Less Volatility.

Support is at 0.7718 while Resistance is at 0.7760

25th June 2015 – 06:13hrs GMT


USDJPY

USDJPY25June15_zpsnqrfrh9r.png


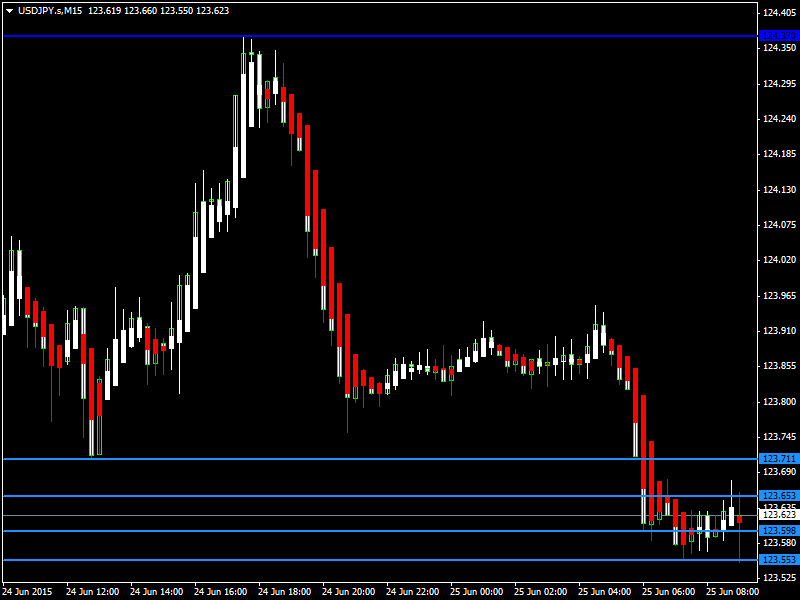
USDJPY was higher yesterday and peaked at 124.35 but then it corrected lower towards the end of the trading session. Now it is trading below its 20day moving average of 123.88 in the European trading session. The near term bias remains Bearish with targets of 123.00

RSI (14), STOCH (9, 6), MACD (12, 26), CCI (14), Ultimate Oscillator, ROC indicate a SELL; STOCHRSI (14) is Oversold; while Average True Range (14) indicates Less Volatility.

Support is at 123.59 while Resistance is at 124.37

25th June 2015 – 06:17hrs GMT

For more in depth Research & Analysis please visit FxGrow.

Note: This analysis is intended to provide general information and does not constitute the provision of INVESTMENT ADVICE. Investors should, before acting on this information, consider the appropriateness of this information having regard to their personal objectives, financial situation or needs. We recommend investors obtain investment advice specific to their situation before making any financial investment decision.
 
Daily Technical Analysis – 26th June, 2015
By FxGrow Research & Analysis Team

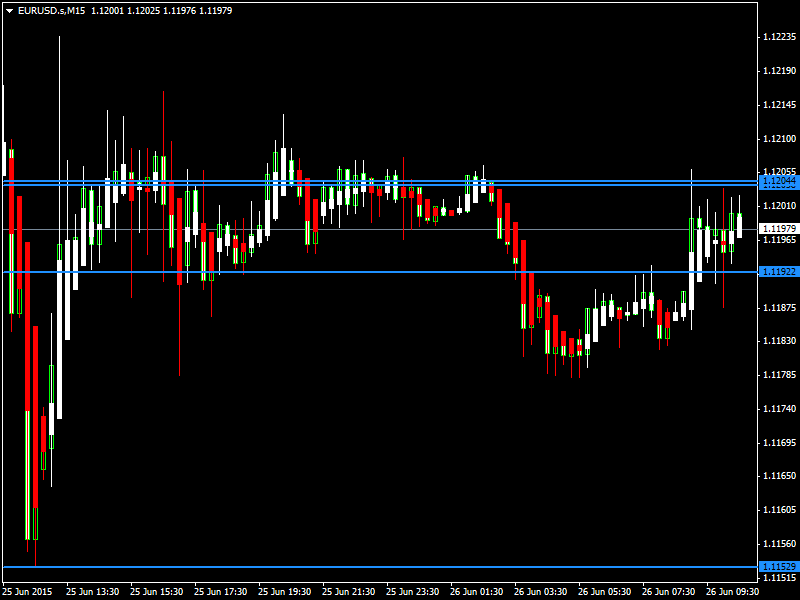
EURUSD

EURUSD26June15_zpstks20x1b.png


EURUSD was indecisive yesterday and remained neutral towards the end of the trading session. Now the pair is trading just near its 20day moving average of 1.1197 in the European trading session. The near term bias remains Neutral to Bullish with targets of 1.1250 to 1.1300

RSI (14), ADX (14), CCI (14) are Neutral; Ultimate Oscillator, Williams %R, MA50 indicate a BUY; STOCHRSI (14) is Overbought; while Average True Range (14) indicates Less Volatility.

Support is at 1.1188 while Resistance is at 1.1230

26th June 2015 – 07:45hrs GMT


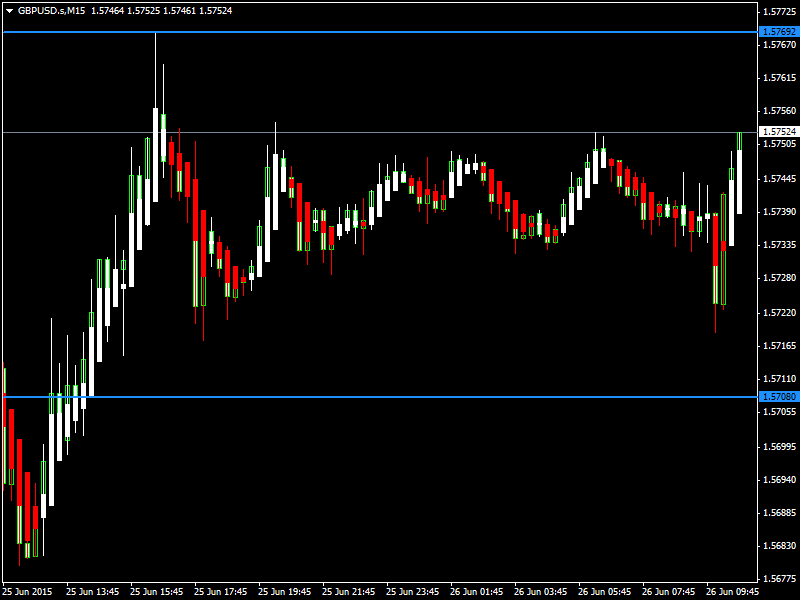
GBPUSD

GBPUSD26June15_zpsv6ebw27u.png


GBPUSD was indecisive yesterday but then corrected upwards towards the end of the trading session. Now the pair is trading just above its 20day moving average of 1.5741 in the European trading session. The near term bias remains Neutral to Bullish with targets of 1.5800

RSI (14), STOCH (9, 6), STOCHRSI (14), MACD (12, 26), Ultimate Oscillator, ROC indicate a BUY; while Average True Range (14) indicates Less Volatility.

Support is at 1.5708 while Resistance is at 1.5769

26th June 2015 – 07:49hrs GMT

For more in depth Research & Analysis please visit FxGrow.

Note: This analysis is intended to provide general information and does not constitute the provision of INVESTMENT ADVICE. Investors should, before acting on this information, consider the appropriateness of this information having regard to their personal objectives, financial situation or needs. We recommend investors obtain investment advice specific to their situation before making any financial investment decision.
 
Daily Technical Analysis – 26th June, 2015
By FxGrow Research & Analysis Team

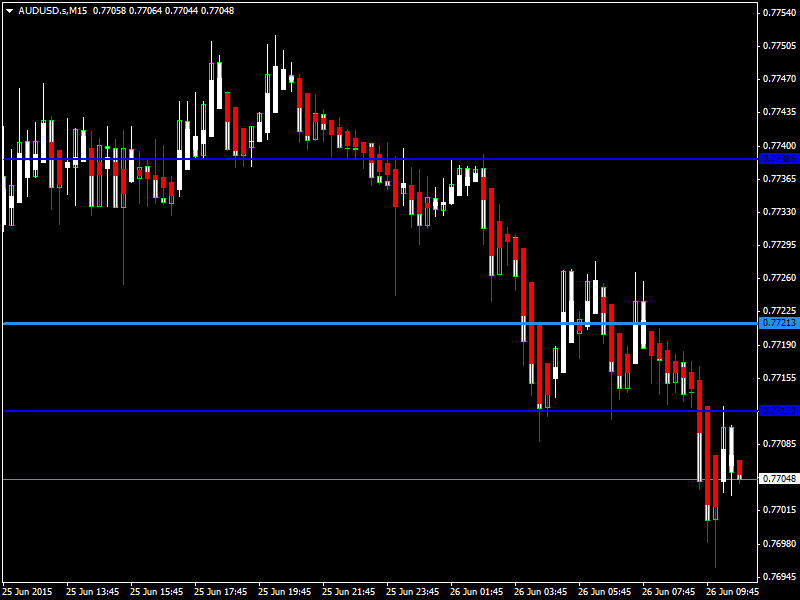
AUDUSD

AUDUSD26June15_zpsazhuuosv.png


AUDUSD was moderately higher yesterday and remained flat towards the end of the trading session. Now the pair is trading below its 20day moving average of 0.7730 in the European trading session. The near term bias remains Bearish with targets of 0.7600

RSI (14), STOCH (9, 6), MACD (12, 26), ADX (14), CCI (14), Ultimate Oscillator, ROC indicate a SELL; while Average True Range (14) indicates High Volatility.

Support is at 0.7694 while Resistance is at 0.7734

26th June 2015 – 07:52hrs GMT


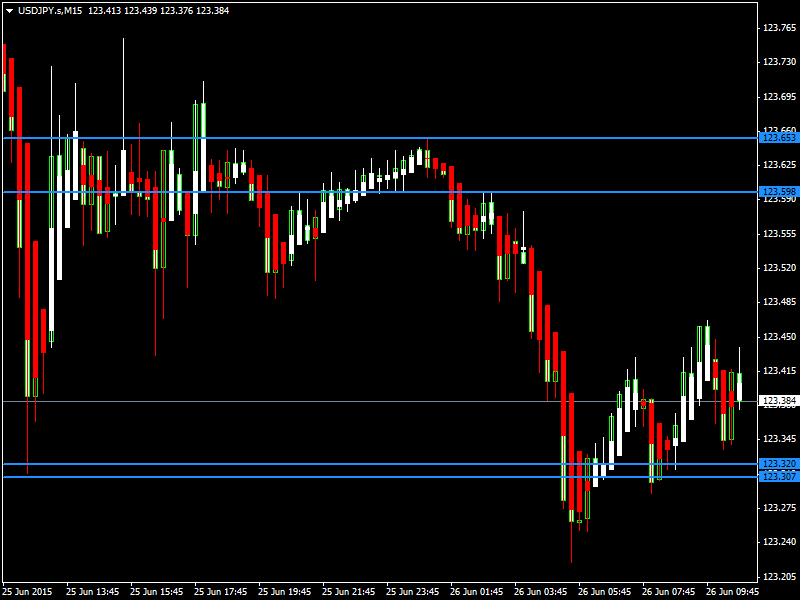
USDJPY

USDJPY26June15_zpsbn7ox5qq.png


USDJPY was moderately weaker yesterday and remained flat towards the end of the trading session. Now it is trading below its 20day moving average of 123.53 in the European trading session. The near term bias remains Bearish with targets of 122.50

RSI (14), STOCH (9, 6), MACD (12, 26), ADX (14), CCI (14), Ultimate Oscillator, ROC indicate a SELL; while Average True Range (14) indicates Less Volatility.

Support is at 123.30 while Resistance is at 123.65

26th June 2015 – 07:55hrs GMT

For more in depth Research & Analysis please visit FxGrow.

Note: This analysis is intended to provide general information and does not constitute the provision of INVESTMENT ADVICE. Investors should, before acting on this information, consider the appropriateness of this information having regard to their personal objectives, financial situation or needs. We recommend investors obtain investment advice specific to their situation before making any financial investment decision.
 
Daily Technical Analysis – 29th June, 2015
By FxGrow Research & Analysis Team

EURUSD

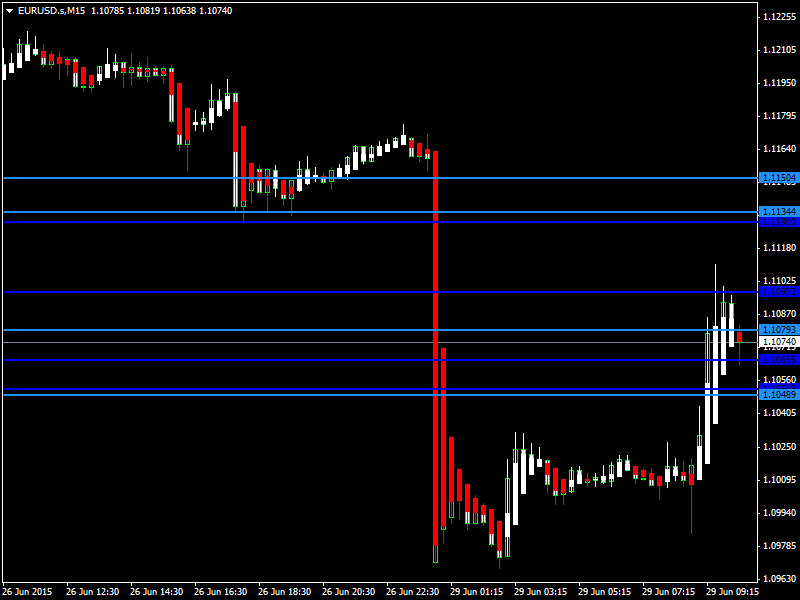
EURUSD29June15_zps8cv78hct.png


EURUSD has opened this week with a gap of 200 pips touching a low of 1.0953 in the Asian trading session. Now the pair is trading just near its 20day moving average of 1.1083 in the European trading session. The near term bias remains Neutral to Bearish with targets of 1.1000

RSI (14), STOCH (9, 6), ADX (14), CCI (14) are Neutral; MACD (12, 26), ROC, MA100, MA200 indicate a SELL; STOCHRSI (14) is Overbought; while Average True Range (14) indicates High Volatility.

Support is at 1.1048 while Resistance is at 1.1150

29th June 2015 – 07:40hrs GMT


GBPUSD

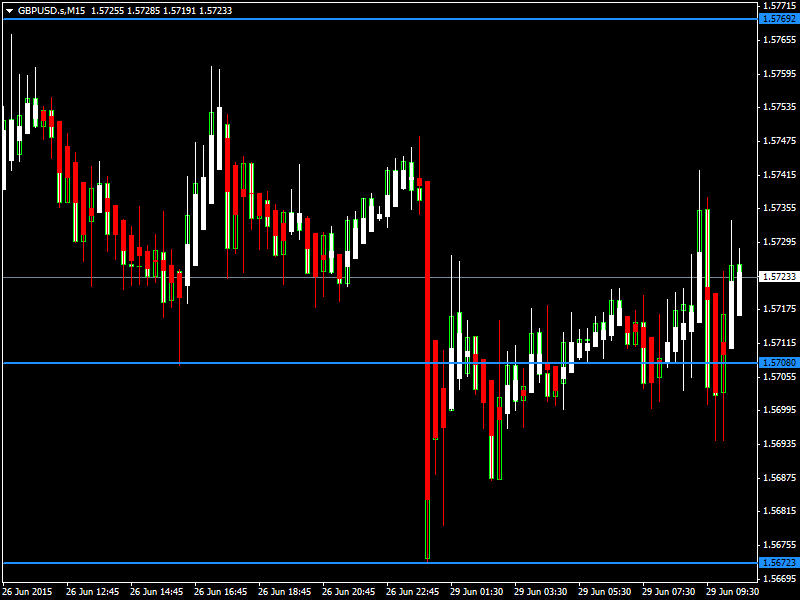
GBPUSD29June15_zpschngibuh.png


GBPUSD opened the week lower touching a low of 1.5661 in the Asian trading session. Now the pair is trading just below its 20day moving average of 1.5721 in the European trading session. The near term bias remains Neutral to Bearish with targets of 1.5650

RSI (14), ADX (14), CCI (14) are Neutral; MACD (12, 26), Ultimate Oscillator, ROC, MA100, MA200 indicate a SELL; while Average True Range (14) indicates High Volatility.

Support is at 1.5672 while Resistance is at 1.5769

29th June 2015 – 07:45hrs GMT

For more in depth Research & Analysis please visit FxGrow.

Note: This analysis is intended to provide general information and does not constitute the provision of INVESTMENT ADVICE. Investors should, before acting on this information, consider the appropriateness of this information having regard to their personal objectives, financial situation or needs. We recommend investors obtain investment advice specific to their situation before making any financial investment decision.
 
Daily Technical Analysis – 29th June, 2015
By FxGrow Research & Analysis Team

AUDUSD

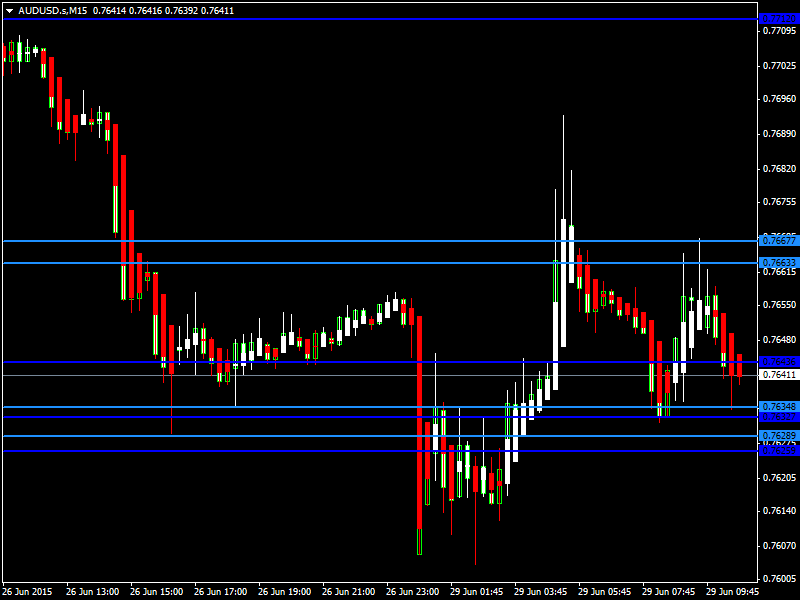
AUDUSD29June15_zpsxxwyhcre.png


AUDUSD opened the week lower touching a low of 0.7585 in the Asian trading session. Now the pair is trading just below its 20day moving average of 0.7645 in the European trading session. The near term bias remains Neutral to Bearish with targets of 0.7600

RSI (14), MACD (12, 26), Ultimate Oscillator, ROC, MA100, MA200 indicate a SELL; CCI (14) is Neutral; while Average True Range (14) indicates High Volatility.

Support is at 0.7625 while Resistance is at 0.7712

29th June 2015 – 07:49hrs GMT


USDJPY

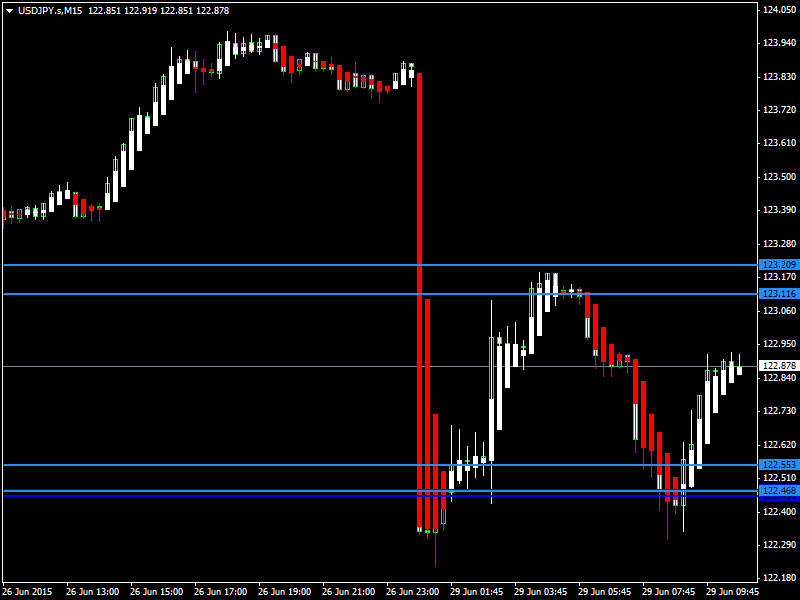
USDJPY29June15_zpsufbr9pkw.png


USDJPY has opened the week lower touching a low of 122.09 in the Asian trading session. Now it is trading below its 20day moving average of 123.28 in the European trading session. The near term bias remains Neutral to Bearish with targets of 122.00

STOCH (9, 6), STOCHRSI (14), CCI (14) are Neutral; RSI (14), MACD (12, 26), ADX (14), ROC, MA100, MA200 indicate a SELL; while Average True Range (14) indicates High Volatility.

Support is at 122.46 while Resistance is at 123.20

29th June 2015 – 07:54hrs GMT

For more in depth Research & Analysis please visit FxGrow.

Note: This analysis is intended to provide general information and does not constitute the provision of INVESTMENT ADVICE. Investors should, before acting on this information, consider the appropriateness of this information having regard to their personal objectives, financial situation or needs. We recommend investors obtain investment advice specific to their situation before making any financial investment decision.
 
Daily Technical Analysis – 30th June, 2015
By FxGrow Research & Analysis Team

EURUSD

EURUSD30June15_zps80hzbg7z.png


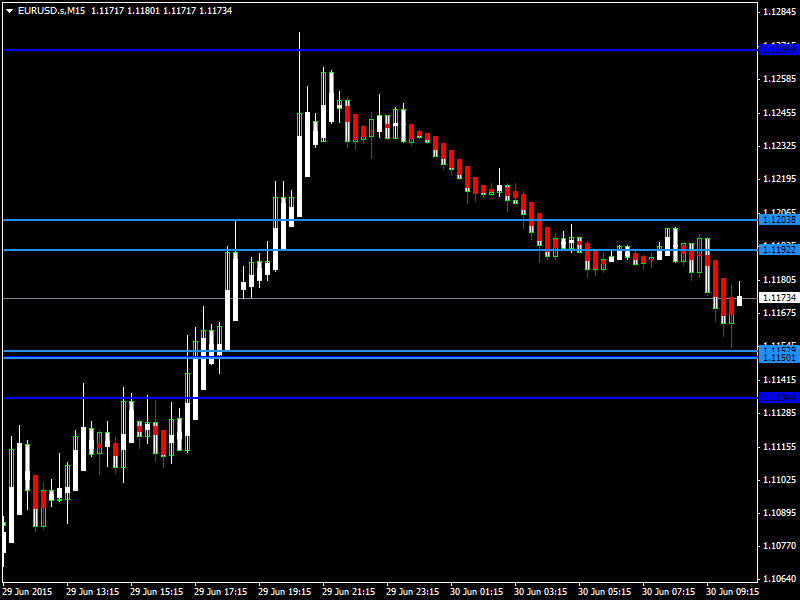
EURUSD was bullish yesterday and touched a high of 1.1277 but then it corrected lower towards the end of the trading session. Now the pair is trading below its 20day moving average of 1.1196 in the European trading session. The near term bias remains Neutral to Bearish with targets of 1.1100

RSI (14) is Neutral; STOCH (9, 6), ADX (14), CCI (14), Ultimate Oscillator, ROC indicate a SELL; STOCHRSI (14) is Oversold; while Average True Range (14) indicates Less Volatility.

Support is at 1.1134 while Resistance is at 1.1288

30th June 2015 – 07:23hrs GMT


GBPUSD

GBPUSD30June15_zpsjfiewrre.png


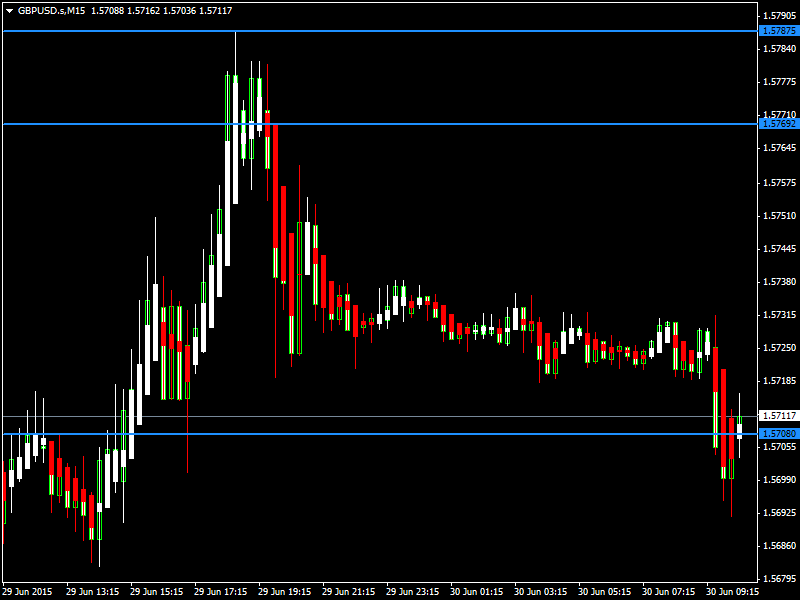
GBPUSD was indecisive yesterday as it touched a low of 1.5661 and then moved upwards to touch a high of 1.5778 but corrected lower towards the end of the trading session. Now the pair is trading below its 20day moving average of 1.5731 in the European trading session. The near term bias remains Bearish with targets of 1.5650

RSI (14), STOCHRSI (14), MACD (12, 26), ADX (14), Ultimate Oscillator, ROC, MA100, MA200 indicate a SELL; while Average True Range (14) indicates Less Volatility.

Support is at 1.5708 while Resistance is at 1.5787

30th June 2015 – 07:28hrs GMT

For more in depth Research & Analysis please visit FxGrow.

Note: This analysis is intended to provide general information and does not constitute the provision of INVESTMENT ADVICE. Investors should, before acting on this information, consider the appropriateness of this information having regard to their personal objectives, financial situation or needs. We recommend investors obtain investment advice specific to their situation before making any financial investment decision.
 
Daily Technical Analysis – 30th June, 2015
By FxGrow Research & Analysis Team

AUDUSD

AUDUSD30June15_zps2hr9yjbu.png


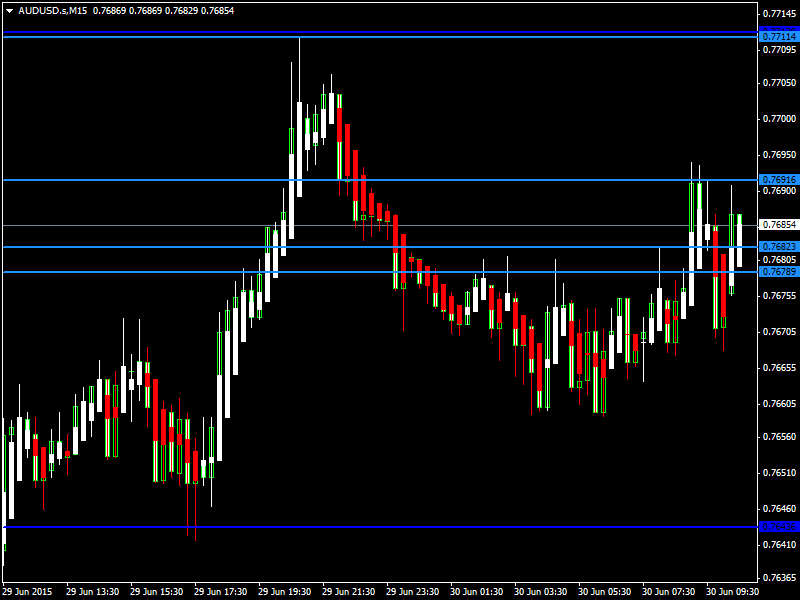
AUDUSD was lower yesterday but then it corrected upwards to reach a high of 0.7710 towards the end of the trading session. Now the pair is trading just above its 20day moving average of 0.7677 in the European trading session. The near term bias remains Neutral.

STOCHRSI (14), ADX (14), CCI (14) are Neutral; while Average True Range (14) indicates Less Volatility.

Support is at 0.7632 while Resistance is at 0.7711

30th June 2015 – 07:43hrs GMT


USDJPY

USDJPY30June15_zpss7lkibth.png


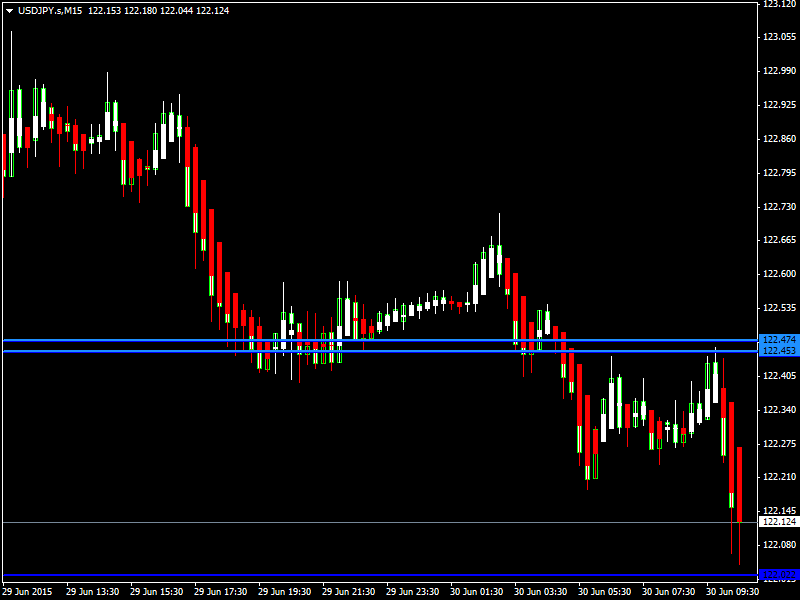
USDJPY was bearish yesterday and remained weak towards the end of the trading session. Now it is trading below its 20day moving average of 123.48 in the European trading session. The near term bias remains Bearish with targets of 121.50

RSI (14), STOCH (9, 6), MACD (12, 26), ADX (14), CCI (14), Ultimate Oscillator, ROC, MA100, MA200 indicate a SELL; while Average True Range (14) indicates Less Volatility.

Support is at 122.02 while Resistance is at 122.47

30th June 2015 – 07:49hrs GMT

For more in depth Research & Analysis please visit FxGrow.

Note: This analysis is intended to provide general information and does not constitute the provision of INVESTMENT ADVICE. Investors should, before acting on this information, consider the appropriateness of this information having regard to their personal objectives, financial situation or needs. We recommend investors obtain investment advice specific to their situation before making any financial investment decision.
 
Daily Technical Analysis – 01st July, 2015
By FxGrow Research & Analysis Team

EURUSD

2ajumhv.jpg


EURUSD had a bullish momentum yesterday and remained firm towards the end of the trading session. Now the pair is trading below its 20day moving average of 1.1146 in the European trading session. The near term bias remains Neutral to Bearish with targets of 1.1050

RSI (14), MACD (12, 26), ADX (14), CCI (14), Ultimate Oscillator, ROC, indicate a SELL; STOCHRSI (14) is Oversold; while Average True Range (14) indicates Less Volatility.

Support is at 1.1115 while Resistance is at 1.1155

01st July 2015 – 07:11hrs GMT

GBPUSD

2lsh7xi.jpg


GBPUSD moved upwards touching a high of 1.5738 but then it came down and remained indecisive towards the end of the trading session. Now the pair is trading below its 20day moving average of 1.5713 in the European trading session. The near term bias remains Neutral to Bearish.

RSI (14), STOCH (9, 6), ADX (14), CCI (14) are Neutral; MACD (12, 26), Ultimate Oscillator, ROC indicate a SELL; while Average True Range (14) indicates Less Volatility.

Support is at 1.5673 while Resistance is at 1.5768

01st July 2015 – 07:18hrs GMT

For more in depth Research & Analysis please visit FxGrow.

Note: This analysis is intended to provide general information and does not constitute the provision of INVESTMENT ADVICE. Investors should, before acting on this information, consider the appropriateness of this information having regard to their personal objectives, financial situation or needs. We recommend investors obtain investment advice specific to their situation before making any financial investment decision.
 
Daily Technical Analysis – 01st July, 2015
By FxGrow Research & Analysis Team

AUDUSD

2u965gp.jpg


AUDUSD was moderately higher yesterday and remained firm towards the end of the trading session. Now the pair is trading above its 20day moving average of 0.7710 in the European trading session. The near term bias remains Neutral to Bullish with targets of 0.7800

RSI (14), STOCH (9, 6), MACD (12, 26), Ultimate Oscillator, ROC indicate a BUY; STOCHRSI (14) is Neutral; while Average True Range (14) indicates Less Volatility.

Support is at 0.7681 while Resistance is at 0.7738

01st July 2015 – 07:44hrs GMT


USDJPY

21dn41x.png


USDJPY remained indecisive yesterday as it came below 122.00 levels but corrected upwards towards the end of the trading session. Now it is trading above its 20day moving average of 122.43 in the European trading session. The near term bias remains Bullish with targets of 123.50

RSI (14), STOCH (9, 6), MACD (12, 26), ADX (14), CCI (14), Ultimate Oscillator, ROC indicate a BUY; while Average True Range (14) indicates Less Volatility.

Support is at 122.60 while Resistance is at 122.89

01st July 2015 – 07:51hrs GMT

For more in depth Research & Analysis please visit FxGrow.

Note: This analysis is intended to provide general information and does not constitute the provision of INVESTMENT ADVICE. Investors should, before acting on this information, consider the appropriateness of this information having regard to their personal objectives, financial situation or needs. We recommend investors obtain investment advice specific to their situation before making any financial investment decision.
 

Live Forex Chart

Currency
Rates
EUR / USD
1.12582
USD / JPY
157.735
GBP / USD
1.32435
USD / CHF
0.83040
USD / CAD
1.42437
EUR / JPY
177.581
AUD / USD
0.69569
Back
Top
Log in Register