BTC USD 82,625.9 Gold USD 4,117.78
Time now: Jun 1, 12:00 AM

Daily Technical Analysis by FxGrow

Daily Technical Analysis – 27th July, 2015
By FxGrow Research & Analysis Team

AUDUSD
AUDUSD27July15_zpsd8rw0ayx.png


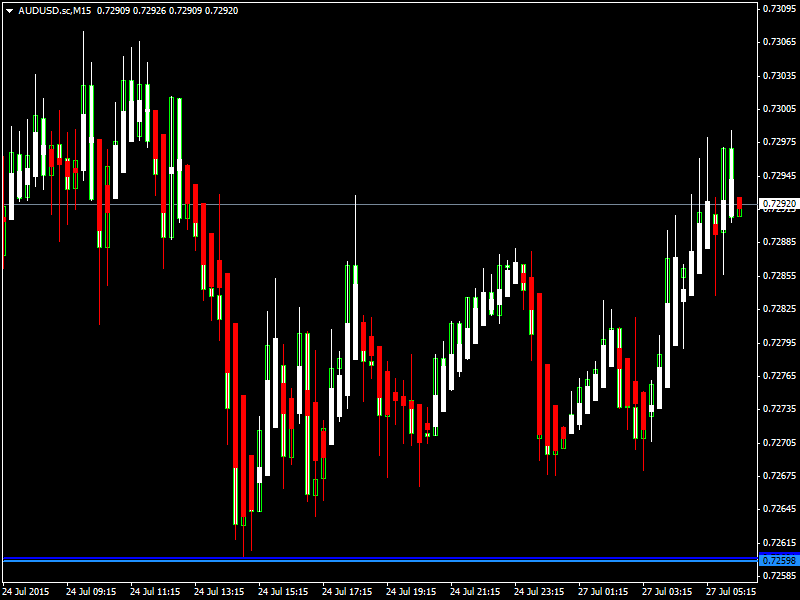
AUDUSD was bearish last week and opened the week higher in the early Asian trading session. Now the pair is trading above its 20day moving average of 0.7281 in the Asian trading session. The near term bias remains Neutral to Bullish with targets of 0.7350

RSI (14), STOCH (9, 6) are Neutral; STOCHRSI (14), ADX (14), CCI (14), Ultimate Oscillator, ROC indicate a BUY; while Average True Range (14) indicates Less Volatility.

Support is at 0.7259 while Resistance is at 0.7341

27th July 2015 – 03:29hrs GMT


USDJPY
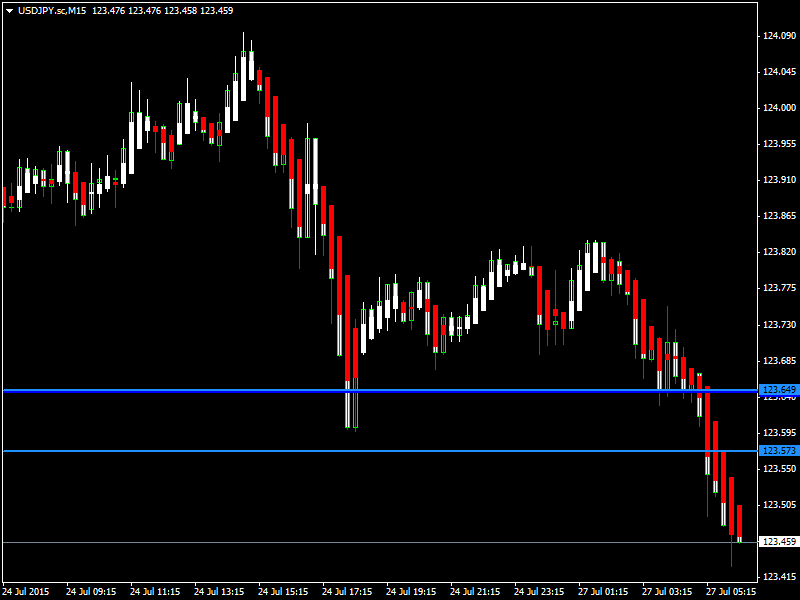
USDJPY27July15_zpsag9zlwc6.png


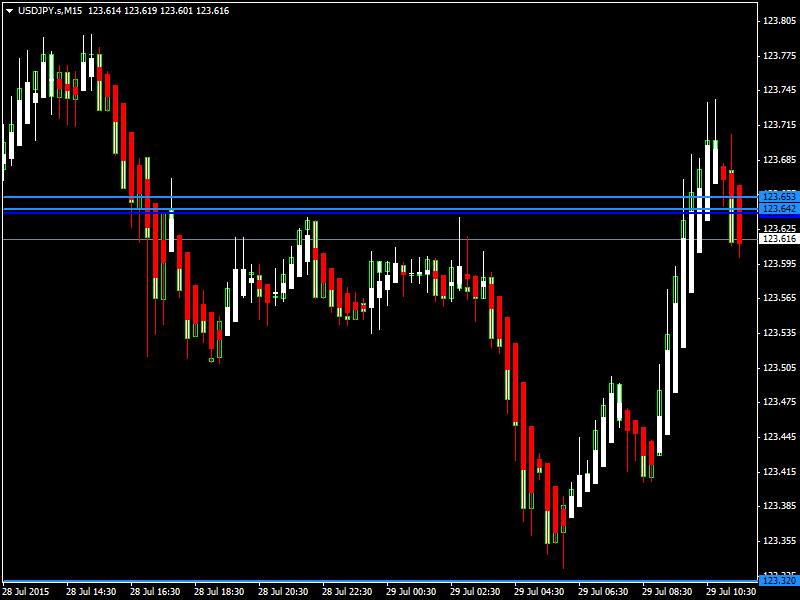
USDJPY was bullish last week and opened the week lower in the early Asian trading session. Now the pair is trading below its 20day moving average of 123.79 in the Asian trading session. The near term bias remains Bearish with targets of 123.00

RSI (14), MACD (12, 26), ADX (14), ROC, MA100, MA200 indicate a SELL; STOCHRSI (14) is Oversold; while Average True Range (14) indicates Less Volatility.

Support is at 123.42 while Resistance is at 123.81

27th July2015 – 03:37hrs GMT

For more in depth Research & Analysis please visit FxGrow.

Note: This analysis is intended to provide general information and does not constitute the provision of INVESTMENT ADVICE. Investors should, before acting on this information, consider the appropriateness of this information having regard to their personal objectives, financial situation or needs. We recommend investors obtain investment advice specific to their situation before making any financial investment decision.
 
Daily Technical Analysis – 28th July, 2015
By FxGrow Research & Analysis Team

EURUSD

vg4yrq.png


EURUSD was bullish yesterday as it touched a high of 1.1127 and remained firm towards the end of the trading session. Now the pair is trading just above its 20day moving average of 1.10827 in the Asian trading session. The near term bias remains Neutral to Bullish with targets of 1.1150

CCI (14) is Neutral; RSI (14), MACD (12, 26), ROC, MA100, MA200 indicate a BUY; STOCHRSI (14) is Oversold; while Average True Range (14) indicates Less Volatility.

Support is at 1.1031 while Resistance is at 1.1130

28th July 2015 – 00:32hrs GMT


GBPUSD

15qq6f9.png


GBPUSD was bearish yesterday as it touched a low of 1.5552 and remained weak towards the end of the trading session. Now the pair is trading above its 20day moving average of 1.5546 in the Asian trading session. The near term bias remains Neutral to Bullish with targets of 1.5600

CCI (14) is Neutral; RSI (14), MACD (12, 26), ADX (14), Ultimate Oscillator, ROC indicate a BUY; while Average True Range (14) indicates Less Volatility.

Support is at 1.5497 while Resistance is at 1.5587

28th July 2015 – 00:36hrs GMT

For more in depth Research & Analysis please visit FxGrow.

Note: This analysis is intended to provide general information and does not constitute the provision of INVESTMENT ADVICE. Investors should, before acting on this information, consider the appropriateness of this information having regard to their personal objectives, financial situation or needs. We recommend investors obtain investment advice specific to their situation before making any financial investment decision.
 
Daily Technical Analysis – 28th July, 2015
By FxGrow Research & Analysis Team

AUDUSD

715ldu.png


AUDUSD was bearish yesterday as it touched a low of 0.7263 and remained weak towards the end of the trading session. Now the pair is trading below its 20day moving average of 0.7286 in the Asian trading session. The near term bias remains Neutral to Bearish with targets of 0.7200

RSI (14), STOCHRSI (14) are Neutral; MACD (12, 26), ADX (14), Ultimate Oscillator, ROC, MA100, MA200 indicate a SELL; STOCH (9, 6) is Neutral; while Average True Range (14) indicates Less Volatility.

Support is at 0.7263 while Resistance is at 0.7287

28th July 2015 – 00:42hrs GMT


USDJPY

1slg8p.png


USDJPY remained indecisive yesterday as it touched a low of 123.09 and a high of 123.28 towards the end of the trading session. Now it is trading below its 20day moving average of 123.27 in the Asian trading session. The near term bias remains Neutral to Bearish.

CCI (14) is Neutral; RSI (14), MACD (12, 26), ADX (14), Ultimate Oscillator, ROC, MA100, MA200 indicate a SELL; while Average True Range (14) indicates Less Volatility.
Support is at 122.99 while Resistance is at 123.70

28th July 2015 – 00:46hrs GMT

For more in depth Research & Analysis please visit FxGrow.

Note: This analysis is intended to provide general information and does not constitute the provision of INVESTMENT ADVICE. Investors should, before acting on this information, consider the appropriateness of this information having regard to their personal objectives, financial situation or needs. We recommend investors obtain investment advice specific to their situation before making any financial investment decision.
 
Daily Technical Analysis – 29th July, 2015
By FxGrow Research & Analysis Team

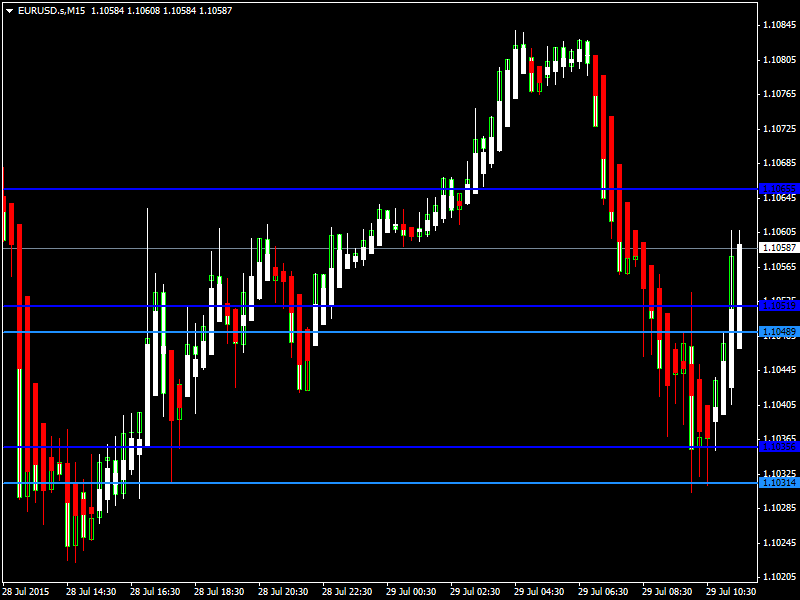
EURUSD

EURUSD29July15_zpsucnsilrb.png


EURUSD was indecisive yesterday as it touched a low of 1.1023 and then recovered upwards at the end of the trading session. Now the pair is trading just above its 20day moving average of 1.1058 in the European trading session. The near term bias remains Neutral.

RSI (14), STOCH (9, 6), STOCHRSI (14), ADX (14) are Neural; while Average True Range (14) indicates Less Volatility.

Support is at 1.1031 while Resistance is at 1.1097

29th July 2015 – 08:39hrs GMT


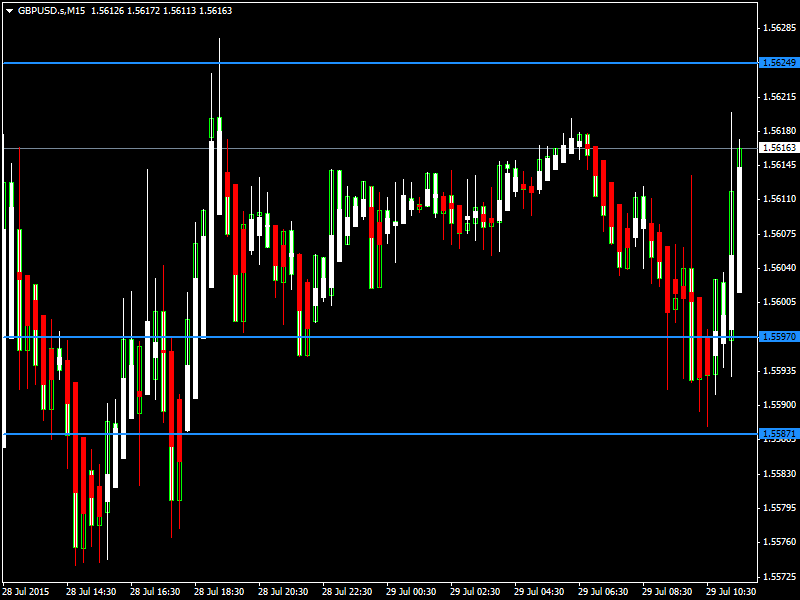
GBPUSD

GBPUSD29July15_zpslpuv5i2l.png


GBPUSD was bullish yesterday as it touched a high of 1.5625 and remained firm towards the end of the trading session. Now the pair is trading above its 20day moving average of 1.5607 in the European trading session. The near term bias remains Neutral to Bullish with targets of 1.5700

ADX (14) is Neutral; RSI (14), STOCH (9, 6), MACD (12, 26), Ultimate Oscillator, ROC, MA100, MA200 indicate a BUY; STOCHRSI (14) is Overbought; while Average True Range (14) indicates Less Volatility.

Support is at 1.5551 while Resistance is at 1.5627

29th July 2015 – 08:46hrs GMT


For more in depth Research & Analysis please visit FxGrow.

Note: This analysis is intended to provide general information and does not constitute the provision of INVESTMENT ADVICE. Investors should, before acting on this information, consider the appropriateness of this information having regard to their personal objectives, financial situation or needs. We recommend investors obtain investment advice specific to their situation before making any financial investment decision.
 
Daily Technical Analysis – 29th July, 2015
By FxGrow Research & Analysis Team

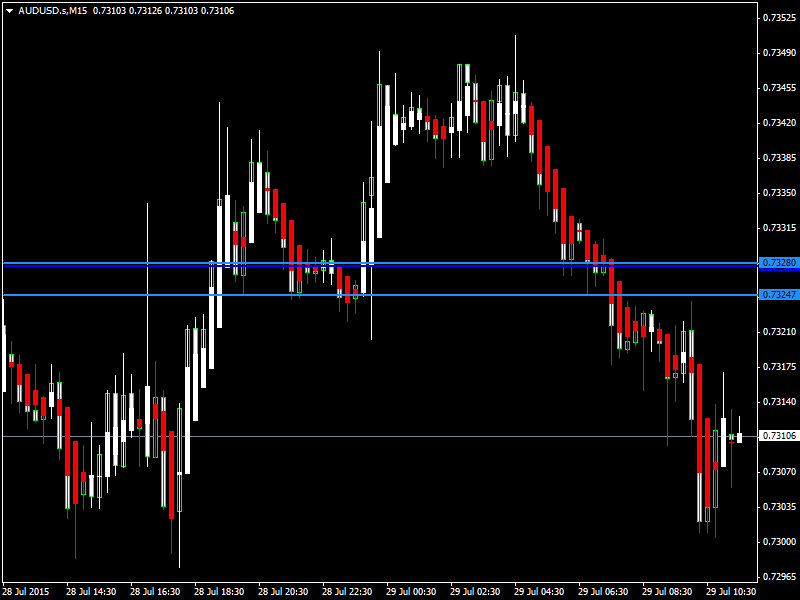
AUDUSD

AUDUSD29July15_zpszkcmhjfx.png


AUDUSD was bullish yesterday as it touched a high of 0.7338 and remained firm towards the end of the trading session. Now the pair is trading below its 20day moving average of 0.7328 in the European trading session. The near term bias remains Bearish with targets of 0.7250

RSI (14), STOCH (9, 6), ADX (14), CCI (14), Ultimate Oscillator, ROC, MA100, MA200 indicate a SELL; STOCHRSI (14) is Oversold; while Average True Range (14) indicates Less Volatility.

Support is at 0.7256 while Resistance is at 0.7328

29th July 2015 – 08:52hrs GMT

USDJPY

USDJPY29July15_zpssapz8ajr.png


USDJPY was bullish yesterday as it touched a high of 123.77 and remained firm towards the end of the trading session. Now the pair is trading above its 20day moving average of 123.55 in the European trading session. The near term bias remains Neutral to Bullish with targets of 124.10

STOCH (9, 6) is Neutral; RSI (14), MACD (12, 26), ADX (14), CCI (14), Ultimate Oscillator, ROC, MA100 indicate a BUY; STOCHRSI (14) is Overbought; while Average True Range (14) indicates High Volatility.

Support is at 123.33 while Resistance is at 123.67

29th July2015 – 09:09hrs GMT

For more in depth Research & Analysis please visit FxGrow.

Note: This analysis is intended to provide general information and does not constitute the provision of INVESTMENT ADVICE. Investors should, before acting on this information, consider the appropriateness of this information having regard to their personal objectives, financial situation or needs. We recommend investors obtain investment advice specific to their situation before making any financial investment decision.
 
Daily Technical Analysis – 30th July, 2015
By FxGrow Research & Analysis Team

EURUSD

EURUSD30July15_zpsq07ottvd.png


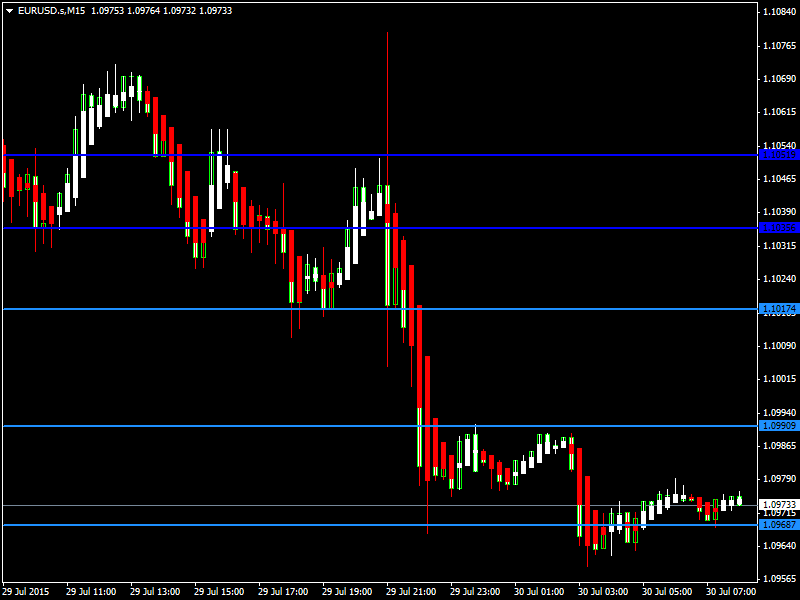
EURUSD was bearish yesterday as it touched a low of 1.0965 and remained weak towards the end of the trading session. Now the pair is trading below its 20day moving average of 1.1008 in the European trading session. The near term bias remains Bearish with targets of 1.0900

RSI (14), MACD (12, 26), ADX (14), CCI (14), Ultimate Oscillator, ROC, MA100 indicate a SELL; STOCH (9, 6), STOCHRSI (14) are Oversold; while Average True Range (14) indicates Less Volatility.

Support is at 1.0968 while Resistance is at 1.1051

30th July 2015 – 05:12hrs GMT


GBPUSD

GBPUSD30July15_zpsz7tje3oo.png


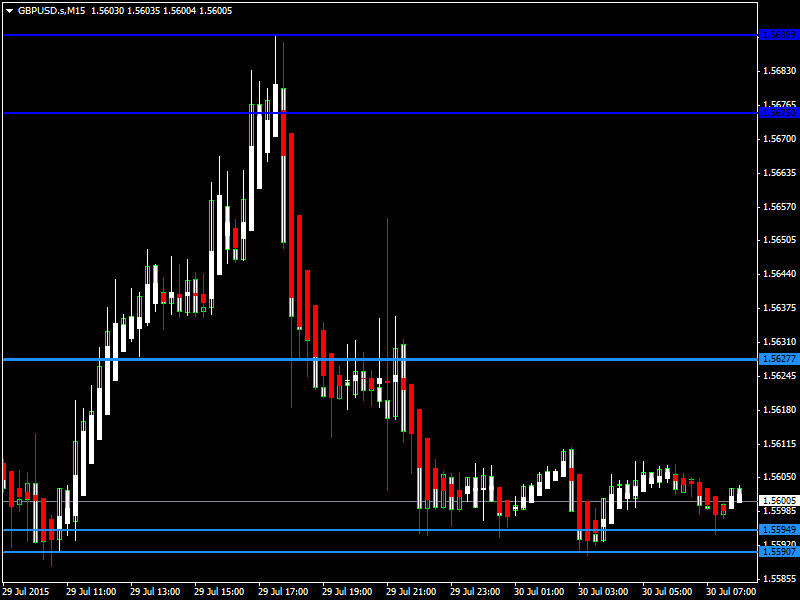
GBPUSD was indecisive yesterday as it touched a high of 1.5687 but soon it came down to touch a low of 1.5592 towards the end of the trading session. Now the pair is trading below its 20day moving average of 1.5619 in the European trading session. The near term bias remains Neutral to Bearish with targets of 1.5550

RSI (14), Ultimate Oscillator are Neutral; STOCH (9, 6), STOCHRSI (14), MACD (12, 26), ADX (14), CCI (14), ROC indicate a SELL; while Average True Range (14) indicates Less Volatility.

Support is at 1.5590 while Resistance is at 1.5689

30th July 2015 – 05:41hrs GMT

For more in depth Research & Analysis please visit FxGrow.

Note: This analysis is intended to provide general information and does not constitute the provision of INVESTMENT ADVICE. Investors should, before acting on this information, consider the appropriateness of this information having regard to their personal objectives, financial situation or needs. We recommend investors obtain investment advice specific to their situation before making any financial investment decision.
 
Daily Technical Analysis – 30th July, 2015
By FxGrow Research & Analysis Team

AUDUSD

AUDUSD30July15_zpsxs2y9ujf.png


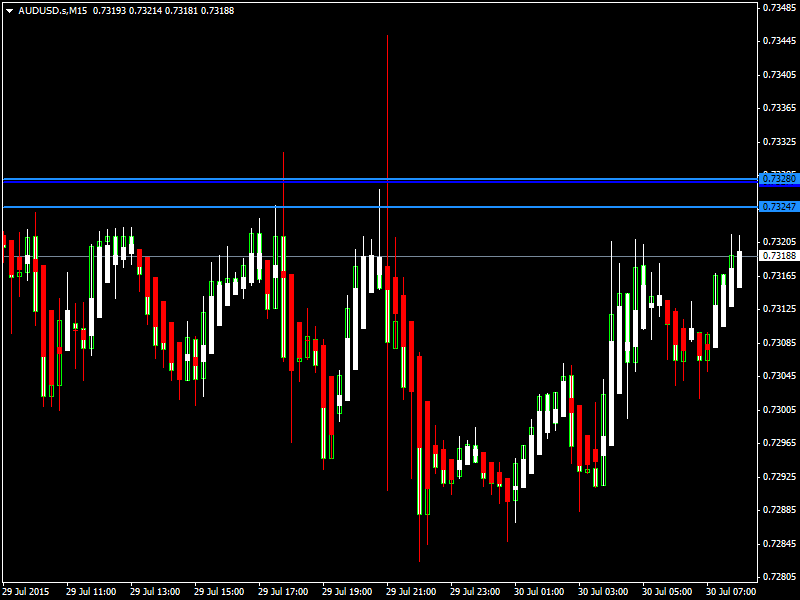
AUDUSD was indecisive yesterday as it touched a high of 0.7349 and a low of 0.7282 remaining weak towards the end of the trading session. Now the pair is trading just above its 20day moving average of 0.7307 in the European trading session. The near term bias remains Neutral to Bullish with targets of 0.7370

RSI (14) is Neutral; STOCH (9, 6), ADX (14), CCI (14), Ultimate Oscillator, ROC, MA100, indicate a BUY; STOCHRSI (14) is Overbought; while Average True Range (14) indicates Less Volatility.

Support is at 0.7292 while Resistance is at 0.7340

30th July 2015 – 05:46hrs GMT


USDJPY

USDJPY30July15_zpswfnkuant.png


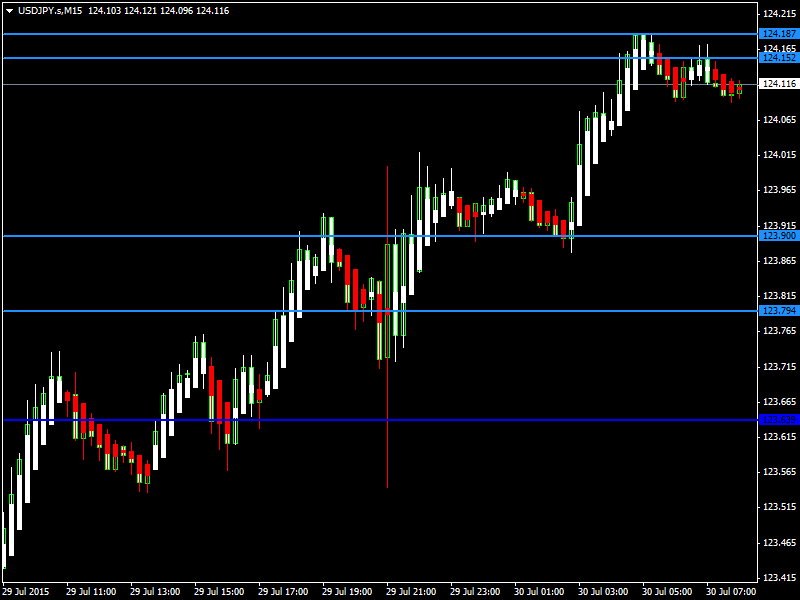
USDJPY was bullish yesterday as it touched a high of 123.98 and remained firm towards the end of the trading session. Now the pair is trading above its 20day moving average of 123.91 in the European trading session. The near term bias remains Neutral to Bullish with targets of 124.50

ADX (14) is Neutral; RSI (14), MACD (12, 26), CCI (14), Ultimate Oscillator, ROC, MA100, MA200 indicate a BUY; STOCH (9, 6) is Overbought; while Average True Range (14) indicates Less Volatility.

Support is at 123.63 while Resistance is at 124.18

30th July2015 – 05:50hrs GMT

For more in depth Research & Analysis please visit FxGrow.

Note: This analysis is intended to provide general information and does not constitute the provision of INVESTMENT ADVICE. Investors should, before acting on this information, consider the appropriateness of this information having regard to their personal objectives, financial situation or needs. We recommend investors obtain investment advice specific to their situation before making any financial investment decision.
 
Daily Technical Analysis – 03rd Aug, 2015
By FxGrow Research & Analysis Team

EURUSD

EURUSD03Aug15_zpsqniwfjmb.png


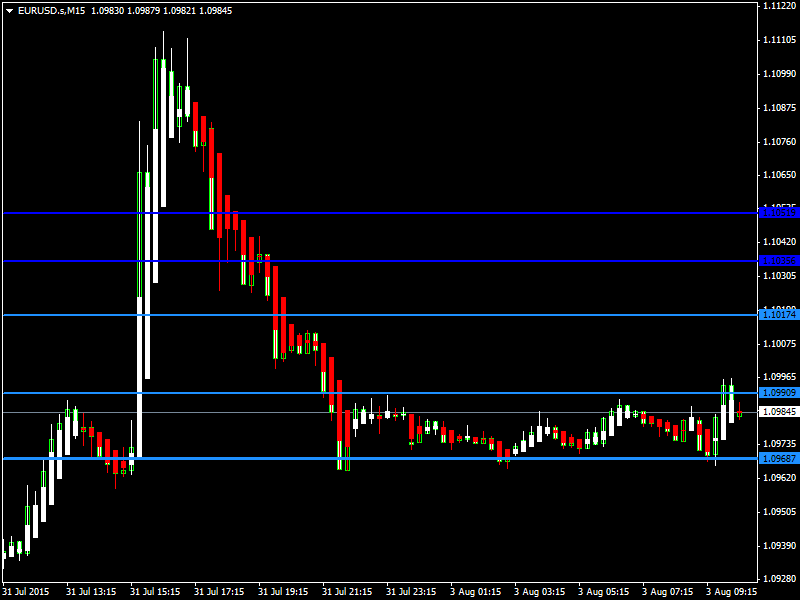
EURUSD was indecisive last week and opened the week lower this morning. Now the pair is trading below its 20day moving average of 1.0997 in the European trading session. The near term bias remains Neutral to Bullish with targets of 1.1050

RSI (14) is Neutral; STOCH (9, 6), STOCHRSI (14), MACD (12, 26), CCI (14), Ultimate Oscillator indicate a BUY; while Average True Range (14) indicates Less Volatility.

Support is at 1.0947 while Resistance is at 1.1034

03rd Aug 2015 – 07:29hrs GMT


GBPUSD

GBPUSD03Aug15_zpsb5navimm.png


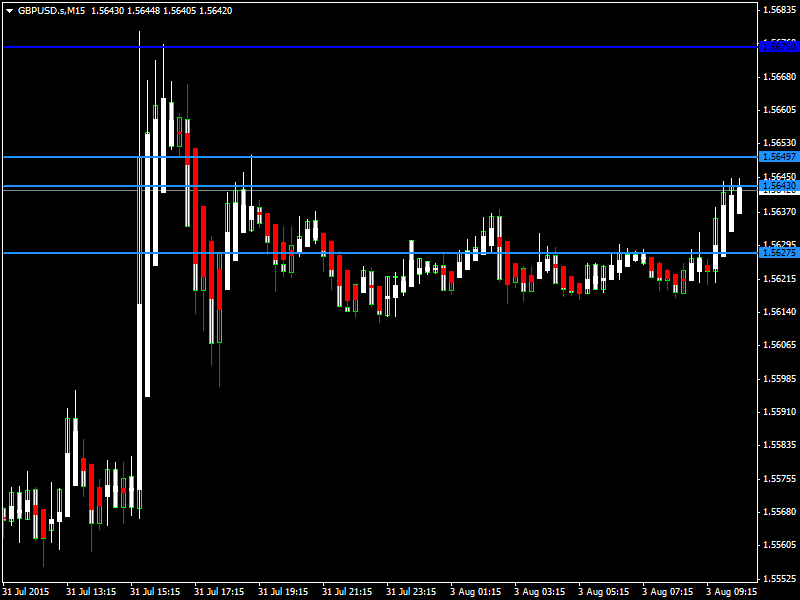
GBPUSD was bullish last week and opened the week at same levels. Now the pair is trading above its 20day moving average of 1.5628 in the European trading session. The near term bias remains Neutral to Bullish with targets of 1.5700

STOCH (9, 6), Ultimate Oscillator are Neutral; RSI (14), STOCHRSI (14), MACD (12, 26), ADX (14), ROC indicate a BUY; CCI (14) is Overbought; while Average True Range (14) indicates Less Volatility.

Support is at 1.5551 while Resistance is at 1.5675

03rd Aug 2015 – 07:45hrs GMT

For more in depth Research & Analysis please visit FxGrow.

Note: This analysis is intended to provide general information and does not constitute the provision of INVESTMENT ADVICE. Investors should, before acting on this information, consider the appropriateness of this information having regard to their personal objectives, financial situation or needs. We recommend investors obtain investment advice specific to their situation before making any financial investment decision.
 
Daily Technical Analysis – 03rd Aug, 2015
By FxGrow Research & Analysis Team

AUDUSD

AUDUSD03Aug15_zps2laitqsq.png


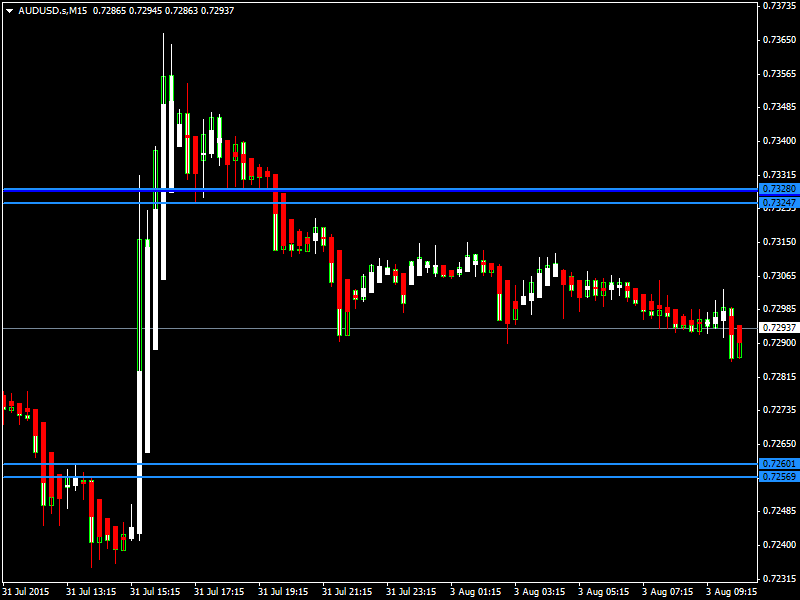
AUDUSD was bearish last week and opened the week at same levels. Now the pair is trading below its 20day moving average of 0.7309 in the European trading session. The near term bias remains Neutral to Bearish with targets of 0.7200

RSI (14) is Neutral; STOCH (9, 6), MACD (12, 26), ADX (14), CCI (14), Ultimate Oscillator, ROC, MA100, MA200 indicate a SELL; STOCHRSI (14) is Oversold; while Average True Range (14) indicates Less Volatility.

Support is at 0.7256 while Resistance is at 0.7328

03rd Aug 2015 – 07:50hrs GMT


USDJPY

USDJPY03Aug15_zpsmdc6ipch.png


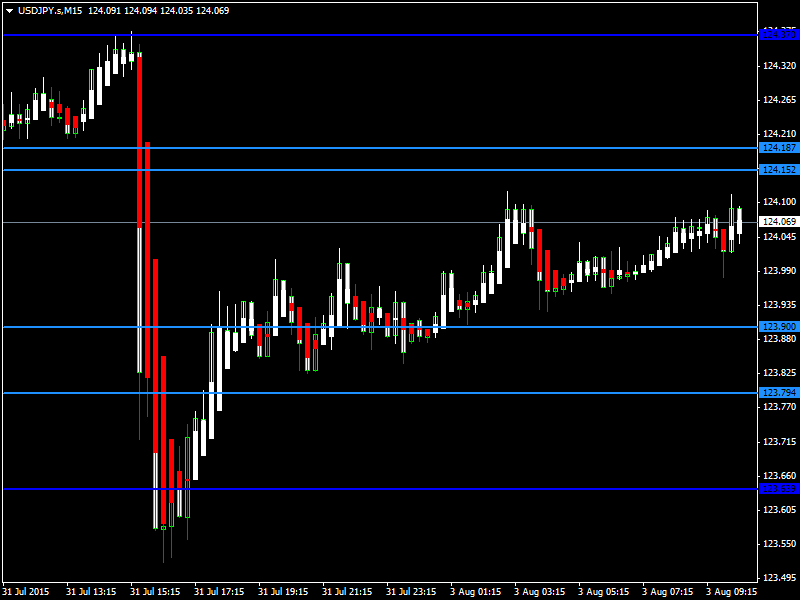
USDJPY was bullish last week and opened the week higher. Now the pair is trading above its 20day moving average of 123.95 in the European trading session. The near term bias remains Neutral to Bullish with targets of 124.70

RSI (14) is Neutral; STOCH (9, 6), ADX (14), CCI (14), Ultimate Oscillator, ROC, MA100, MA200 indicate a BUY; STOCHRSI (14) is Overbought; while Average True Range (14) indicates Less Volatility.

Support is at 123.63 while Resistance is at 124.37

03rd Aug 2015 – 07:55hrs GMT

For more in depth Research & Analysis please visit FxGrow.

Note: This analysis is intended to provide general information and does not constitute the provision of INVESTMENT ADVICE. Investors should, before acting on this information, consider the appropriateness of this information having regard to their personal objectives, financial situation or needs. We recommend investors obtain investment advice specific to their situation before making any financial investment decision.
 

Live Forex Chart

Currency
Rates
EUR / USD
1.12024
USD / JPY
158.214
GBP / USD
1.32029
USD / CHF
0.83343
USD / CAD
1.42690
EUR / JPY
177.125
AUD / USD
0.69537
Back
Top
Log in Register