On the daily chart, the price is flying like a bird in a hurricane inside an accumulating rage. If it gets out of the range, we are expecting a trendy move.
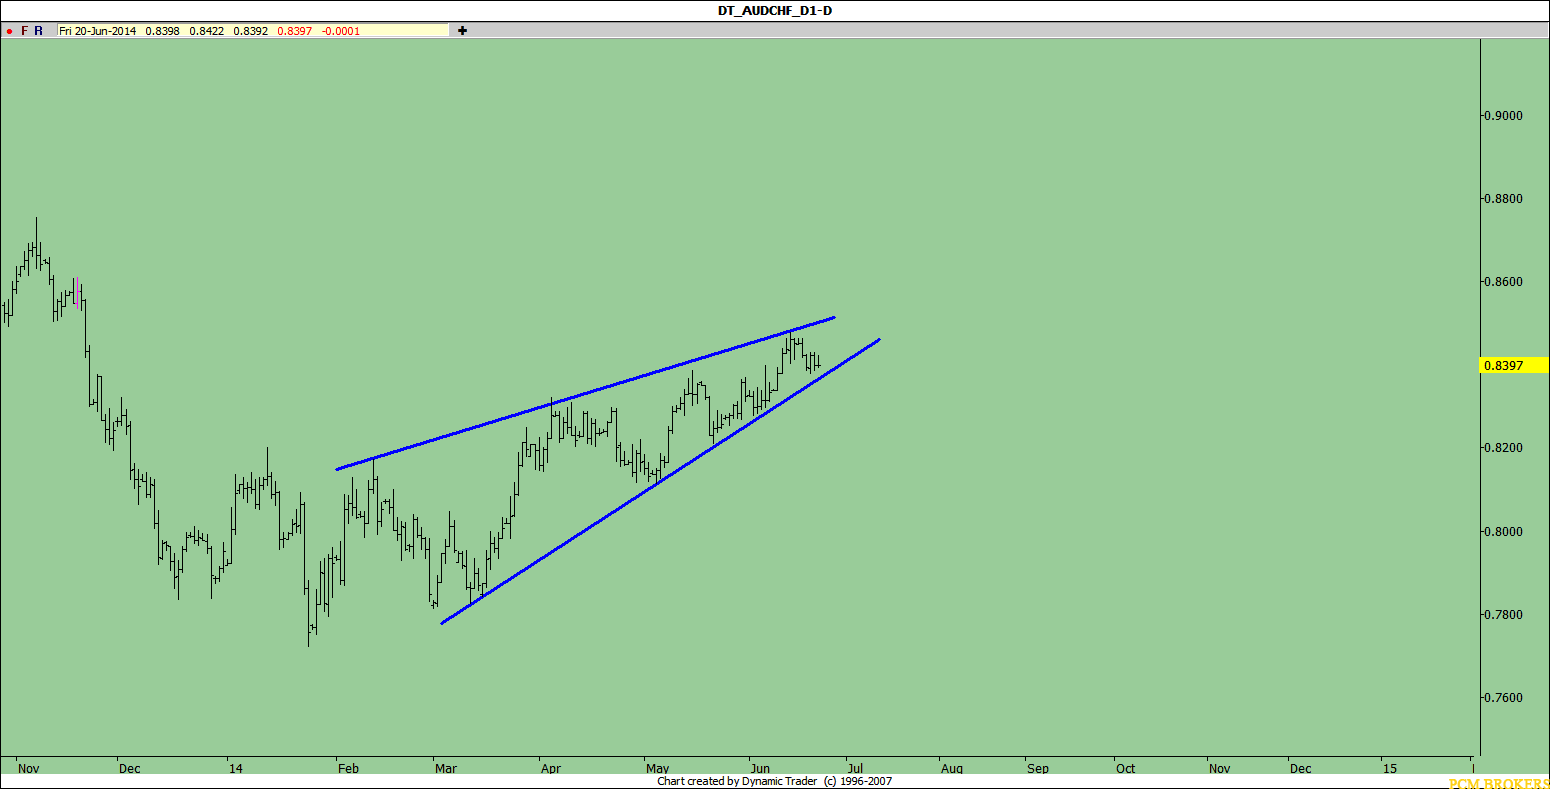
On the daily chart, we see the price reversed from the beneath of the channel top line by having a harmonic pattern being formed. As it continues, we are expecting a drop if the bottom of the channel has been broken lower by the price.
******************
On the H4 TF the price is moving along with an uptrend and we are observing a reversal from the harmonic pattern area. If 0.8794 is broken below strongly, we are expecting to have the price dropped to the trend line.
On the H4 chart, the price is behaving like a wild bull and the price is swinging around conversion area. We are expecting to see a high leveled price if the demand take the upper hand according to the respected condition. On the other hand the room will be provided for the price to drop by having the trend line broken below.
On the daily TF, a bullish channel ceiling breaking is on-sight. We are expecting the price to drop if the price stabilized below the channel well enough. On the other hand, this analysis would be rescinded if the price breached into the channel.
On the H4 chart by having the price reached to 1.4450 area the shark harmonic pattern will be formed and its time will be fulfilled till August 25th an we are expecting a jump up if the condition become well enough.