On the H4 chart we are observing a price reversal by having the Alt bat pattern formed. The expectation is to have the drop continued if the supply pressure persisted further.
By having the harmonic pattern formed on the daily TF we are observing a price reversal. Later, we are expecting to see a drop to the bottom of the channel if the selling pressure persisted.
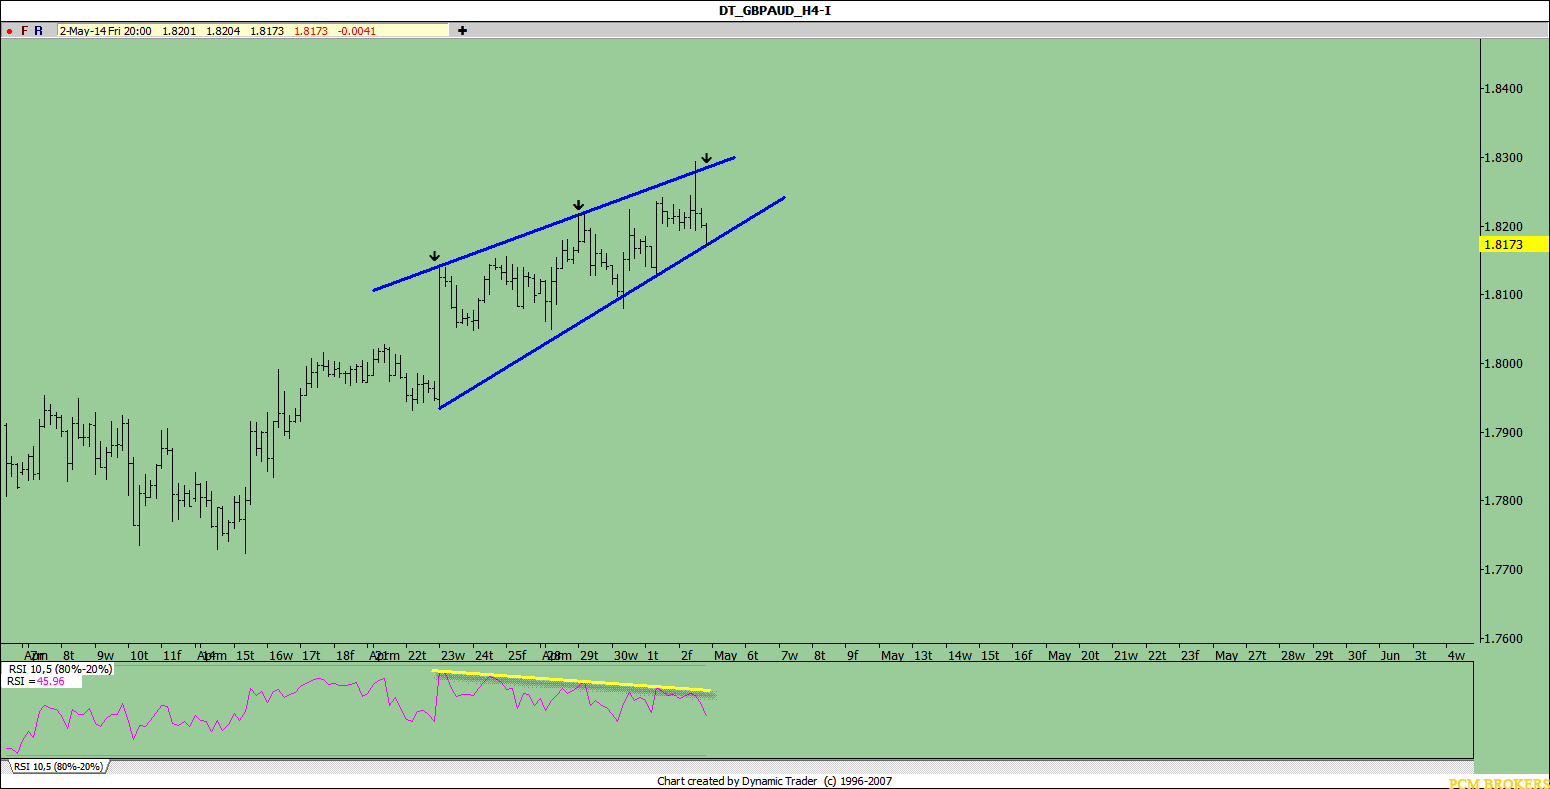
On the H4 chart we are observing a wedge pattern and on the other hand the indictor “RSI” is moving downside. In such a condition we are expecting to see a drop upon breaking 1.8150 area below.
On the daily chart, the price is within a bullish channel and near 2 harmonic patterns the reversal is on-sight. Till May 13th its time will be fulfilled. If the supply pressure persists across the market, the expectation is for a drop then.
On the H4 TF, we are observing the harmonic pattern low on bottom of the bearish channel and also a positive divergence has happened at almost the same time. Till May 20th its time will be fulfilled and we are expecting an up move if the demand fuels up across the market and having the price stabilized around 139.00.
On the daily chart, we are seeing the bottom of the channel is being broken below. If 0.9200 support level is violated, a drop could be observed by the pair.
The price is showing bullish behavior as a channel. We are expecting to have a drop if the 1.4950 being violated and the selling pressure extends across the market.
On the daily chart we see a Shark harmonic pattern and its time will be fulfilled till June 23 and we are expecting to have it up in case of happening positive divergence.