EURUSD has finished the first descending wave towards 1.1122 along with the correction at 1.1153. Possibly, today the pair may form the second descending wave to reach 1.1100 and then start another correction with the target at 1.1126. Later, the market may resume trading inside the downtrend towards 1.1081.
Japanese Candlesticks Analysis 24.10.2019 (USDCAD, AUDUSD)
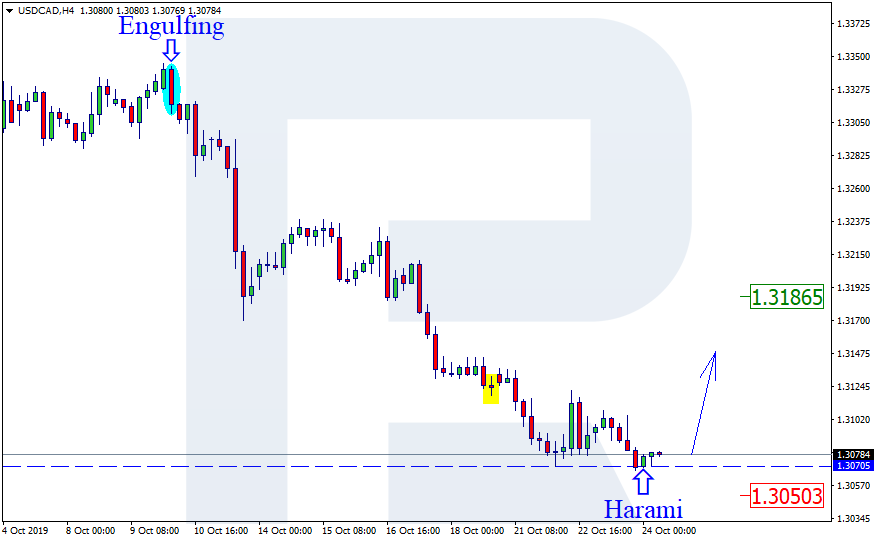
USDCAD, “US Dollar vs Canadian Dollar”
As we can see in the H4 chart, USDCAD has formed several reversal patterns, including Harami, close to the support level. Right now, the pair is reversing and may continue growing towards 1.3186. However, we shouldn’t ignore another scenario, according to which the instrument may fall to reach 1.3050.
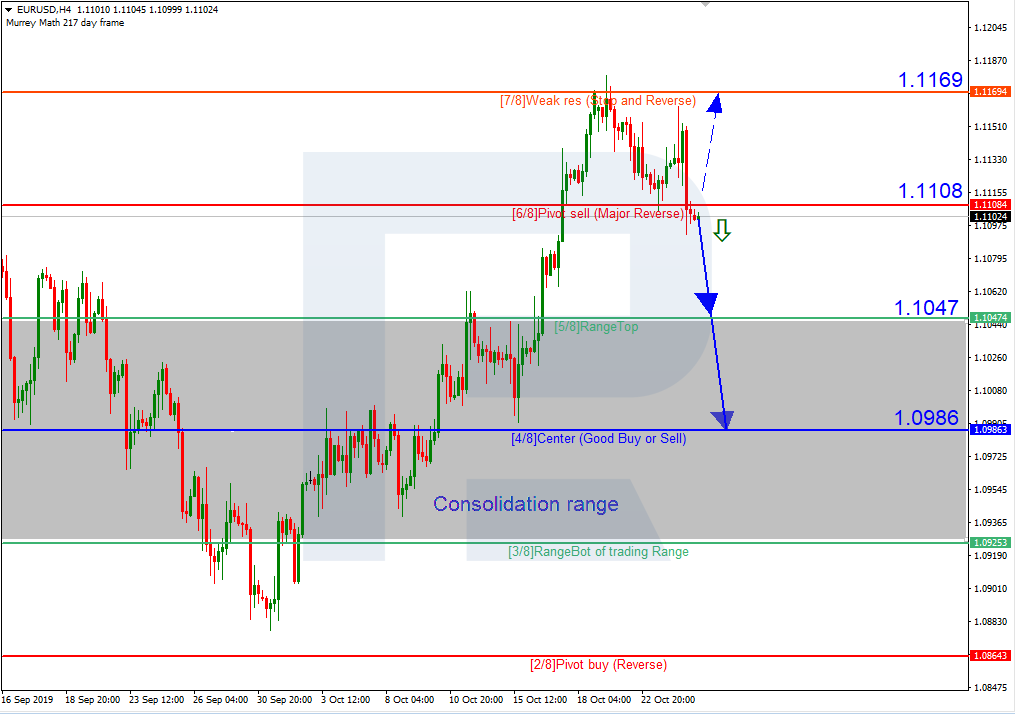
As we can see in the H4 chart, the rising tendency has stopped at 7/8. In this case, the price may complete the tendency and then start a new decline towards the support at 4/8. However, this scenario may no longer be valid if the price breaks 6/8 to the upside. After that, the instrument may continue growing and test the resistance at 7/8 again.
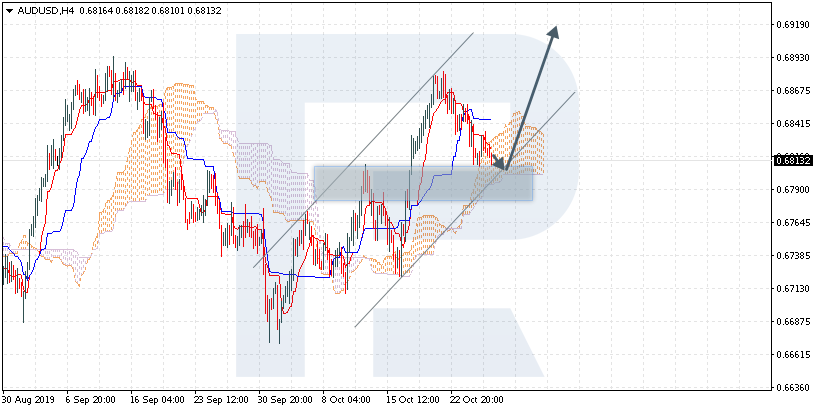
AUDUSD is trading at 0.6813; the instrument is moving inside Ichimoku Cloud, thus indicating a sideways tendency. The markets could indicate that the price may test the cloud’s downside border at 0.6805 and then resume moving upwards to reach 0.6920. Another signal to confirm further ascending movement is the price’s rebounding from the rising channel’s downside border. However, the scenario that implies further growth may be canceled if the price breaks the cloud’s downside border and fixes below 0.6775. In this case, the pair may continue falling towards 0.6685. After breaking the cloud’s upside border and fixing above 0.6870, the price may continue moving upwards.
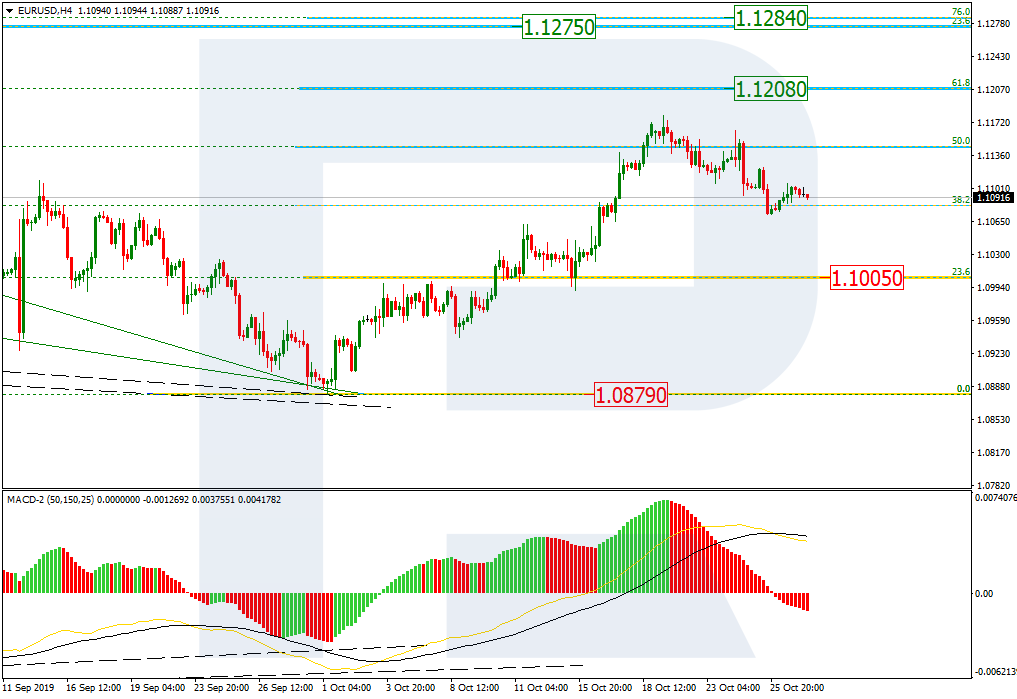
As we can see in the H4 chart, after reaching 50.0% fibo, EURUSD is correcting to reach the local support, which is 23.6% fibo at 1.1005. After finishing this descending correction, the pair may start a new wave to the upside to reach 61.8% and 76.0% fibo at 1.1208 and 1.1248 respectively. however, one should pay attention to long-term 23.6% fibo at 1.1275. If the price reaches this level, the instrument may reverse the current long-term tendency..
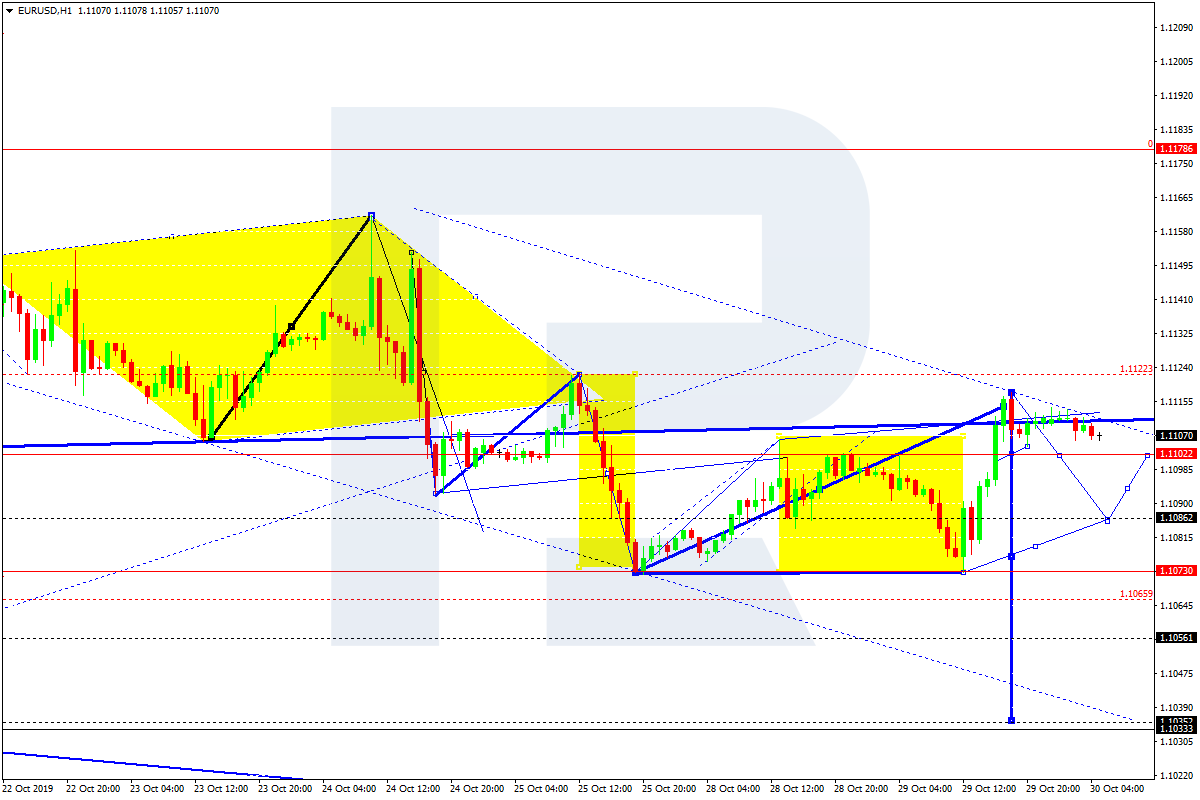
EURUSD has expanded the consolidation range towards 1.1117; in fact, the entire range may be considered as a correction. Possibly, the pair may choose an alternative scenario to continue the correction towards 1.1122. According to the main scenario, the price is expected to form a new descending structure to reach 1.1086, which may later be followed by a new grow towards 1.1102 and then further decline with the target at 1.1033.
Japanese Candlesticks Analysis 31.10.2019 (GOLD, NZDUSD)
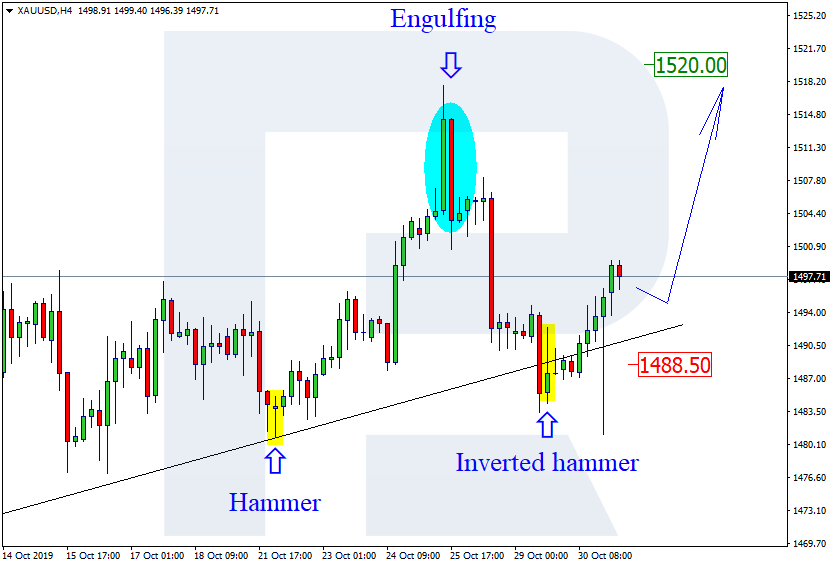
XAUUSD, “Gold vs US Dollar”
As we can see in the H4 chart, the ascending tendency continues. By now, XAUUSD has completed Inverted Hammer reversal pattern close to the support level. Ah the moment, the pair is reversing. In the future, the price may complete the correction and resume growing with the target at 1520.00. At the same time, we shouldn’t exclude an opposite scenario, which implies that the instrument may continue falling to reach 1488.50.
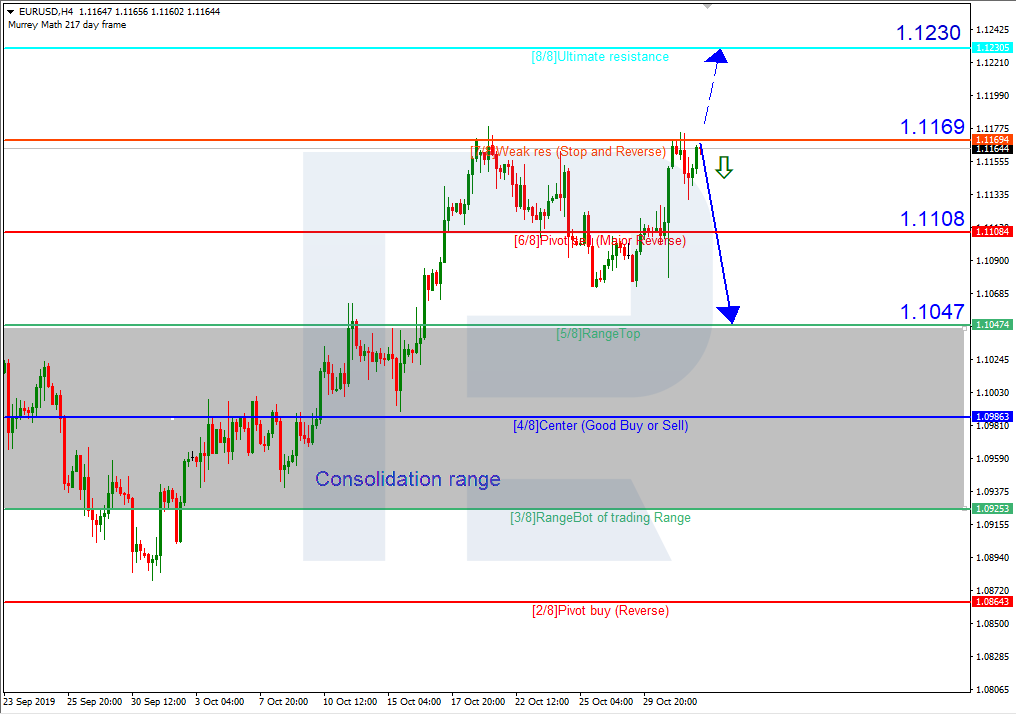
As we can see in the H4 chart, EURUSD is again moving close to 7/8. In this case, the price is expected to rebound from this level and then resume trading downwards to reach the support at 5/8. However, this scenario may no longer be valid if the price breaks 7/8 to the upside. After that, the instrument may continue growing and test the resistance at 8/8.
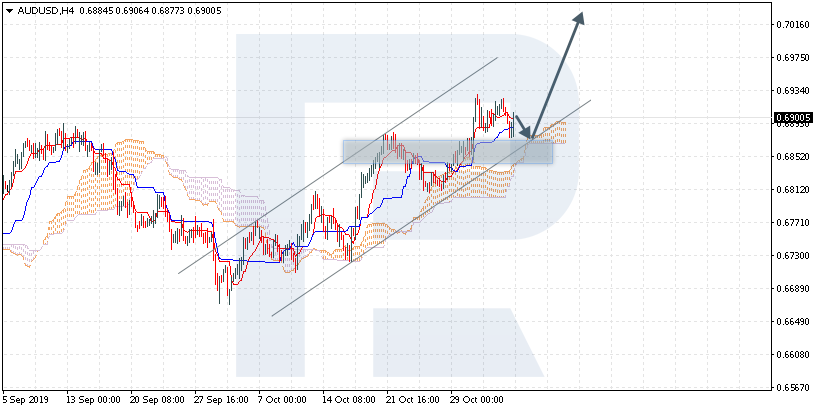
AUDUSD is trading at 0.6900; the instrument is moving above Ichimoku Cloud, thus indicating an ascending tendency. The markets could indicate that the price may test the cloud’s upside border at 0.6890 and then resume moving upwards to reach 0.7015. Another signal to confirm further ascending movement is the price’s rebounding from the rising channel’s downside border. However, the scenario that implies further growth may be canceled if the price breaks the cloud’s downside border and fixes below 0.6840. In this case, the pair may continue falling towards 0.6755.
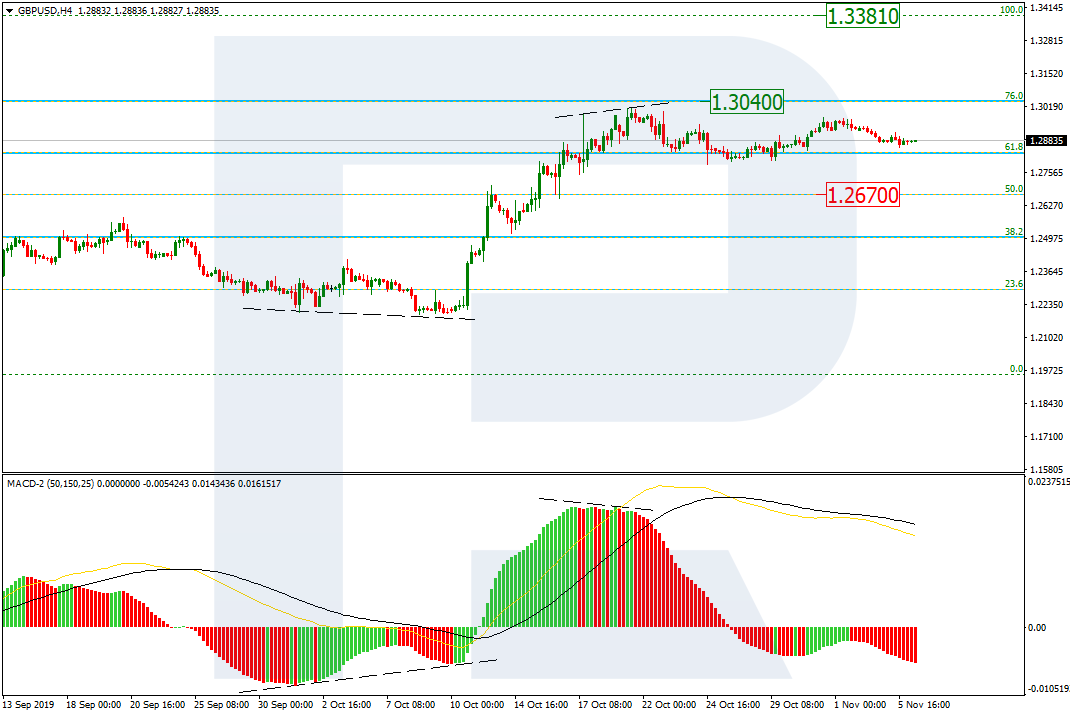
As we can see in the H4 chart, there was a divergence on MACD, which made GBPUSD complete the rising wave at 76.0% fibo at 1.3040 and start a new pullback. The support is at 1.2670. After completing the pullback, the instrument may start another rising impulse to reach the previous high at 1.3012 and then the key one at 1.3381.