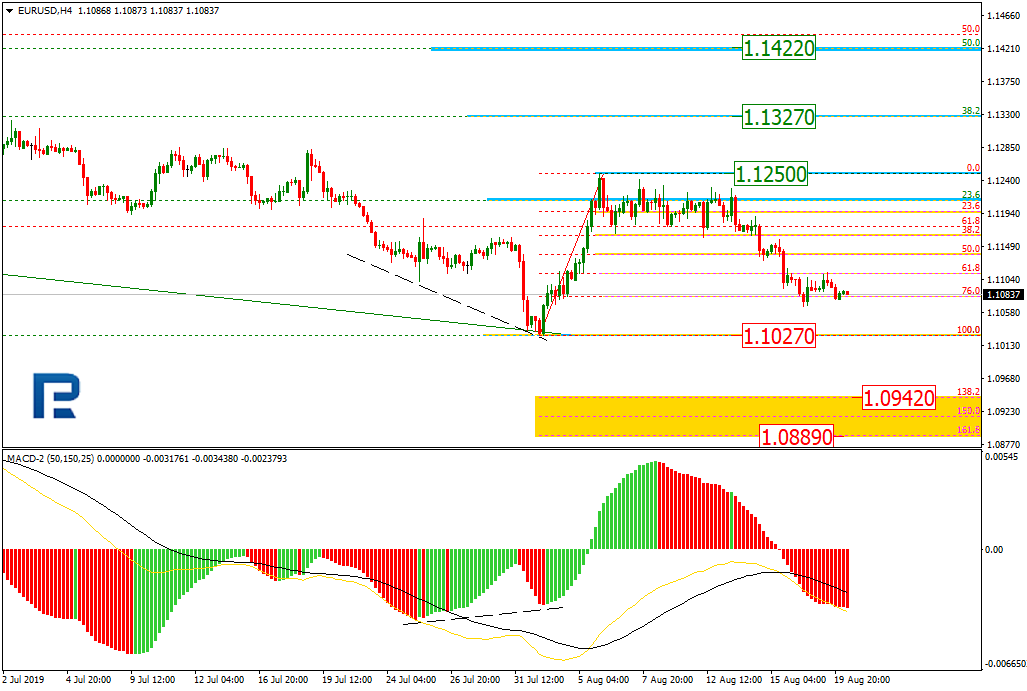
As we can see in the H4 chart, EURUSD has reached a very significant correctional level, 76.0% fibo and may continue falling towards the lows at 1.1027. After breaking the low, the price may continue trading towards the post-correctional extension area between 138.2% and 161.8% fibo at 1.0942 and 1.0889 respectively. Another scenario implies that the pair may start a new rising wave without breaking the low. In this case, the ascending correction may continue towards 38.2% and 50.0% fibo at 1.1327 and 1.1422 respectively.
EURUSD has rebounded from 1.1106 to the downside. Possibly, the pair may break 1.1090 and then continue trading downwards to reach 1.1060. After that, the instrument may be corrected to return to 1.1090 and then resume trading inside the downtrend with the target at 1.1019.
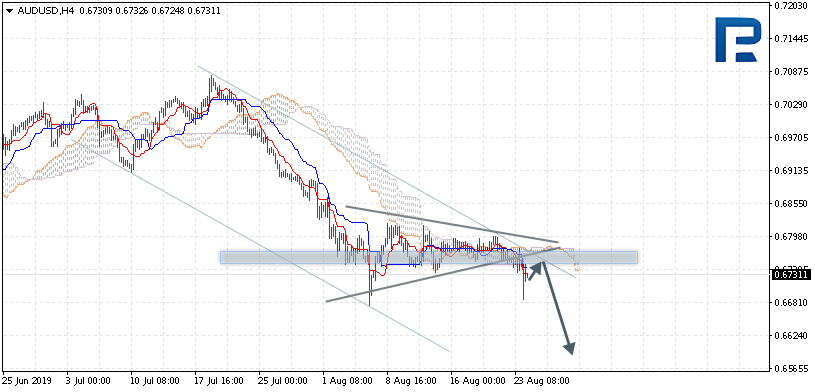
AUDUSD is trading at 0.6731; the instrument is moving below Ichimoku Cloud, thus indicating a descending tendency. The markets could indicate that the price may test Tenkan-Sen and Kijun-Sen at 0.6740 and then resume moving downwards to reach 0.6605. Another signal to confirm further descending movement is the price’s rebounding from the descending channel’s upside border. However, the scenario that implies further decline may be canceled if the price breaks the cloud’s upside border and fixes above 0.6810. In this case, the pair may continue growing towards 0.6905.
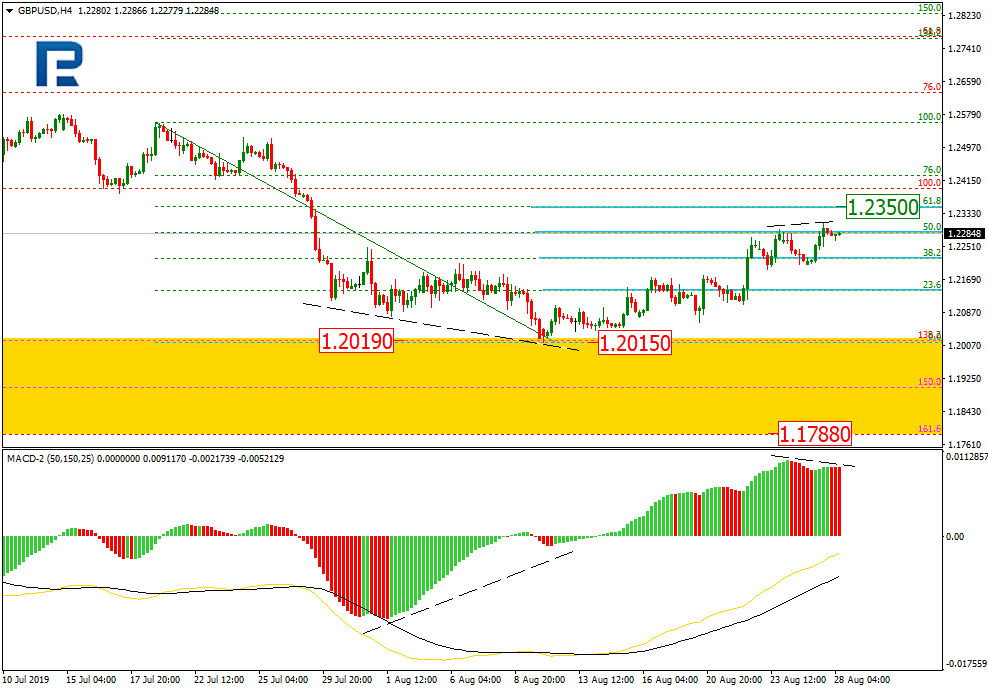
As we can see in the H4 chart, the correctional uptrend is heading towards 61.8% fibo at 1.2350. After completing the correction, GBPUSD may form a new descending structure to reach the support at 1.2015. The mid-term downside targets are inside the post-correctional extension area between 138.2% and 161.8% fibo at 1.2019 and 1.1788 respectively.
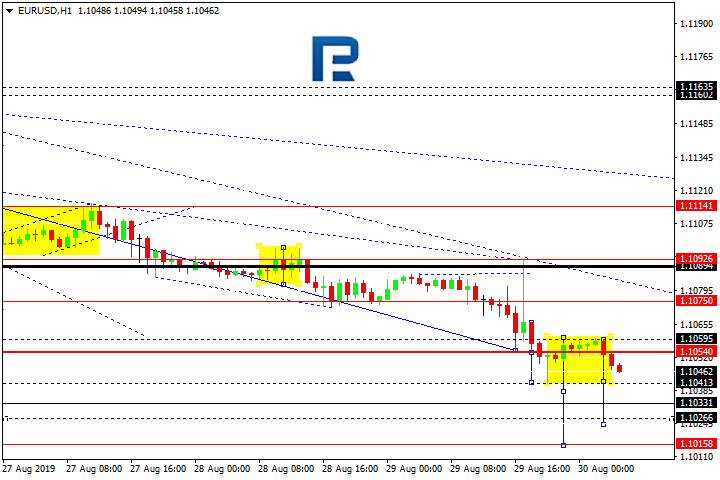
After reaching another target at 1.1055, EURUSD has returned to 1.1090; right now, it is forming another descending wave towards 1.1026. After that, the instrument may start a new correction to return to 1.1055 and then resume trading inside the downtrend with the target at 1.1016.
As we can see in the H4 chart, after finishing the short-term pullback, EURUSD is forming a new descending impulse. It seems as if the previous low at 1.1027 couldn’t provide enough resistance to bears and now acts as the resistance for bulls. After breaking the previous low, the instrument continue falling towards the post-correctional extension area between 138.2% and 161.8% fibo at 1.0942 and 1.0889 respectively.
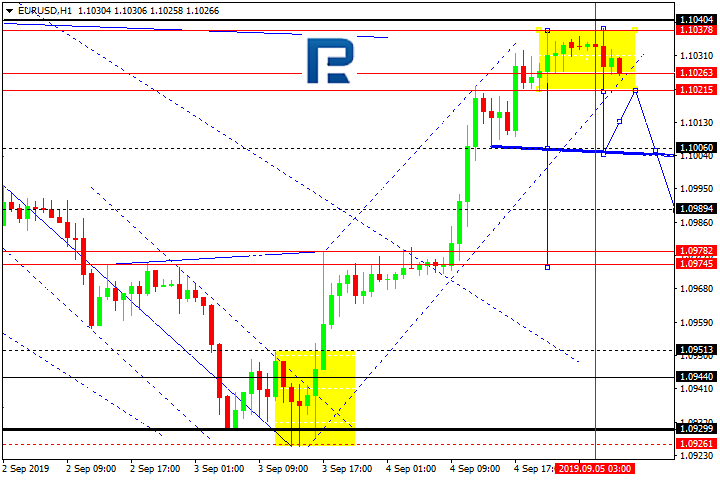
After forming a continuation pattern around 1.0975 and breaking it to the upside, EURUSD has completed the ascending wave at 1.1030; right now, it is trading around this level. Possibly, the pair may consolidate close to these highs; there is Double Top pattern at 1.1037. According to the main scenario, the price is expected to fall and break 1.1021. The first target is at 1.1006.
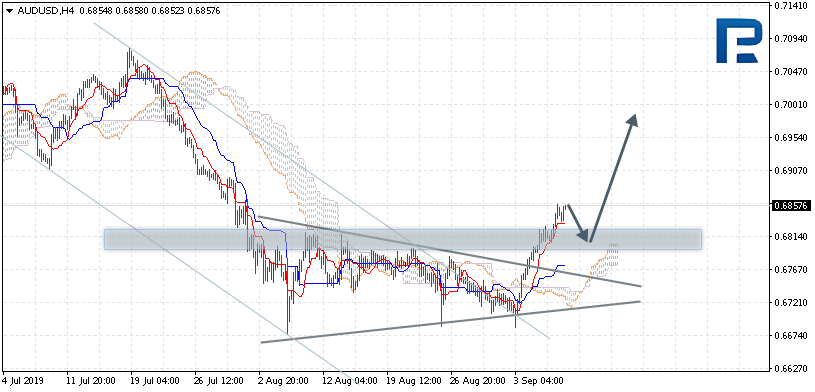
AUDUSD is trading at 0.6857; the instrument is moving above Ichimoku Cloud, thus indicating an ascending tendency. The markets could indicate that the price may test Tenkan-Sen and Kijun-Sen at 0.6815 and then resume moving upwards to reach 0.7005. Another signal to confirm further ascending movement is the price’s rebounding from the support level. However, the scenario that implies further growth may be canceled if the price breaks the cloud’s downside border and fixes below 0.6730. In this case, the pair may continue falling towards 0.6605.
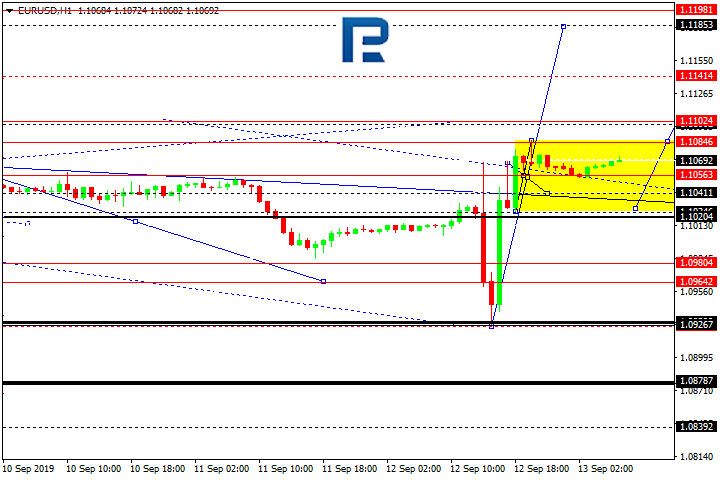
After finishing the descending wave at 1.0927 and almost forming Double Bottom pattern, EURUSD has completed the ascending impulse towards 1.1085; right now, it is consolidating around 1.1056. If later the price breaks this range to the upside, the instrument may resume trading upwards with the target at 1.1185; if to the downside – then start another decline to reach 1.1000.
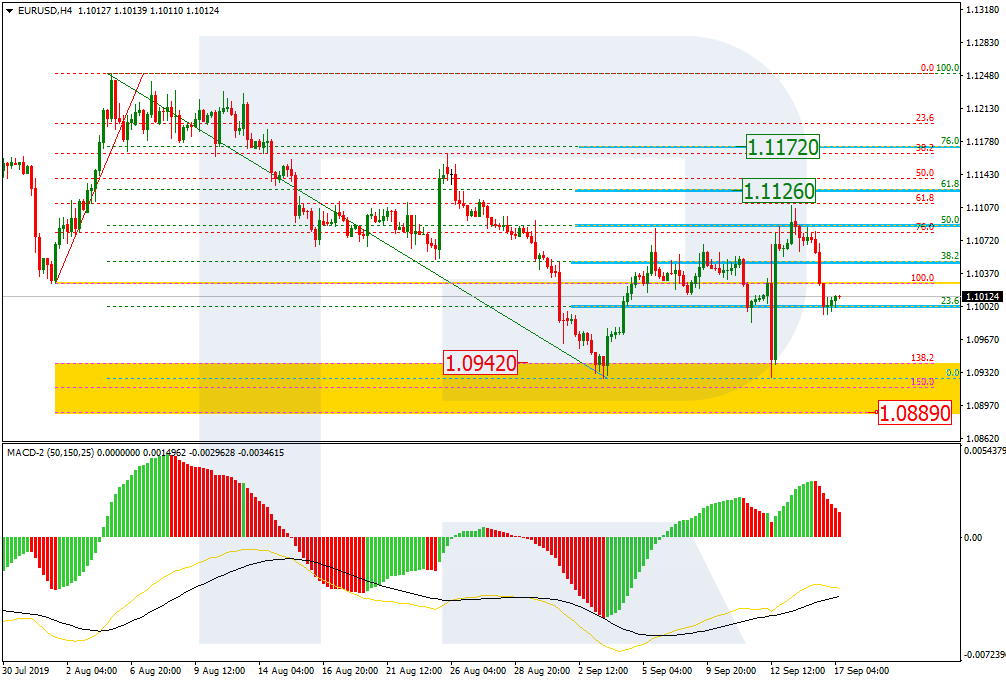
As we can see in the H4 chart, after reaching the post-correctional extension area between 138.2% and 161.8% fibo at 1.0942 and 1.0889 respectively again, EURUSD tried to grow and reach 61.8% fibo at 1.1126, but unsuccessfully. The current decline may be considered as a descending correction. The structure of this correction indicates uncertainty among investors, “turbulence” on the market, and a possibility of further expansion of the range, but the descending tendency is not over yet. Hence, the correction may yet continue to reach 61.8% and 76.0% fibo at 1.1126 and 1.1172 respectively in the short-term, but the key long-term targets are below the lows.