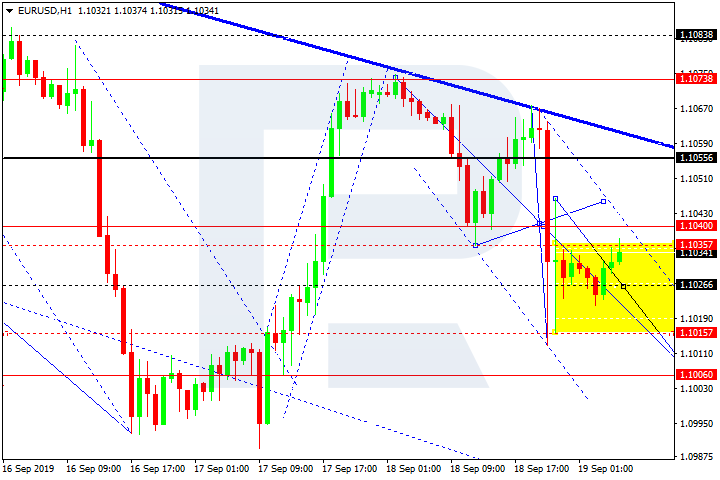
EURUSD has broken 1.1040 by completing the second descending impulse; right now, it is still moving downwards. Today, the pair may form the third impulse to reach 1.1006 and then resume growing with the target at 1.1040.
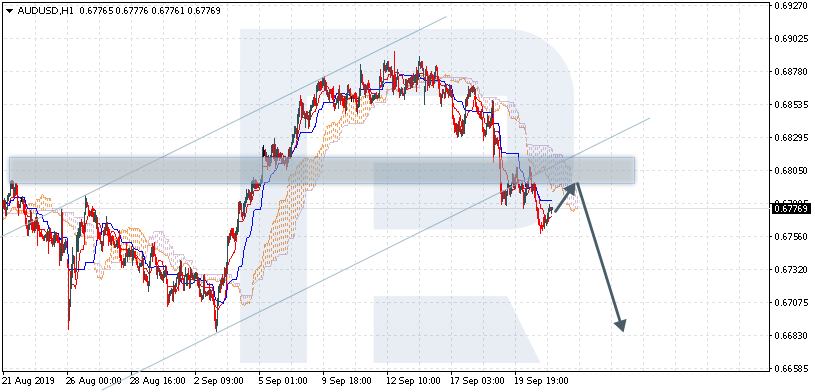
AUDUSD is trading at 0.6776; the instrument is moving below Ichimoku Cloud, thus indicating a descending tendency. The markets could indicate that the price may test the cloud’s upside border at 0.6785 and then resume moving downwards to reach 0.6685. Another signal to confirm further descending movement is the price’s rebounding from the resistance level. However, the scenario that implies further decline may be canceled if the price breaks the cloud’s upside border and fixes above 0.6835. In this case, the pair may continue growing towards 0.6915.
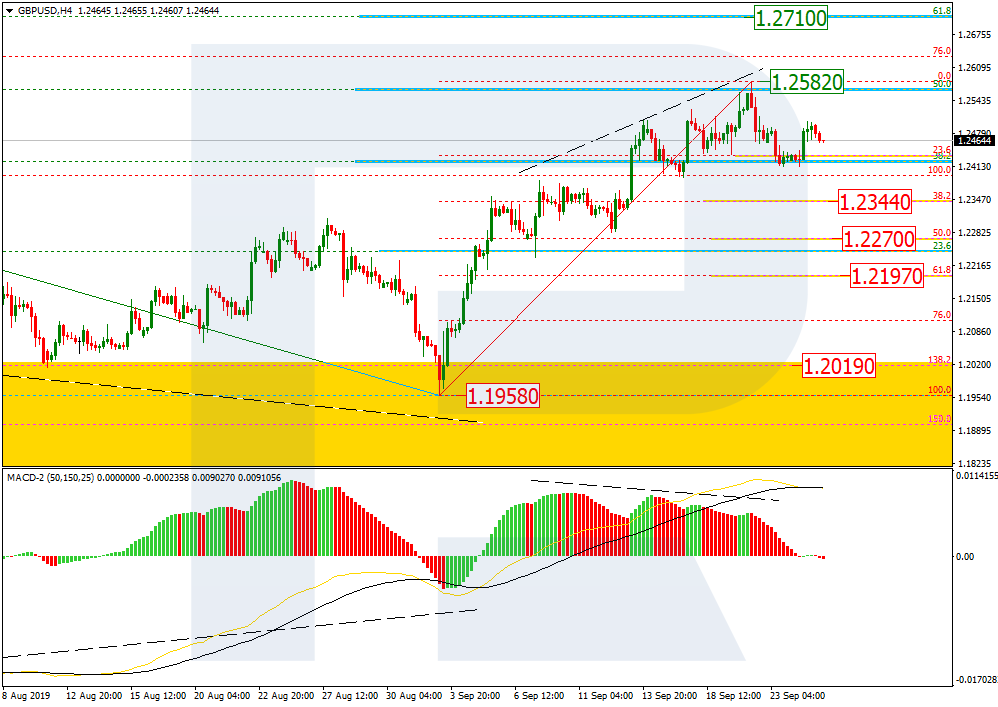
As we can see in the H4 chart, there was a divergence on MACD, which made the pair start a new descending tendency after reaching 50.0% fibo. GBPUSD is slowly falling to reach 23.6% fibo, but a local ascending impulse hints at a new growth towards the high at 1.2518 and then mid-term 61.8% fibo at 1.2710. However, the key scenario implies further decline towards 38.2%, 50.0%, and 61.8% fibo at 1.2344, 1.2270, and 1.2197 respectively.
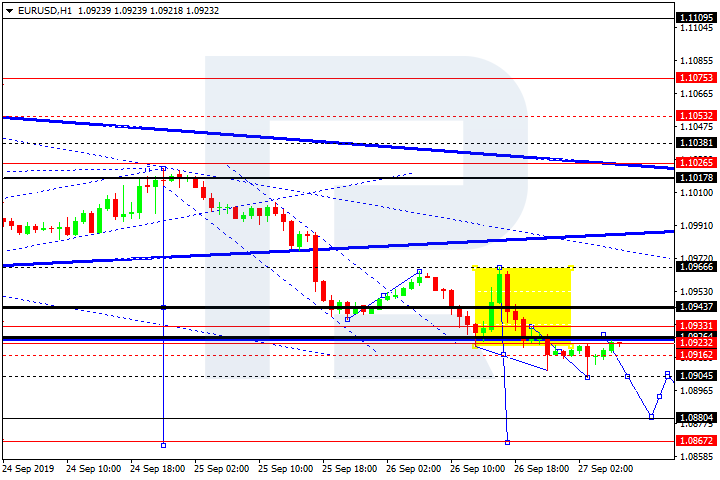
After reaching the downside target at 1.0920 and completing the correction towards 1.0966, EURUSD started another decline with the target at 1.0868 and has already broken 1.0922 to expand the range downwards. After that, the instrument may test 1.0922 from below and then resume trading inside the downtrend with the target at 1.0882.
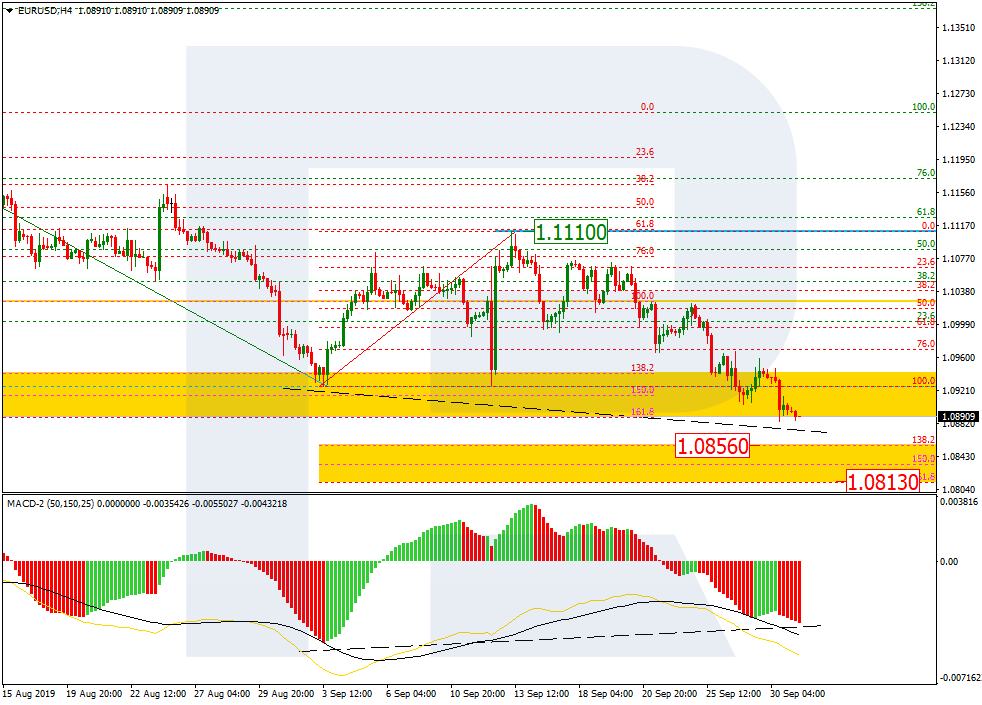
As we can see in the H4 chart, after finishing the correction by breaking the key low, EURUSD has closed the first post-correctional extension area between 138.2% and 161.8% fibo at 1.0942 and 1.0889 respectively. The current decline is heading towards the next post-correctional extension area between 138.2% and 161.8% fibo at 1.0856 and 1.0813 respectively. The long-term downtrend is looking quite stable, but there is a convergence on MACD, which may indicate a possible reverse soon. The resistance is at 1.1110.
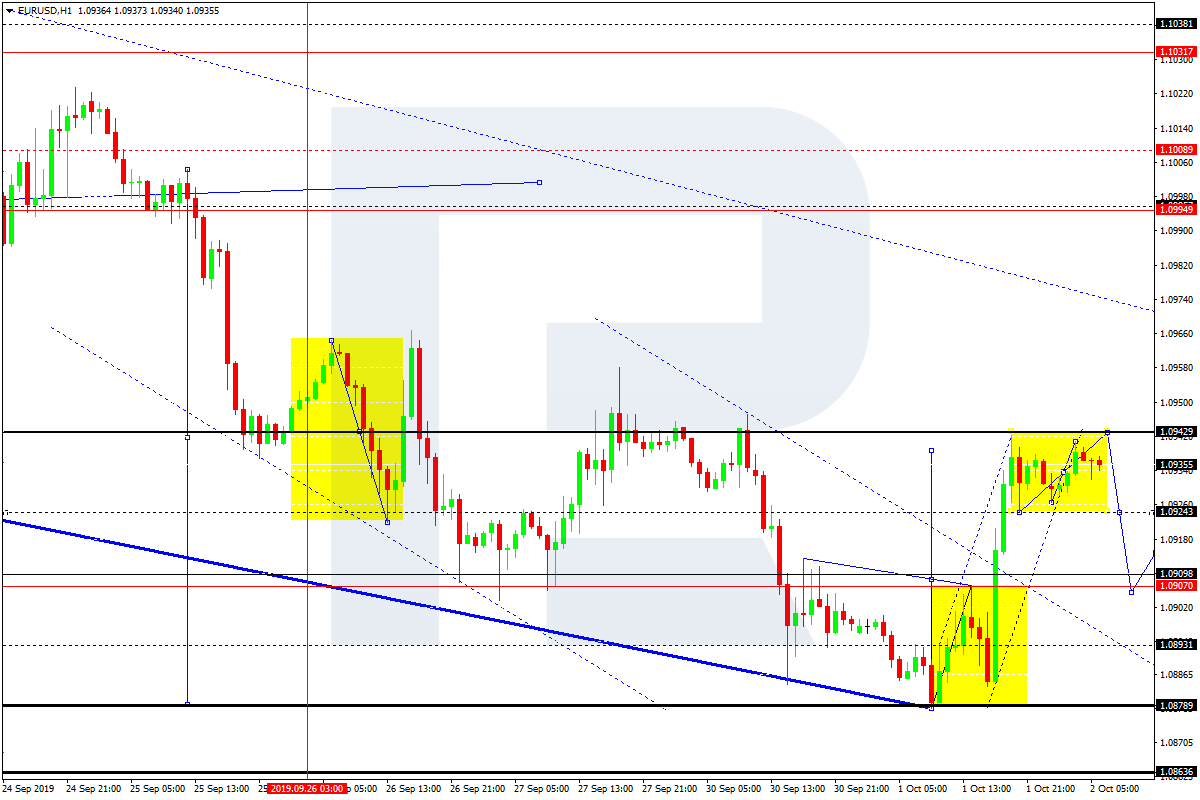
After finishing the correction at 1.0940, EURUSD is consolidating near the highs. Possibly, the pair may expand the range towards 1.0943 and then form a new descending structure to reach 1.0924. Later, the market may break the range to the downside and continue trading inside the downtrend with the target at 1.0907.
Japanese Candlesticks Analysis 03.10.2019 (USDCAD, AUDUSD)
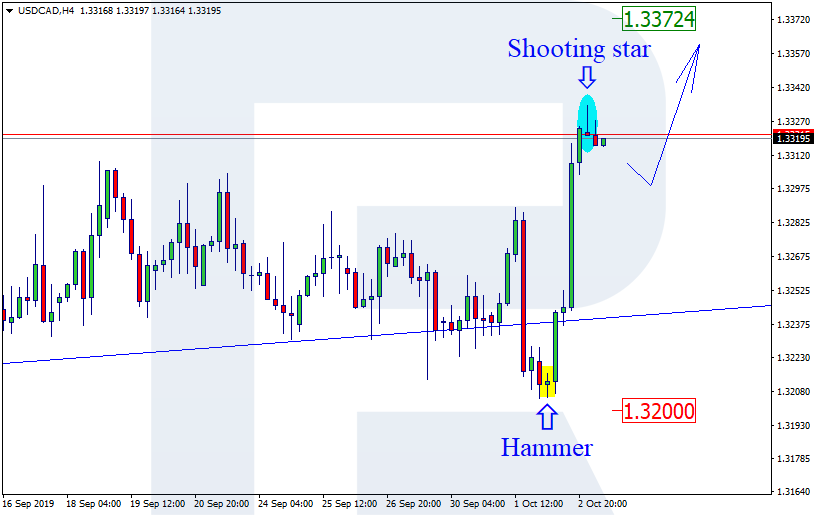
USDCAD, “US Dollar vs Canadian Dollar”
As we can see in the H4 chart, after forming several reversal patterns close to the rising channel’s downside border and reversing, USDCAD has formed Shooting Star pattern in the center of the channel, which may indicate a new correction before the price continues growing towards 1.3372. However, we shouldn’t ignore another scenario, according to which the instrument may fall and return to 1.3200.
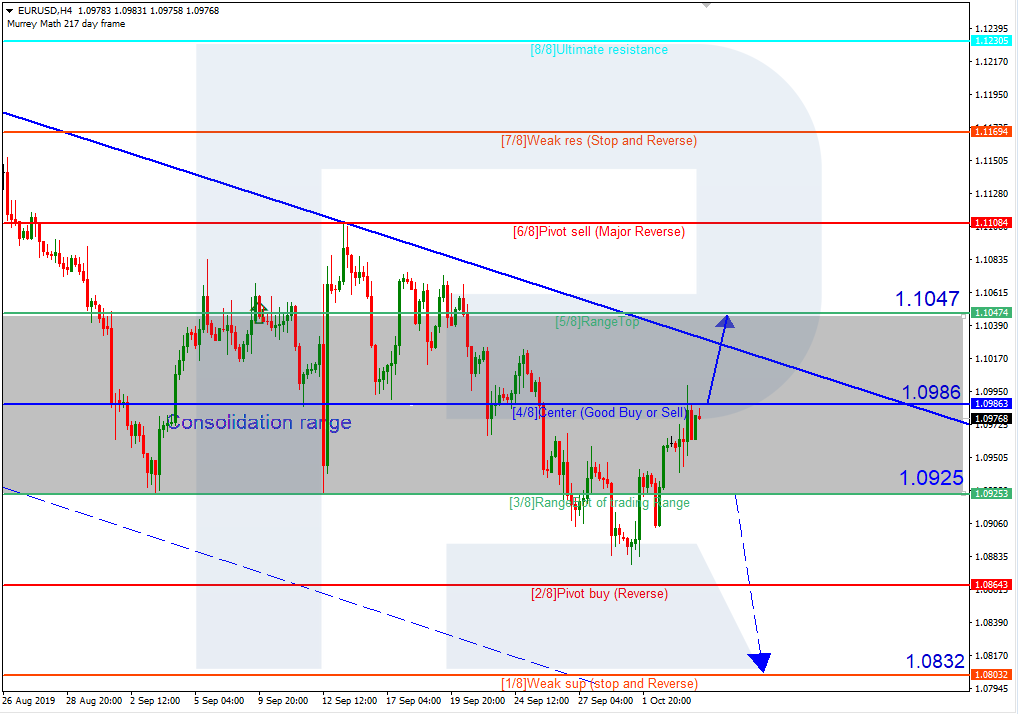
In the H4 chart, EURUSD is consolidating. In this case, the price is expected to continue growing towards the resistance at 5/8. However, this scenario may no longer be valid if the price breaks 3/8 to the downside. After that, the instrument may continue falling towards the support at 1/8.
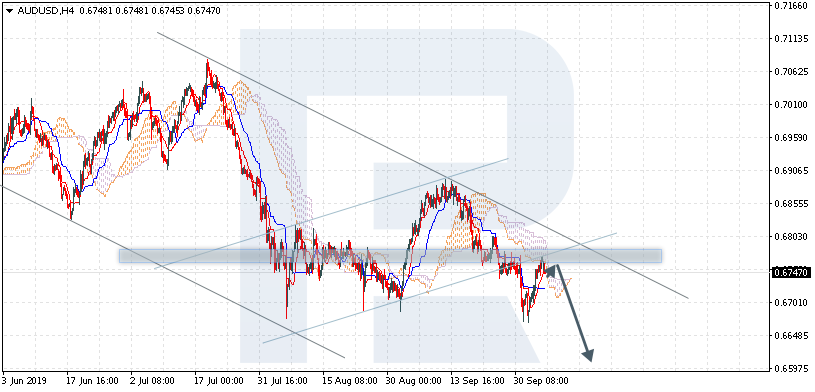
AUDUSD is trading at 0.6747; the instrument is moving below Ichimoku Cloud, thus indicating a descending tendency. The markets could indicate that the price may test the cloud’s upside border at 0.6760 and then resume moving downwards to reach 0.6595. Another signal to confirm further descending movement is the price’s rebounding from the rising channel’s downside border. However, the scenario that implies further decline may be canceled if the price breaks the cloud’s upside border and fixes above 0.6805. In this case, the pair may continue growing towards 0.6885.
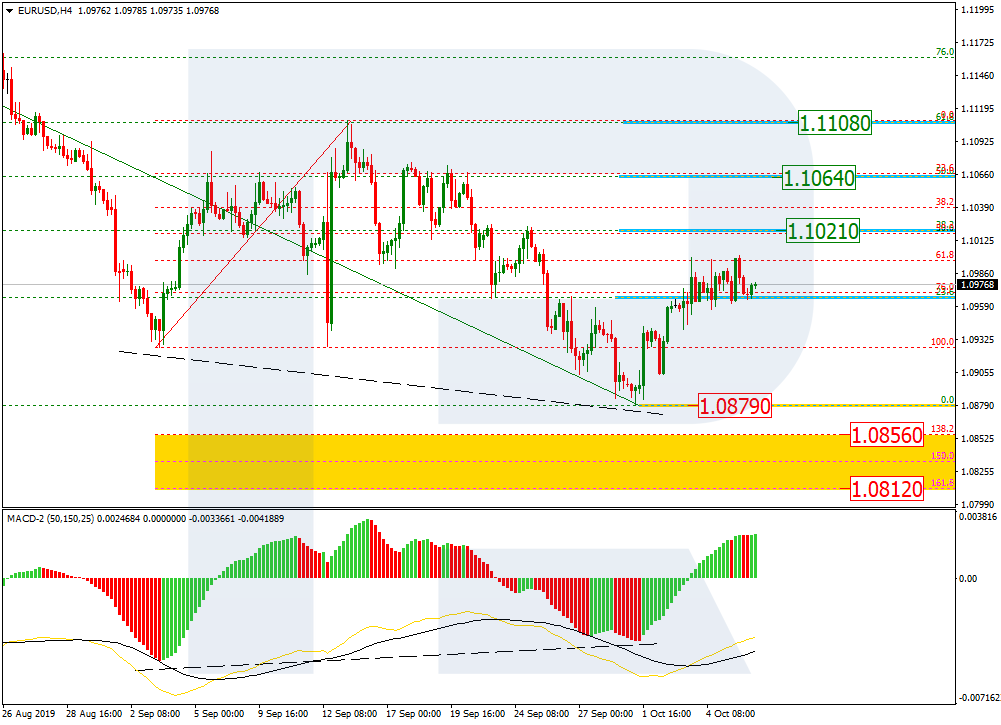
As we can see in the H4 chart, the convergence made the pair finish its decline at 1.0879 and start a new ascending tendency. However, one shouldn’t exclude the possibility that EURUSD may yet break the low and continue falling towards the post-correctional extension area between 138.2% and 161.8% fibo at 1.0856 and 1.0812 respectively. At the same time, according to the main scenario, the price is expected to reverse upwards. By now, the instrument has already reached 23.6% fibo and may continue growing towards 38.2%, 50.0%, and 61.8% fibo at 1.1021. 1.1064, and 1.1108 respectively to confirm the reversal and the long-term tendency change.