BTC USD 83,585.0 Gold USD 4,194.30
Time now: Jun 1, 12:00 AM

Daily Technical Analysis by FxGrow

FxGrow Daily Technical Analysis – 09th May, 2017
By FxGrow Research & Analysis Team

Gold Remains Under Pressure With Sideways Trading, Technical
gold_zpsx8wwzrju.png


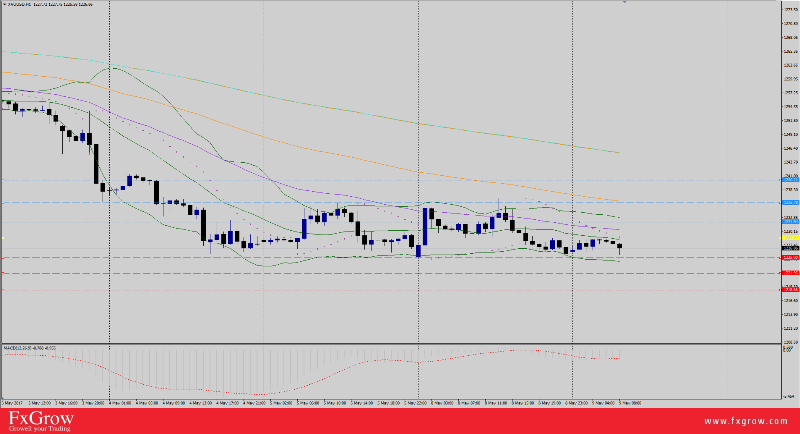
Gold dipped yesterday to 1220 but managed to reject bear forces and climbed back to 1236 high, then retreated to 1230 level at which the precious metal found hard time breaking creating a strong support. Later on, 1230 failed and plunged to 1225 as U.S Dollar hiked to 99.03 high. Gold currently trading 1228, and if the XAUUSD stayed below 1228 (H5 Pivot), expectations for further declines towards 1225 S1, in case of penetration, 1218 will be the next destination.

The other scenario, long positions above 1228, market should expect buying demand seeing 1235 a the first station. If gold breaks 1235, traders should see 1239, 1240 as the next stage for gold bull forces. In absence of vital U.S economic news, gold should trade between support and resistance. Price range most preferable is between 1225 and 1236. Keep an eye on U.S Index levels, in case of strengthening, expectations of pressuring yellow metal aligned with congestion. Be careful from set backs at a first test on both support and resistance, only long positions below or above S&R can confirm gold's next destination.

Trend: Bearish , but sideways trading is more expected.

Five hours pivot 1228

Resistance levels: R1 1231.94, R2 1235.78, R3 1240.21

Support levels: S1 1225.04, S2 1221.95, S3 1218.66

For more in depth Research & Analysis please visit FxGrow.http://fxgrow.com/analysis-educatio...cal-analysis-fxgrow-free-forex-analysis-tools

Note: This analysis is intended to provide general information and does not constitute the provision of INVESTMENT ADVICE. Investors should, before acting on this information, consider the appropriateness of this information having regard to their personal objectives, financial situation or needs. We recommend investors obtain investment advice specific to their situation before making any financial investment decision.
 
FxGrow Daily Technical Analysis – 10th May, 2017
By FxGrow Research & Analysis Team

The Rift Between OPEC And U.S Fluctuates Oil Levels, Eyes on U.S Inventories
Crude_zps3heah0cg.png


Fundamentals:

The conflict between OPEC and U.S with opposed interest seeking high and lower oil prices becomes clearer as events accelerate, creating high volatility between ups and downs for oil. It's obvious that the two parties (OPEC and U.S), OPEC and Non-OPEC counties are highly dependable on crude oil as a source of economical income and they are sufficient as local production, whilst the U.S local oil production does not cover up its local demand, not to mention crude oil imports. Add to that, U.S Shale production is more expensive than oil produced by OPEC counties. Recent Tax plan released by Trump's administration, cutting corporate tax from 35% to 15%, was highly questioned by analysts as the plan itself, could lead to U.S trade deficit, and since U.S is the highest consumer for crude oil after China, you can understand clearly why the U.S will do its best, keeping markets glutted with oil supply, which logically results in lower oil prices taking into consideration that supply overpasses demand.

On the other hand, OPEC recent meeting and next meeting still in Vienna, focuses on one title, cutting or reducing their oil production in order to curb global glut, keeping it below global demand would result in higher oil prices. OPEC also followed a tactic where a report is released on monthly basis, measuring oil production compliance as a reminder that the higher a compliance is, markets would take the cutting-production-deal more serious, hence pushing oil prices higher.

Now we have established the above fundamentals, traders can understand why oil prices were highly fluctuating like ping pong recently, a strike from U.S, and a respond from OPEC. The sharper tone that the strike is, the more impact it has on oil bullish and bearish forces.

On Friday, oil dipped to $43.73 bp, lowest since Nov-2016, after signs in the Straits of Malacca, dozens of tankers loaded with record amounts of unsold fuel show an OPEC-led agreement to cut production in the first half of 2017 has yet to tighten the market.

Yesterday, Crude levels remained bearish with a higher low than Friday at $45.52 bp after the American Petroleum Institute (API) reported a hefty draw of 5.789 million barrels in United States crude oil inventories, compared to analyst expectations that markets would see a crude oil draw of 1.8 million barrels for the week ending May 5. (Reuters).

Other factors contributed to crude bearish prices report released yesterday showing that Libya’s oil production has reached 780,000 barrels per day – the highest level since October 2014, according to new data collected from an anonymous source by Bloomberg. Oil prices have been tumbling since last week, when both Libya and Nigeria – the countries exempt from OPEC’s production reduction deal – reported climbing outputs as the nations recover from years and months of domestic strife, respectively.

Oil managed to recover from yesterday's lows after Reuters reported that Saudi Arabia would cut supplies to the region as OPEC battles against rising U.S. output that is threatening to derail its attempts to end a sustained global glut in crude. State-owned Saudi Aramco will reduce oil supplies to Asian customers by about 7 million barrels in June, a source told Reuters, as part of OPEC's agreement to reduce production and as it trims exports to meet rising domestic demand for power during the summer.

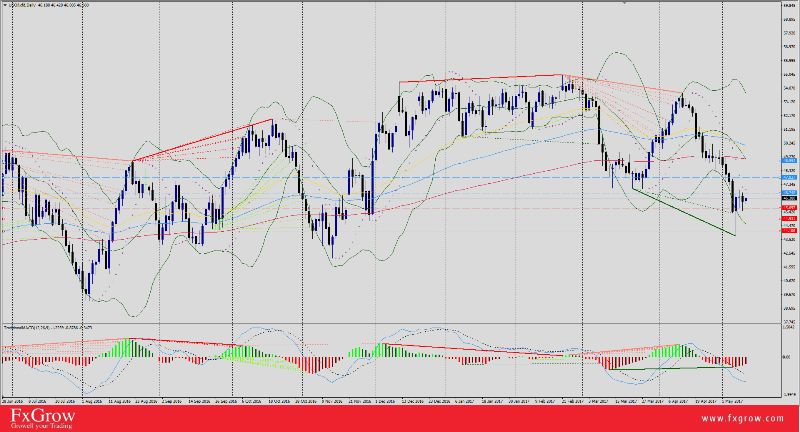
Today, crude oil showed stingy price action with 34-pips with 46.34 high, indication low volatility and it's expected to remain still, but market should expect higher movements for oil as U.S released its Crude Oil Inventories at 2:30 PM GMT.

Summary: Crude is expected to remain bearish for the short run given the date distance between API reports showing an increase supply, and OPEC and Non-OPEC next meeting on May 25th. On the short run, traders trade on the fact the U.S currently has the upper hand with messages that markets are glutted, and since doubts still revolves around OPEC next meeting and its possible outcomes taking into consideration that OPEC has insisted that the compliance should be mutual by both OPEC and Non-OPEC counties.

Technical Overview:

Trend: Bearish

Resistance levels: R1 46.74, R1 47.82, R3 48.99 (D1)

Support levels: S1 45.69, S2 44.93, R3 44.10 (D1)

Comment: Friday's spike reversal still suggests an extreme bottom. Look for retracements over the next few days. We may yet see residual bear forces pull trade down into the spike, but suspect support will emerge at 44.93*. A close under 4493* is needed to resume washouts. Likely any congestion in the upper half of Friday's reversal will help bottom the market and lead into recovery rallies. A close over 47.47*/47.82* are bullish.

For more in depth Research & Analysis please visit FxGrow.http://fxgrow.com/analysis-educatio...cal-analysis-fxgrow-free-forex-analysis-tools

Note: This analysis is intended to provide general information and does not constitute the provision of INVESTMENT ADVICE. Investors should, before acting on this information, consider the appropriateness of this information having regard to their personal objectives, financial situation or needs. We recommend investors obtain investment advice specific to their situation before making any financial investment decision.
 
FxGrow Daily Technical Analysis – 10th May, 2017
By FxGrow Research & Analysis Team

Gold Remains Bearish With Possible Déjà vu Scenario
gold_zps5zry6yab.png


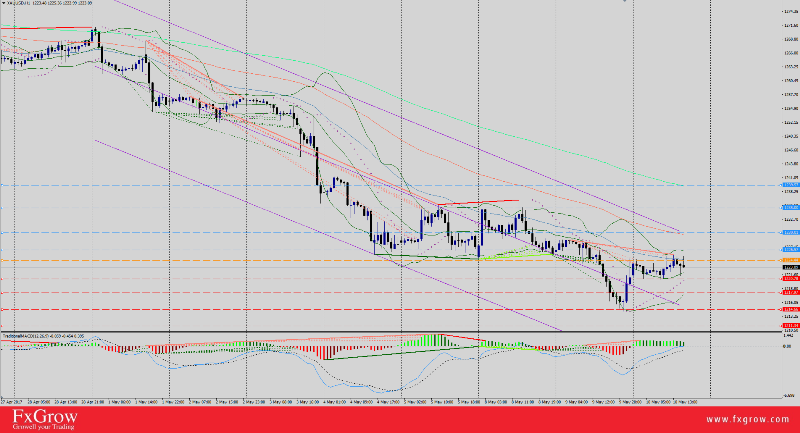
Gold was sold aggressively yesterday failing to re-bounce as the previous metal penetrated several support levels, but managed to hit a break at 1214.30 three-weeks-fresh-lows. Late at night, Trump issued an order where FBI director Comey to be resigned from his duties, as a result, U.S Dollar bullish momentum was tackled with -$0.12 gap and $99.42 closing price. XAUUSD took advantage with a short term 1225.66 correction high for today as U.S Index closed the gap with 99.51 high, forbidding gold to continue the correction mode. Currently gold trades 1222.44 intraday, slightly below its hourly pivot 1224.44 and market could witness the same scenario as yesterday, failure of support levels.

Trend: Bearish

Pivot (H1) 1224.44

Resistance levels: R1 1226.57 , R2 1230, R3 1235, R4 1239.57

Support levels: S1 1220.78, S2 1217.97, S3 1214.66, S4 1211.34

Comment: Gold Remains bearish despite today's recovery. With absence of U.S economic news, gold should trade technical. Long positions below hourly pivot 1224.44 suggests further declines stretched with yesterday's dips seeing S2&S3, but dips should hold at 1214. The other scenario, long positions above 1224.44 projects further bullish waves with R1&R2 as target. Keep an eye on U.S Index level.

For more in depth Research & Analysis please visit FxGrow.http://fxgrow.com/analysis-educatio...cal-analysis-fxgrow-free-forex-analysis-tools

Note: This analysis is intended to provide general information and does not constitute the provision of INVESTMENT ADVICE. Investors should, before acting on this information, consider the appropriateness of this information having regard to their personal objectives, financial situation or needs. We recommend investors obtain investment advice specific to their situation before making any financial investment decision.
 
FxGrow Daily Technical Analysis – 12th May, 2017
By FxGrow Research & Analysis Team

EUR/USD Stands on An Edgy Support Ahead of U.S Data
2ccv7yp.jpg


EUR/USD is showing dull behavior for the past three days finding support by local data but still pressured by recovering greenback. On Tuesday, the pair was lifted by French and Italian data with a high 1.0897 then plunged to 1.0853 low. Yesterday, the pair dipped to 1.0839 low after strong U.S data outcome and was standing on the edge of a support (S1 1.0840) where the pair signaled a potential for additional declines, but EUR/USD found a bullish hand as Trump's order (FBI Comey) events accelerated through media and interview. As a result the pair reversed losses with a 1.0893 high.

Today, EU data was neutral which postponed the trend confirmation for later coming data as U.S Releases Major events. EUR/USD traded 18-pips price action today with 1.0855 high, below 10-EMA by 27-pips.
Fundamentals:

1- USD - CPI m/m and Core CPI (Consumer Price Index) today at 12:30 PM GMT.

2- Retails Sales and Core Retails Sales today at 12:30 PM GMT.

Technical Overview:

Trend: Bullish / Sideways

Resistance levels: R1 1.0897, R2 1.0944, R3 1.1001

Support Levels: S1 1.0840, S2 1.0811, S3 1.0780

Comment: Overall, EUR/USD remains bullish, but trading close to S1 which in case of penetration, expectations for further dips towards S2 and below it, the pair alerts for trend reversal and closing below S3 is 100% confirmation for bearish momentum. Monday's reversal still favors near term corrections or congestion. Suspect a fight to bounce off 1.0840. The pair traded lower highs and higher lows between Monday and Tuesday which makes S1 a critical level.

For more in depth Research & Analysis please visit FxGrow.http://fxgrow.com/analysis-educatio...cal-analysis-fxgrow-free-forex-analysis-tools

Note: This analysis is intended to provide general information and does not constitute the provision of INVESTMENT ADVICE. Investors should, before acting on this information, consider the appropriateness of this information having regard to their personal objectives, financial situation or needs. We recommend investors obtain investment advice specific to their situation before making any financial investment decision.
 
FxGrow Daily Technical Analysis – 12th May, 2017
By FxGrow Research & Analysis Team

Gold Shows Good Stamina Ahead of U.S Data
se6dth.jpg


Gold recovered from Tuesday's 1214 low and steadied afterwards with an incline destination, maximizing profits with almost $5.50 as the precious metal clocks 1229.96 high for today's session. Yesterday, U.S Data was positive with expectation that gold will break 1214 (Tuesday low), but XAUUSD hit a strong support at 1220 with a abstention for penetration, as a result, support level was successful and gold closed at 1224.70.

Recent events shows that Trump favors lower U.S Dollar, and whenever U.S Index starts to build up, the U.S president is always there on the right time for tackling. Latest event where Trump gave Comey (FBI Deputy) one way ticket vocation had a negative impact on U.S financial market, which contributed to gold bullish forces today and yesterday.

Gold will have to submit for a final test this week as U.S releases hefty data which will re-test XAUUSD's stamina further more with expectations of heavy impact on market. In case gold followed yesterday's behavior with inability to break 1220 or Tuesday's low at 1214, indications are high that gold has finished from the decline journey and a bullish momentum is expected if XAUUSD managed to close above 1240.
Fundamentals:

1- USD - CPI m/m and Core CPI (Consumer Price Index) today at 12:30 PM GMT.

2- Retails Sales and Core Retails Sales today at 12:30 PM GMT.

Technical Overview:

Trend: Bearish Sideways

Resistance levels: R1 1230.34, R2 1235.61, R3 1228.42, R4 1242.17

Support levels: S1 1226, S2 1221, S3 1214, S4 1210.34

Comment: Gold remains bearish unless the market closes above 1240. Expectations are high that spikes would fight R1 level but in case of penetration, gold stretches for bull flags seeing R2&R3. On the other hand, yesterday gold dips were fighting S2 which indicates a strong level allied further selloffs and wash towards S3. U.S data not to be missed and keep an eye on Trump's next moves.

For more in depth Research & Analysis please visit FxGrow.http://fxgrow.com/analysis-educatio...cal-analysis-fxgrow-free-forex-analysis-tools

Note: This analysis is intended to provide general information and does not constitute the provision of INVESTMENT ADVICE. Investors should, before acting on this information, consider the appropriateness of this information having regard to their personal objectives, financial situation or needs. We recommend investors obtain investment advice specific to their situation before making any financial investment decision.
 
FxGrow Daily Technical Analysis – 15th May, 2017
By FxGrow Research & Analysis Team

EUR/USD Re-Claims 1.0900 Level Over Weaker U.S Dollar
EURUSD_zpsffwzov8f.png


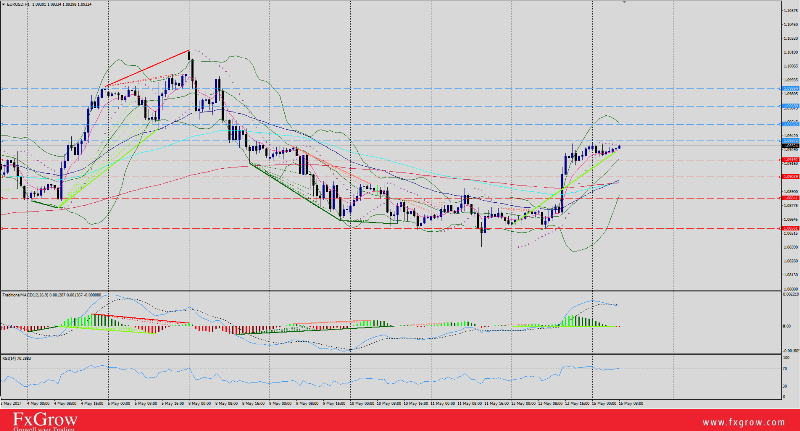
Friday, EUR/USD plunged to 1.0855 low after a neutral EU data giving room for U.S Index to climb towards 99.57 high. Later on U.S released an increased Retails Sales and CPI, not up to expectations which forced analysts to re-consider June Fed Hike odds with a probability placed at 74%, decreased by almost 10%. As a result, U.S Index took a dip and bottomed at 99.02, giving a chance for EUR/USD to reverse losses with +79-pips price action and 1.0934 high.

Monday trading session, the pair added only 1-pip since Friday's high (1.0935) with 13-pips movement, but currently U.S Index is showing weakness which should give the opportunity for EUR/USD and break another high record for today taking into consideration that U.S Administration is sending wallop signals with recent event. The pair is currently trading 1.0930 intraday, still above its 7-EMA (D1) at 1.0908.

Economic Calendar has zero value for EU and U.S Data, which leave EUR/USD action for technical as fundamentals are absent today.

Technical Overview:

Trend: Bullish Sideways

Pivot : 1.0910

Resistance levels: R1 1.0937, R2 1.0952, R3 1.0966, R4 1.0985 (H1)

Support levels: S1 1.0919, S2 1.0909, S3 1.0884, S4 1.0856 (H1)


Comment: The market still favors additional rallies for EUR/USD especially the mentioned above fundamentals on U.S Dollar. long positions above hourly pivot (1.0910) stretches bullish waves seeing R2&R3 as target. A penetration for S1 level will increase selloffs and wash towards S2 as first station, and S3 as second destination. Keep an eye on U.S Index levels.

For more in depth Research & Analysis please visit FxGrow.http://fxgrow.com/analysis-educatio...cal-analysis-fxgrow-free-forex-analysis-tools

Note: This analysis is intended to provide general information and does not constitute the provision of INVESTMENT ADVICE. Investors should, before acting on this information, consider the appropriateness of this information having regard to their personal objectives, financial situation or needs. We recommend investors obtain investment advice specific to their situation before making any financial investment decision.
 
FxGrow Daily Technical Analysis – 15th May, 2017
By FxGrow Research & Analysis Team

Gold Pushes Higher As June Fed Odds Drops Lower
2hhdf8o.jpg


Gold extended bullish momentum and added +$1.04 since Friday's high with 1232.81 for Monday's trading session. U.S Retail Sales and CPI, although was positive compared to previous sessions but not up to forecasts, lowered June Fed hike odds by 10% after being estimated at 84% which pushed XAUUSD higher.

The ascending events of North Korean launching a missile-test has contributed to gold bullish forces as the yellow metal tends to hike when political tension tightens and Trump's continuous decisions also pressured U.S Index for lower levels.

The United Nations Security Council is due to meet on Tuesday to discuss the missile launch and gold levels will await the results with possibility of additional rallies depending how the events accelerate.

U.S economic data shows absence today which leave gold to trade technically.

Technical Overview:

Trend: Bearish Sideways

Pivot: 1226.50

Resistance levels: R1 1233.20, R2 1236.89, R3 1241.17

Support levels: S1 1223.38, S2 1220.49, S3 1216

Comment: Gold is currently bullish on H1 supported by rising trend but remains bearish as general trend. Only a close above R3 level signals a trend reversal.

Long positions above pivot 1226.50 with targets at R1&R2. Long positions below pivot 1226.50, look further for S1&S2 as target.

For more in depth Research & Analysis please visit FxGrow.http://fxgrow.com/analysis-educatio...cal-analysis-fxgrow-free-forex-analysis-tools

Note: This analysis is intended to provide general information and does not constitute the provision of INVESTMENT ADVICE. Investors should, before acting on this information, consider the appropriateness of this information having regard to their personal objectives, financial situation or needs. We recommend investors obtain investment advice specific to their situation before making any financial investment decision.
 
FxGrow Daily Technical Analysis – 15th May, 2017
By FxGrow Research & Analysis Team

Aussie Marches Steadily Ahead of RBA Policy Meeting
165emp.jpg


Aussie traded Monday's session with a sharp tone facing wallowing U.S Dollar. AUD/USD over passed 10-EMA at 0.7400 as the pair peeked today to 0.7445 high with 61-pips price action. Although Chinese Data was negative earlier today which should have a negative impact on the Aussie, but collapsing U.S Dollar gave a higher push for AUD/USD, supported by a rising trend line H1 frame.

AUD/USD is currently trading 0.7419, still above above its pivot point at 0.7375 which should keep Aussie bullish forces in action and the pair could stretch additional gains technically.

As for fundamentals, Aussie awaits RBA Policy Meeting tomorrow early with expectations that the statment will be concluded with a neutral bias given last week negative Australian Data which could impact AUD/USD negatively, but still market has to watch the statement closely with expectations wide open.

Fundamentals:

AUD - RBA Monetary Policy Meeting Minutes tomorrow at 1:30 AM GMT.

USD- Building Permits tomorrow at 1:30 PM GMT.

Technical Overview:

Pivot: 0.7375

Trend: Bearish Sideways

Resistance levels: R1 0.7458, R2 0.7489, R3 0.7522, R4 0.7553 (H1)

Support levels: S1 0.7396, S2 0.7378, S3 0.7341, S4 0.7291 (H1)

Comment: Aussie remains as general trend, but AUD/USD built a promising bullish trend line with expectations for further gains taking into consideration week U.S Dollar. AUD/USD broke 0.7425 from which the pair witnessed intensive declines, and staying above it supports current bullish momentum. Closing above 0.7425 keeps bullish forces in action but be careful from setbacks due to RBA meeting content. Closing above R3 level is needed for daily trend reversal. Keep an eye on U.S Index level with correlation to U.S Data tomorrow.

For more in depth Research & Analysis please visit FxGrow.http://fxgrow.com/analysis-educatio...cal-analysis-fxgrow-free-forex-analysis-tools

Note: This analysis is intended to provide general information and does not constitute the provision of INVESTMENT ADVICE. Investors should, before acting on this information, consider the appropriateness of this information having regard to their personal objectives, financial situation or needs. We recommend investors obtain investment advice specific to their situation before making any financial investment decision.
 
FxGrow Daily Technical Analysis – 16th May, 2017
By FxGrow Research & Analysis Team


Sterling: No-Game Changer for May's Speech, Eyes on local Data
vfgx3q.jpg


GBP/USD remained neutral bias trading yesterday as PM May spoke to UK citizens, not adding much for Brexit issue but instead, a speech was given, with a mobilizing content with efforts to add more votes to her already-high polls for June's elections. Market is already expired on the fact that May is a winner and the the pair has fulfilled its purpose, as a result, Sterling remained within last week trading range, but in absence of macro events (Yesterday) responsible for GBP/USD bullish momentum, the weakness in U.S Dollar was the main pusher for the pair.

Currently, the pair is trading 1.2915 with 24-price action for Tuesday's trading sessions and 12-pips above it's 20-EMA moving average one hour time frame. The pair has a support by an increasing trend line (H1), and U.S Dollar opened Tuesday's sessions with bearish momentum as the Index dropped by 3-pips behind yesterday's low at 98.65 at the moment which should give enough room for GBP/USD to surge further more. Latest claims by U.S media suggest that Trump has leaked classified data with Russian Officials through last week meeting.

Sterling awaits major data today that hold key figures for April-2017, which in case positive, traders should expect fueling bullish rallies for GBP/USD as market tend to price the next BOE Interest Rates meeting.

Fundamentals:

1- GBP - CPI (Consumer Price Index) y/y today at 8:30 AM GMT.

2- GBP - PPI (Producer Price Index) y/y todat at 8:30 AM GMT.

3- GBP - Core CPI today at 8:30 AM GMT.

4- GBP - RPI (Retail Price Index) today at 8:30 GMT

5- USD- Building permits today at 12:30 AM GMT.

Note: Sterling data has a heavier impact, more than USD and taking into consideration that currently bad politics surrounds the White House. Traders should focus on UK data more.

Technical Overview:

Trend: Bullish / Sideways

Resistance levels: R1 1.2953, R2 1.3062, R3 1.3172

Support Levels: S1 1.2829, S2 1.2752, S3 1.2678

Comment: GBP/USD currently bullish but due to high impact data, expectations of high volatility after release. A break above R1 level supported by positive data and June coming elections as PM May heads the polls, should fuel Sterling with strong bullish waves seeing R2 level as the first destination, a weaker U.S Dollar performance could contribute to the pair additional rallies seeing R3 as next target. On the other hand, a negative data would decrease odds of BOE next rate meeting which could result in declines for GBP/USD, but dips should fight S1 level, in case of penetration, additional declines are expected with selloffs and wash towards S2&S3 level. Keep in mind that the pair is still supported by positive expectations for June elections which indicates that GBP/USD can overcome losses. closing below S3 alerts for bearish momentum. Closing above R1 is positive.

For more in depth Research & Analysis please visit FxGrow.

Note: This analysis is intended to provide general information and does not constitute the provision of INVESTMENT ADVICE. Investors should, before acting on this information, consider the appropriateness of this information having regard to their personal objectives, financial situation or needs. We recommend investors obtain investment advice specific to their situation before making any financial investment decision.
 
FxGrow Daily Technical Analysis – 16th May, 2017
By FxGrow Research & Analysis Team

EUR/USD Inclines As U.S dollar Declines, Eyes on EU GDP
2u6in7p.jpg


EUR/USD currently 1.1014, only 3-pips behind to overpass 8th of May's highs since Macron was elected with a continuous re-bounds and rejection for 20-EMA at 1.088. The pair is supported by a strong (H1) trend line and non-top higher highs indicating that the pair is marching for additional gains. There are no macro economic events supporting the rising trend which leaves EURO bullish momentum seeing weakness in U.S Dollar as the Index dipped to 98.45 low with possibilities to clock a new low for 2017.

Apparently, U.S media's accusations that Trump leaked classified data with Russian Official during last week's meeting keeps adding negative pressure on greenback along with U.S negative Empire State Manufacturing Index yesterday at -0.1 compared to 5.2 previously. Question marks surrounds U.S economy performance with mixing data released on weekly basis in addition to political rift between Republicans and Democrats keeps pushing U.S Dollar lower.

EURO awaits major data today but EU flash GDP will take center stage which will set the tone for ECB Interest Rates next meeting and in case positive, Draghi will be cornered having few options whether to increase rates to accommodate inflation figures and QE will be a greasy item on the ECB press conference. Analysts has always pointed out the Draghi favors lower EURO levels with efforts to attract investments, enhancing industrial performance which should increase exports, thus a healthier economy.

Fundamentals:

1- EUR - EU Flash GDP today at 9:00 AM GMT.

2- EUR - German ZEW Economic Sentiment today at 9:00 AM GMT.

3- EUR - Trade Balance today at 9:00 AM GMT

4- USD - Building permits today at 12:20 PM GMT.

Technical overview:

Trend: Bullish / Sideways

Resistance levels: R1 1.1041, R2 1.1081, R3 1.1138

Support levels: S1 1.0953, S2 1.0919, S3 1.0881

Comment: Current weaker U.S Dollar is giving room for EUR/USD to rally further more. EU Data will bring new inputs on how the EURO will perform for the next hours. Current weak U.S Dollar gives the chance for Building Permits today to have a higher impact as a spark. Expect setbacks from R1 level which in case penetrated, look for further bullish waves seeing R2 as a target. Dips should fight S2 and S3 levels. closing below S3 alerts for trend reversal.

For more in depth Research & Analysis please visit FxGrow.http://fxgrow.com/analysis-educatio...cal-analysis-fxgrow-free-forex-analysis-tools

Note: This analysis is intended to provide general information and does not constitute the provision of INVESTMENT ADVICE. Investors should, before acting on this information, consider the appropriateness of this information having regard to their personal objectives, financial situation or needs. We recommend investors obtain investment advice specific to their situation before making any financial investment decision.
 

Live Forex Chart

Currency
Rates
EUR / USD
1.11994
USD / JPY
158.272
GBP / USD
1.32339
USD / CHF
0.83130
USD / CAD
1.42706
EUR / JPY
177.255
AUD / USD
0.69781
Back
Top
Log in Register