BTC USD 82,022.3 Gold USD 4,147.39
Time now: Jun 1, 12:00 AM

Daily Technical Analysis by FxGrow

FxGrow Fundamental Analysis – 10th Feb, 2017
By FxGrow Investment Research Desk

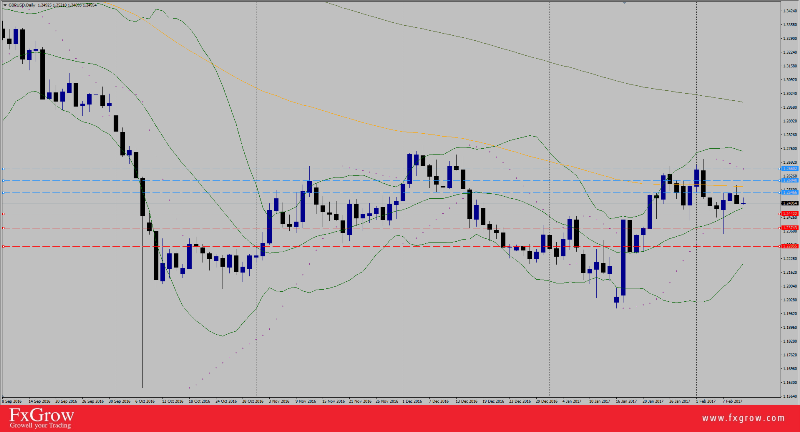
GBP/USD Levels Awaits UK Local Data
GBPUSD_zpswz1hzjhs.png


Mr. Carney crossed wires on Thursday, via Reuters, suggested that BOG should adopt the "spirit of the millennial" and embrace varied approaches to problem-solving. PM May on the other hand, won approval from parliament's lower chamber on Wednesday to trigger Britain's exit from the European Union, defeating attempts by pro-EU lawmakers to attach extra conditions to her plan to start divorce talks by March 31. The second topic that UK is facing right now is Scottish the referendum for an independence from UK which could create a constitutional crisis just as PM May seeks to negotiate the terms of the Brexit divorce with the EU's 27 other members.

Trend : Bearish Sideways

Key levels to watch : Daily Pp 1.2523

Resistance levels : R1 1.2546, R2 1.2604, R3 1.2660

Support levels : S1 1.2442, S2 1.2374, S2 1.2285

Remark : Look forward for UK manufacturing production today at 9:30 PM GMT, which will either extend the bearish trend or make a reverse depending on the data outcome. Also, USD should be taken into consideration giving that the index has recovered yesterday.

For more in depth Research & Analysis please visit FxGrow.http://fxgrow.com/analysis-educatio...cal-analysis-fxgrow-free-forex-analysis-tools

Note: This analysis is intended to provide general information and does not constitute the provision of INVESTMENT ADVICE. Investors should, before acting on this information, consider the appropriateness of this information having regard to their personal objectives, financial situation or needs. We recommend investors obtain investment advice specific to their situation before making any financial investment decision.

 
FxGrow Fundamental Analysis – 10th Feb, 2017
By FxGrow Investment Research Desk

Forex Weekly Highlights for the week, 10th Feb 2017
13-jan_zpsumhy1bhi.jpg


1- Crude oil levels dropped to the lowest during February 51.21 but managed to sustain 53 handle again.

2- Gold is bearish for the second day for the first time during February.

3- Dow Jones futures made a new record today at 20243.

4- USA president Trump and PM Japan meeting today, Friday 10th Feb, will have a major affect on markets.

5- Reserve bank of Australia RBA kept interest rates at current 1.5%.

6- Reserve Bank of New Zeland RBNZ interest rates didn't change the 1.75%.

7- Chinese Trade Balance surged 80B to previous 275B.

8- US index peeked to the highest levels during February at 100.86 and managed to reclaim the 100 level.

9- USD/JPY is bullish for the first time during February.

10- Stocks in the US traded higher than before.

11- PM May was given the authority to release article 50 for Brexit by end of march.

12- Trump and US Fed policies are on different terms.

13- US jobless claims dropped to near 43-year low.

14- European stocks are the cheapest they've been in 40 years.

15- U.S. President Donald Trump changed tack and agreed to honor the "one China" policy during a phone call with China's leader Xi Jinping. Reuters

16- OPEC is showing a rare degree of discipline in sticking to its promise to slash oil production. CNN

For more in depth Research & Analysis please visit FxGrow.http://fxgrow.com/analysis-education/fxgrow-academia/fxgrow-blog

Note: This analysis is intended to provide general information and does not constitute the provision of INVESTMENT ADVICE. Investors should, before acting on this information, consider the appropriateness of this information having regard to their personal objectives, financial situation or needs. We recommend investors obtain investment advice specific to their situation before making any financial investment decision.
 
FxGrow Fundamental Analysis – 14th Feb, 2017
By FxGrow Investment Research Desk

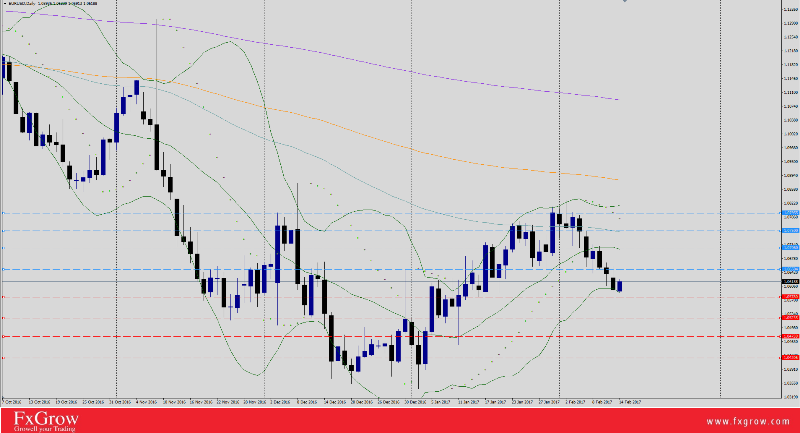
EUR/USD Revives Ahead of Local Data
EURUSD_zpsgp7wpeqy.png


EUR/USD slipped slightly below the 1.06 threshold yesterday and today, for the first time in 3 weeks pressured by strong US dollar performance. Dow Jones, S&P 500, Nasdaq, and Russel 2000 were on top performance yesterday, all pushed higher yesterday and along with it US Index scoring a 101.11 Feb-fresh-highs. EUR index was on opposite attitude, hitting 86.42 three weeks low, pulling EUR/USD behind as the pair bottomed at 1.0591 Feb-fresh-lows. Currently the cable is trading 1.0619, slightly above its Daily Pp 1.0615.

Trend : Bearish Sideways

Key levels to watch : Daily Pp 1.0615

Resistance levels : R1 1.0650, R2 1.0706, R3 1.0750, R4 1.0795

Support levels : S1 1.0578, S2 1.0523, S3 1.0475, S4 1.0420

Remark : Last week and yesterday's slip triggers further negative attitude at the pair and a warning for secondary selloffs. Stalling below 1.0600 level will send a negative shock wave which could result in further selloffs and wash towards S2&S3 levels. On the other hand, closing above R1 will fuel further attacks towards R2 level at which the cable will shift to bullish momentum. Look forward for US data today and tomorrow at 1:30 PM and Yellen speech today as it's the main key player (Fundamentals) in the market.

For more in depth Research & Analysis please visit FxGrow.http://fxgrow.com/analysis-educatio...cal-analysis-fxgrow-free-forex-analysis-tools

Note: This analysis is intended to provide general information and does not constitute the provision of INVESTMENT ADVICE. Investors should, before acting on this information, consider the appropriateness of this information having regard to their personal objectives, financial situation or needs. We recommend investors obtain investment advice specific to their situation before making any financial investment decision.
 
FxGrow Fundamental Analysis – 14th Feb, 2017
By FxGrow Investment Research Desk

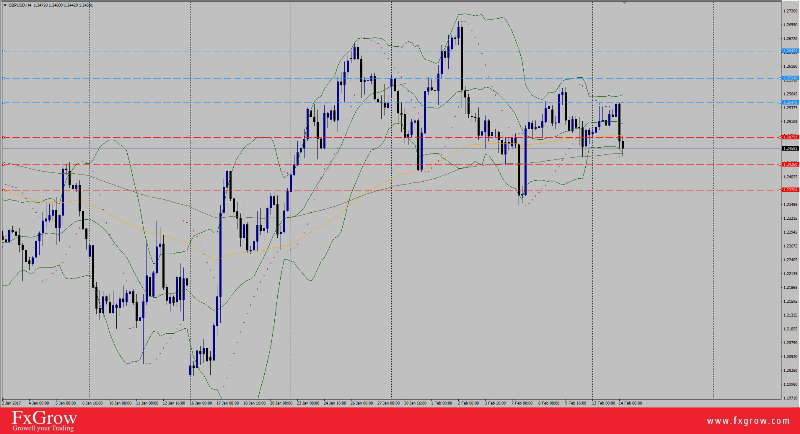
GBP/USD Confirms Bearish Momentum, US Data in Focus
GBPUSD_zps4bylf1vz.png


GBP/USD slipped the 1.2500 threshold moments ago dragged by negative UK data, not meeting expectations. Consumer Price Index CPI scored 1.8% with forecasts at 1.9%. The pair made a test at first support 1.2479 with failure, clocked a low 1.2479, supported by strong US dollar performance as the US index maintained strong levels at 100.86 intraday. The cable is set to go further test today as US released Producer Price Index at 1:30 PM GMT, shortly followed by a speech by head of US Fed at 3:00 PM GMT.

Trend : Bearish Sideways

Key levels to watch : Daily Pp 1.2512

Resistance levels : R1 1.2547, R2 1.2594, R3 1.2648

Support levels : S1 1.2479, S2 1.2426, S3 1.2376

Remark : The market remains bearish due to current strong US Dollar, but look forward for US data and Yellen Speech today as they have a huge impact on US index levels.


For more in depth Research & Analysis please visit FxGrow.http://fxgrow.com/analysis-educatio...cal-analysis-fxgrow-free-forex-analysis-tools

Note: This analysis is intended to provide general information and does not constitute the provision of INVESTMENT ADVICE. Investors should, before acting on this information, consider the appropriateness of this information having regard to their personal objectives, financial situation or needs. We recommend investors obtain investment advice specific to their situation before making any financial investment decision.
 
FxGrow Fundamental Analysis – 15th Feb, 2017
By FxGrow Investment Research Desk

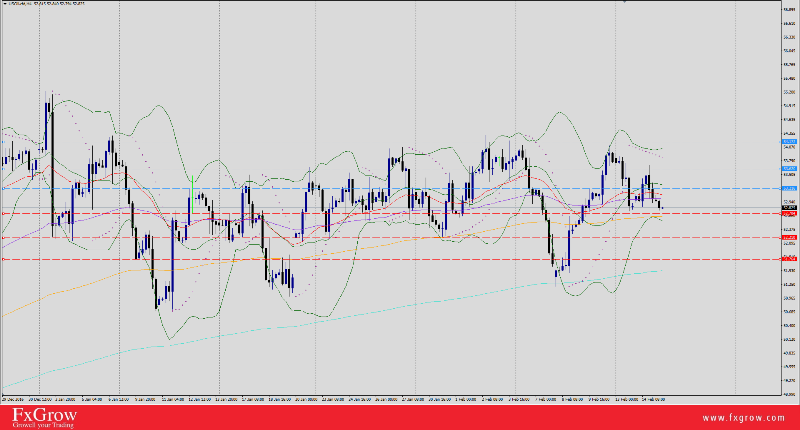
Crude Oil Slips Slightly Over OPEC Compliance Doubts
crude_zpsfu06epmz.png


1- Crude Oil Fundamentals:

Oil prices made a minor downward correction yesterday, and continued today, after concerns aroused that OPEC cartels wont be able to sustain the high compliance on the long run so far with output cuts aimed at reining in a global fuel supply overhang. OPEC and other producers, including Russia have agreed to trim output production by almost 1.8 million bpd during the first half of 2017.

BMI Research group mentioned that OPEC with its intent production cut, was down by 1.08M bpd based on calculation at 92.8%. But it warned that a much lower compliance rate of just 40 percent by Iraq, OPEC's second biggest producer, "could prove problematic to group cohesion" as other members of the producer club will have to go beyond their targets in order to meet the overall target of 1.2 million bpd in the first half of 2017. (Reuters).

On the other hand, US with constant efforts to meet OPEC end means and recompense market shortage of possible demand, has increased drilling and oil production surged 6.5% since mid-2016 at 8.98M dpd.

Conclusion: The ebb and flow continues between OPEC and USA with opposed interest on oil price levels. OPEC has managed to increase crude oil prices since end of 2016 and beginning 2017 at $55.22 high, on average 33 days at $52.57. The US efforts has only managed to curb oil price not to exceed $58-$62 as OPEC's target and analysts forecasts. Add to that, recent industrial global growth in the US, and China leaves one but only wonder how will the US play along with OPEC and the growing or increasing market demand for oil.

Remark : Look forward for US crude oil inventories today at 3:30 PM GMT as they tend to have a huge impact on oil technical levels.
2- Technical levels:

Trend: Bullish Sideways

Daily Pp : 53.22

Resistance levels : R1 53.21, R2 53.62 , R3 54.17

Support levels : S1 52.70, S2 52.21, S3 51.76

Remark : Look forward for US crude inventories today at 3:30 PM GMT. A penetration for R1 level will fuel further bullish waves towards R2 and stalling above it will confirm R3 level with success. On the other hand closing above S2 level is needed to shift trend and market will turn bearish.

For more in depth Research & Analysis please visit FxGrow.http://fxgrow.com/analysis-educatio...cal-analysis-fxgrow-free-forex-analysis-tools

Note: This analysis is intended to provide general information and does not constitute the provision of INVESTMENT ADVICE. Investors should, before acting on this information, consider the appropriateness of this information having regard to their personal objectives, financial situation or needs. We recommend investors obtain investment advice specific to their situation before making any financial investment decision.
 
FxGrow Fundamental Analysis – 15th Feb, 2017
By FxGrow Investment Research Desk

Gold Earns Further Immunity Ahead of US Data
Gold_zps89fzji4e.png


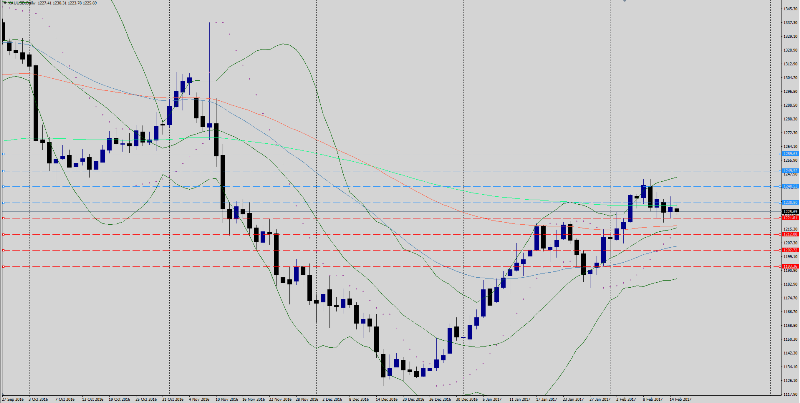
Gold has successfully sustained the 1220 threshold yesterday after positive US Producer Price Index release. The yellow metal dipped to 1221.95 low, then managed to peek again to 1231.11, currently XAUUSD trading 1226 intraday. Although US stocks are on top performance and Dow Jones pushed for a higher record today at 20550, lifting US Index today at 101.48 two-weeks-fresh-highs, gold is maintaining high levels due to US political uncertainties. Gold immunity will be subject for second test today as US releases Consumer Price Index (CPI) and Retails sales, both at 1:30 GMT. In addition to US data today, Mrs. Yellen will appear again at 3:00 PM GMT with possible repetition of yesterday's scenario about US Fed rate hikes.

Trend : Bullish Sideways

Key levels to watch : Daily Pp 1226.50

Resistance levels : R1 1230.80, R2 1240.53, R3 1249.52, R4 1259.63

Support levels : S1 1221.81, S2 1212.08, S3 1202.72, S4 1193.36

Remark : Look forward for US data today in addition to Yellen speech as they decide USD levels. A setback from R1 is an indication for additional rallies and a penetration for R1 level will fuel further demand for gold and closing above R2 levels is an alarm for R3&R4 to get ready. On the other hand, closing under S1 level will increase further selloffs and wash towards S2 then S3 level at which the metal will turn bearish.

For more in depth Research & Analysis please visit FxGrow.http://fxgrow.com/analysis-educatio...cal-analysis-fxgrow-free-forex-analysis-tools

Note: This analysis is intended to provide general information and does not constitute the provision of INVESTMENT ADVICE. Investors should, before acting on this information, consider the appropriateness of this information having regard to their personal objectives, financial situation or needs. We recommend investors obtain investment advice specific to their situation before making any financial investment decision.
 
FxGrow Fundamental Analysis – 16th Feb, 2017
By FxGrow Investment Research Desk

USD/JPY Loses Bullish Traction Ahead of further US Data
USDJPY_zpsucg1etlg.png


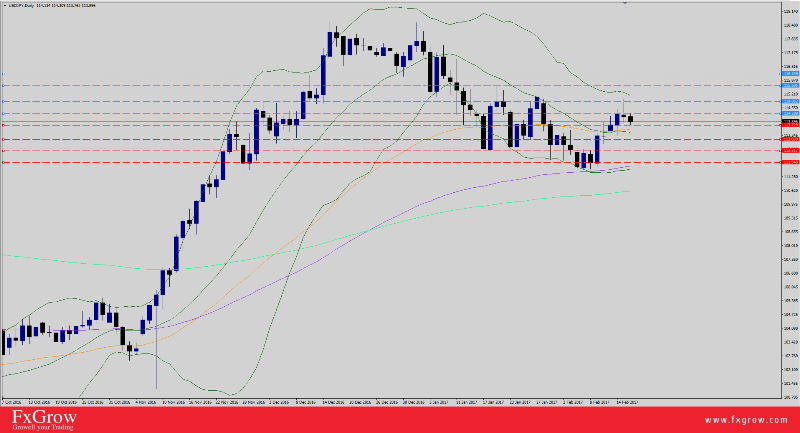
USD/JPY rallied 109 pips yesterday and clocked a high 114.95 after strong US Data released positive CPI 0.6% and Retail Sales 0.4% pushing US index at 101.75 high. The pair failed to withhold strong gains, and dipped to 113.76 low today after US index collapsed to 100.84. BOJ's Kuroda crossed wires today warning that low interest rates may sow seeds of new financial crises. He also mentioned that many central banks like BOJ, US Fed, and ECB, have adopted unconventional monetary easing steps since the global financial crisis in 2008 Facing low inflation and tepid economic growth. Currently the Pair is trading at 113.90 intraday.

USD/JPY and US index levels awaits today US economic data today with main focus on Unemployment Claims and Building Permits for US Dollars. All data are scheduled for a release at 1:30 PM GMT.

Trend : Bullish Sideways

Key levels to watch : Daily Pp 114.32

Resistance levels : R1 114.38, R2 114.86, R3 115.60, R4 116.15

Support levels : S1 113.72, S2 113.30, S3 112.51, S4 111.94

Remark : Look forward for US Data today with expectations for higher volatility shortly before and after data release. Closing below S2 levels is an indication for a reverse trend to bearish momentum. Stalling above R1 level will spark further attacks at R3 level.

For more in depth Research & Analysis please visit FxGrow.http://fxgrow.com/analysis-educatio...cal-analysis-fxgrow-free-forex-analysis-tools

Note: This analysis is intended to provide general information and does not constitute the provision of INVESTMENT ADVICE. Investors should, before acting on this information, consider the appropriateness of this information having regard to their personal objectives, financial situation or needs. We recommend investors obtain investment advice specific to their situation before making any financial investment decision.
 
FxGrow Fundamental Analysis – 16th Feb, 2017
By FxGrow Investment Research Desk

Australian Dollar touches new year highs after strong local data, US Data Eyed
AUDUSD_zpskrcofx0w.png


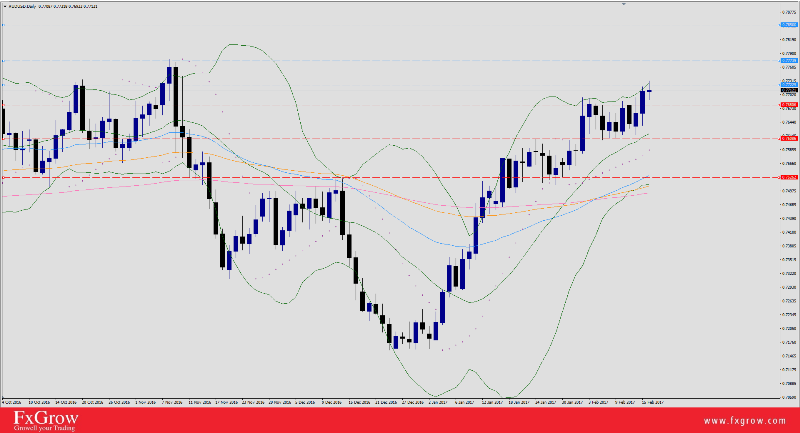
AUD/USD extended bullish momentum on Asian trading sessions taking advantage of two elements. First by positive Australian unemployment rate at 5.7%, second by collapsing US dollar as US index plunged today at 100.72 low. The pair clocked 2017-fresh-highs at 0.7731, tripped shortly with 0.7692 low and currently fighting to reclaim the 0.7700 level as the cable is trading at 0.7698 intraday. Markets are anticipating US data today with Unemployment rate and Building Permits in focus, both scheduled at 1:30 PM GMT.

Trend : Bullish Sideways

Key levels to watch : Daily Pp 0.7687

Resistance levels : R1 0.7725 , R2 0.7773, R3 0.7850

Support levels : S1 0.7680, S2 0.7608, S3 0.7526

Remark : look forward for US data release today which will bring high volatility in the market. Closing above R1 will fuel fresh buying and further attacks to R2 & R3 level. Stalling below S1 is an alarm for further selloffs and wash towards S2, then S3. Below S3 level is an indication that the pair has ended the jet ride and the momentum has turned bearish.

For more in depth Research & Analysis please visit FxGrow.http://fxgrow.com/analysis-educatio...cal-analysis-fxgrow-free-forex-analysis-tools

Note: This analysis is intended to provide general information and does not constitute the provision of INVESTMENT ADVICE. Investors should, before acting on this information, consider the appropriateness of this information having regard to their personal objectives, financial situation or needs. We recommend investors obtain investment advice specific to their situation before making any financial investment decision.
 
FxGrow Fundamental Analysis – 17th Feb, 2017
By FxGrow Investment Research Desk

Sterling Builds Expectation on Local Retail Sales
GBPUSD_zpsjc8iwshg.png


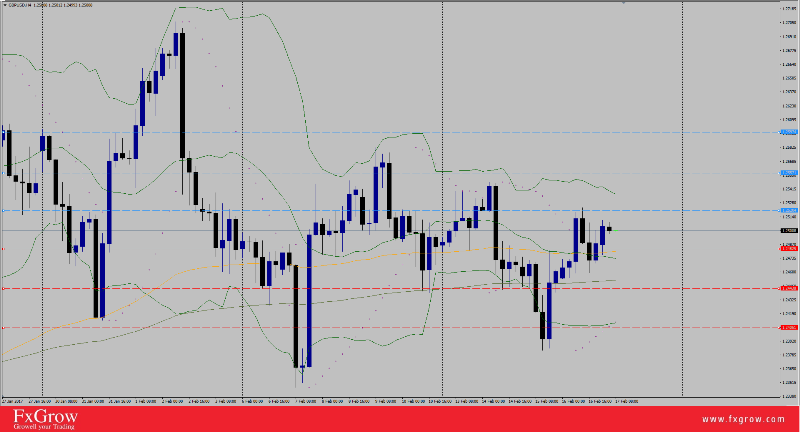
GBP/USD surges for the second consecutive trading session fueled by dipping US dollar as US Index drops to 100.40 today. As a result, the pair rallied yesterday from 1.2453, and clocked a high today at 1.2511, currently the pair is trading 1.2502, struggling to withhold the 1.2500 level.

Fundamentals : GBP awaits today local Retail Sales at 9:30 AM GMT which will either arm Sterling facing recent recovering US Dollar, or shorten GBP/USD depending on the result.

Technicals : Key levels to watch : Daily Pp 1.2489

Resistance levels : R1 1.2520, R2 1.2557, R3 1.2597

Support levels : S1 1.2482, S2 1.2483, S3 1.2405

Remark : The cable trend remains uptrend due to weaker US Dollar. The main gear for GBP/USD today is UK Retail Sales at 9:30 AM GMT. A break above R1 will spark additional attacks towards R2 level. Closing below S1 will increase further selloffs and wash towards S2 at which trend will shift bearish, then S3. Be careful from setbacks as the price tend to make a test on S and R levels.

For more in depth Research & Analysis please visit FxGrow.http://fxgrow.com/analysis-educatio...cal-analysis-fxgrow-free-forex-analysis-tools

Note: This analysis is intended to provide general information and does not constitute the provision of INVESTMENT ADVICE. Investors should, before acting on this information, consider the appropriateness of this information having regard to their personal objectives, financial situation or needs. We recommend investors obtain investment advice specific to their situation before making any financial investment decision.
 
FxGrow Fundamental Analysis – 17th Feb, 2017
By FxGrow Investment Research Desk

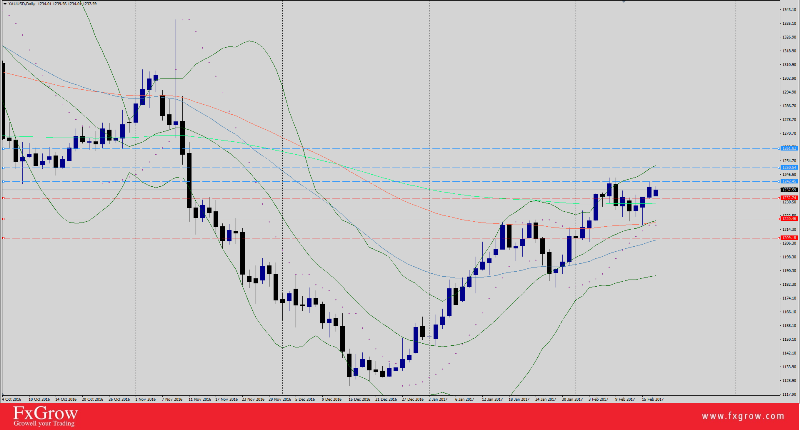
Gold Prepares For the Jet Ride
gold_zpsdysebuzq.png


Gold stands immune against US Dollar and the previous rebounds from this week lows confirms more. On Wednesday, XAUUSD dropped to 1216.80 low after strong US CPI and Retails sales were released, but managed to climb back to 1233.41. Yesterday, the yellow metal showed additional stiffness and clocked 1242.45 high despite positive and strong US data and proved to deserve the title of sacred haven metal when political uncertainties revolves globally.

Fundamentals : Gold recent psychological behavior facing USD indicates additional rallies. No Economic news on USD today.

Technical : Daily Pp 1237.97

Trend : Bullish

Resistance levels : R1 1242.45, R2 1250.54, R3 1261.82

Support levels : S1 1232.74, S2 1220.46, S3 1209.18

Remark : With absence of economic news on US Dollar, gold odds for additional hikes increase. Long positions above R1 is an alarm for secondary rallies towards R3 level. A penetration for S3 levels is needed to confirm shift to bearish trend.

For more in depth Research & Analysis please visit FxGrow.http://fxgrow.com/analysis-educatio...cal-analysis-fxgrow-free-forex-analysis-tools

Note: This analysis is intended to provide general information and does not constitute the provision of INVESTMENT ADVICE. Investors should, before acting on this information, consider the appropriateness of this information having regard to their personal objectives, financial situation or needs. We recommend investors obtain investment advice specific to their situation before making any financial investment decision.
 

Live Forex Chart

Currency
Rates
EUR / USD
1.12071
USD / JPY
158.135
GBP / USD
1.32615
USD / CHF
0.82850
USD / CAD
1.41977
EUR / JPY
177.223
AUD / USD
0.69085
Back
Top
Log in Register