BTC USD 82,134.5 Gold USD 4,174.27
Time now: Jun 1, 12:00 AM

Daily Technical Analysis by FxGrow

FxGrow Fundamental Analysis – 17th Jan, 2017
By FxGrow Investment Research Desk

EURO Levels Awaits ECB Interest Rates Decisions

ECB_zpswfvqhur7.jpg


Once again, the European Central Banks (ECB) will have the upper hand as they will decide on either to leave rates at current 0.0% or follow the path of US Fed recent 0.25% hike. The meeting is scheduled 8 times per year and this Thursday, 19 Jan, at 12:45 PM GMT. Last meeting was held on 8th of Dec 2016 and ECB decided to leave rates at 0.00%. Shortly by, Mr. Draghi held a press conference where he added that ECB will make a reduction of 20B Eur from original 80B Eur bond purchasing and market didn't digest Draghi's decision which resulted in collapsing EUR/USD levels, adding more weight on the Euro zone after going through hard Brexit.

Forecasts are to leave interest rates at current 0.00% but the devil lies in the details as Draghi will once again head a press conference shortly after ECB interest decision at 1:30 PM GMT. Draghi will have three choices.

1- Add additional cuts on 20B Euro from original 80B Eur which could depress the EURO further more.

2- Leave bond purchasing at current 60B Eur as markets are anticipating.

3- Increase the 60B Eur bond purchasing and this could restore confidence and boost EURO value.

On 19th Jan 2017, markets are expected to be highly volatile before and after the ECB min bid rate. On 8th of Dec 2016, EUR/USD levels peeked to 1.0873 high, then collapsed to 1.0597 low. Then extended bearish momentum the next day further more as the pair plunged to 1.0530. Traders can benefit from this unique event as market will be highly volatile.

Resistance levels : R1 1.0673, R2 1.0765, R3 1.0852, R4 1.0943

Support levels : S1 1.0541, S2 1.0468, S3 1.0358, S4 1.0258

For more in depth Research & Analysis please visit FxGrow.http://fxgrow.com/analysis-education/fxgrow-academia/fxgrow-blog

Note: This analysis is intended to provide general information and does not constitute the provision of INVESTMENT ADVICE. Investors should, before acting on this information, consider the appropriateness of this information having regard to their personal objectives, financial situation or needs. We recommend investors obtain investment advice specific to their situation before making any financial investment decision.
 
FxGrow Fundamental Analysis – 18th Jan, 2017
By FxGrow Investment Research Desk

Sterling: Hopes Hanging on Today's Local Data
Theresa_zpsjaj60295.jpg


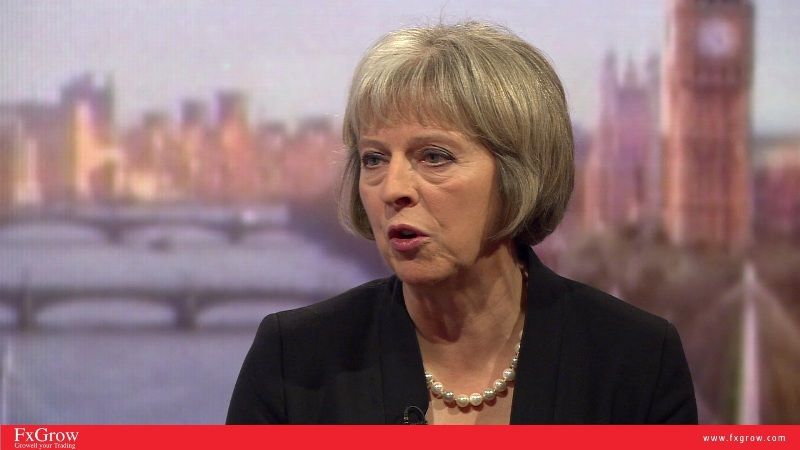
GBP/USD rallied yesterday taking advantage of weak US dollar performance despite May's speech withholding uncertainties on UK's future economy plan. US index plunged yesterday $1.38, bottomed at 100.23 9-Dec-2016 fresh lows. Even though PM May held a press conference where she discussed hard Brexit further more and tails added up with following headlines.

1- UK is leaving European Union not half in or half out, but not leaving Europe

2- UK is seeking new and equal partnership between independent self governing global Britain and friends and allies in EU.

3- May is not seeking to adopt a model already enjoyed by other countries.

4- May will make sure to put the final vote in parliament by releasing Article 50.

5- UK will adapt a new transition phase but details were not mentioned.

GBP/USD bulls yesterday were also supported by positive local CPI at 1.6% compared with 1.2% on previous sessions. Sterling also awaits today local data at 9:30 AM GMT, first Average Earning Index, second Claimant count change which will either extend the bullish momentum or the pair will drop to recent level depending on the outcome.

Remark : Keep an eye on various economic data today. A positive UK data today will initiate further bullish wave towards 1.24 & 1.25 levels for GBP/USD. On the other hand, a disappointing outcome will wash the cable towards 1.23 & 1.22 levels.

For more in depth Research & Analysis please visit FxGrow.http://fxgrow.com/analysis-education/fxgrow-academia/fxgrow-blog

Note: This analysis is intended to provide general information and does not constitute the provision of INVESTMENT ADVICE. Investors should, before acting on this information, consider the appropriateness of this information having regard to their personal objectives, financial situation or needs. We recommend investors obtain investment advice specific to their situation before making any financial investment decision.
 
FxGrow Daily Technical Analysis – 18th Jan, 2017
By FxGrow Investment Research Desk

Canadian Dollar Poised Ahead of BOC Interest Rate Decision
USDCAD_zpsnydptglu.png


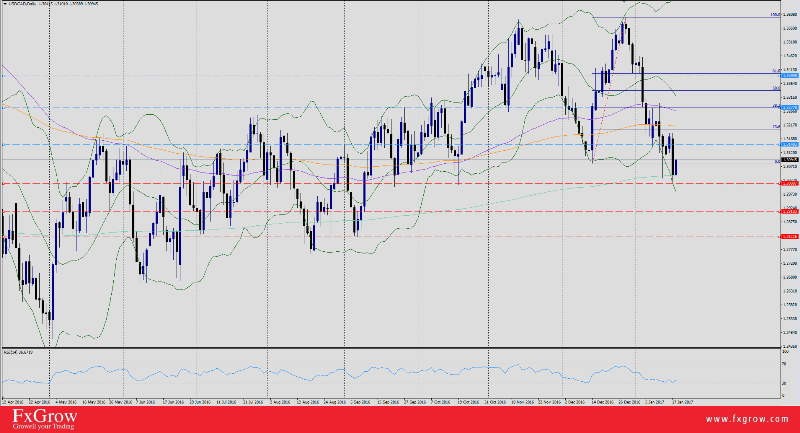
USD/CAD sank yesterday to 1.3018 20th-Oct-fresh lows following the path of retreating US dollar at 100.23 low. Today, markets are awaiting BOC interest rate decision followed by a press conference for Mr. Poloz, head of BOC. Canadian economy is on top performance recently and was considered one of top performing economies during 2016 and Inaugurated 2017 with a positive trade balance 0.5B compared to -1.0B on previous sessions in addition to positive unemployment claims.

last schedule for BOC interest rate decision was on 7th-Dec-2016, and Polo announced that it is maintaining its target for the overnight rate at 1/2 per cent. The Bank Rate is correspondingly 3/4 per cent and the deposit rate is 1/4 per cent. Forecasts for today are to leave interest rates at current 0.5% with modification on monetary policy.

Trend : Bearish Sideways

Key levels to watch:

Resistance levels : R1 1.3148, R2 1.3277, R3 1.3390

Support levels : S1 1.3009, S2 1.2910, S3 1.2822

Remark : Since market forecasts are in accord with previous interest rate results, USD/CAD will depend mostly on technical levels.

For more in depth Research & Analysis please visit FxGrow.http://fxgrow.com/analysis-educatio...cal-analysis-fxgrow-free-forex-analysis-tools

Note: This analysis is intended to provide general information and does not constitute the provision of INVESTMENT ADVICE. Investors should, before acting on this information, consider the appropriateness of this information having regard to their personal objectives, financial situation or needs. We recommend investors obtain investment advice specific to their situation before making any financial investment decision.
 
FxGrow Daily Technical Analysis – 19th Jan, 2017
By FxGrow Investment Research Desk

Gold Makes Minor Downtrend Correction, Eyes On Trump's Speech
gold_zpsc642ppwb.png


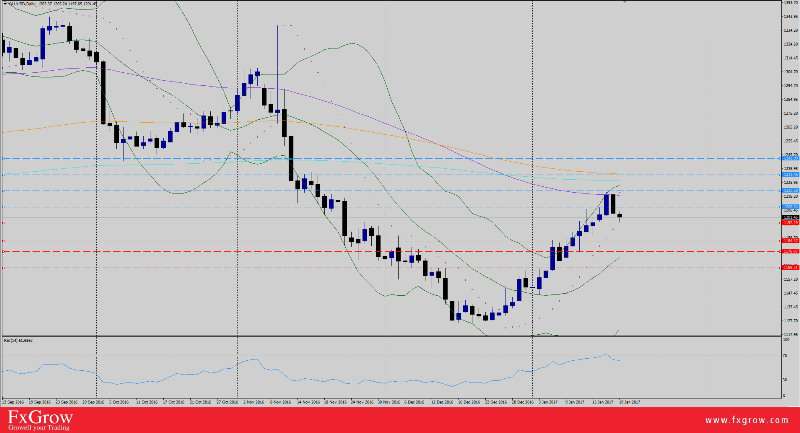
As expected, Yellen was at the right time, right place to lift collapsing US dollar this week. On Tuesday, US index bottomed at 100.23 after significant bullish opening on 2017 resulted in 103.81 peek. Yesterday, XAUUSD clocked a high 1217.71 after PM May's final determination for a divorce from EU, but Gold couldn't withhold high levels, at 7 PM GMT, an hour before Yellen's appearance, gold levels started shaking downward, and Yellen contributed further more through her speech where she laid out that US economy is positively stable it's up to Fed's objectives. As a result the sacred yellow metal extended bear forces and sank to 1197.65 low. Gold levels still have two articular stations where final price destination will be determined. First, US data today scheduled at 1:30 PM GMT. Second tomorrow's global anticipated Trump speech and analysts are in confusion whether Trump will make an attack on US local sector as he did previously with pharmaceutical companies causing USD to collapse, or he will address US citizens with patriotic speech that could result in energizing USD.

Trend : Bullish Sideways

Key levels to watch : Daily Pp 1209.70

Resistance levels : R1 1208.34, R2 1220.20, R3 1231.45, R4 1242.99

Support levels : S1 1197.29, S2 1184.37, R3 1176.87, R4 1165.21

Remark : The fundamentals for Gold levels are tied with today's US data at 1:30 PM but the main focus is on Trump's speech tomorrow. As for technical levels, a penetration for R2 strong level will fuel further bullish waves towards R3 & R4. Closing below S1 will favor selloffs and wash towards S3 level.

For more in depth Research & Analysis please visit FxGrow.http://fxgrow.com/analysis-educatio...cal-analysis-fxgrow-free-forex-analysis-tools

Note: This analysis is intended to provide general information and does not constitute the provision of INVESTMENT ADVICE. Investors should, before acting on this information, consider the appropriateness of this information having regard to their personal objectives, financial situation or needs. We recommend investors obtain investment advice specific to their situation before making any financial investment decision.
 
FxGrow Daily Technical Analysis – 19th Jan, 2017
By FxGrow Investment Research Desk

Crude Oil Levels Between OPEC-Compliance and US Inventories Today
crude_zpsurhibxmc.png


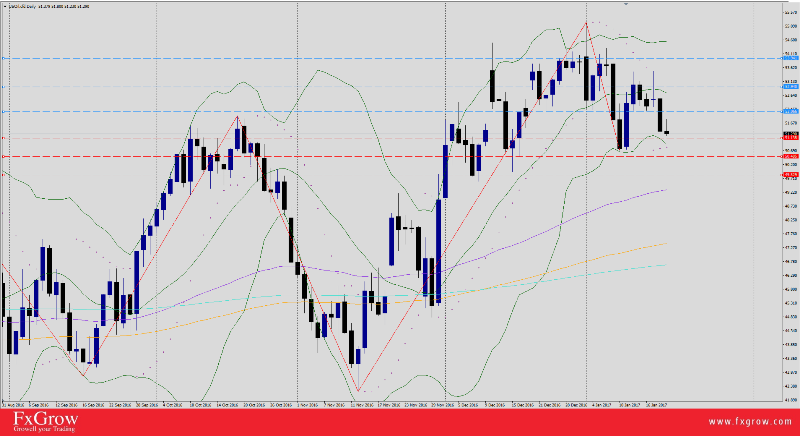
Oil prices are ebb and flow between OPEC-compliance efforts to curb market surplus and US consecutive additional drilling to glut the market.

For the first time in 15 years, beginning of Jan, OPEC and several producers settled last year to cut supply which boosted oil levels to spike at 55.22 from a 27$ a year ago. The key here was how far will this agreement last and the commitment of respecting agreed share-quotas. On 2017, hints were sent that some countries are not respecting the settlement signs of cheating were fed to markets which caused oil bulls to take a breath, and slow the hike pace. In Nov-2017, OPEC made the final touches on the plan to cut its output around 1.20 MB per day to 32.50M. Russia, combined with other non-members pledged curbs around 560,000 bpd in Dec.

The biggest reduction came from Saudi Arabia, which told OPEC it cut output to 10.47 million bpd. Losses in Nigeria, which is exempt from cutting output because its production has been curbed by conflict, provided the second largest reduction.

The OPEC figures published on Wednesday showed the group pumped 33.085 million bpd last month, according to figures OPEC collects from secondary sources, down 221,000 bpd from November. According to Reuters. In short words, OPEC deal is falling into puzzles but perhaps on slow pace but the target will be achieved supported by analysts due to a significant increase in energy sectors specially china.

Oil levels are heading to $60 by mid 2017 according to Tarek Fadlallah, Nomura Middle East chief executive officer, as he discusses the outlook for the U.S. dollar and oil prices with Bloomberg's Shery Ahn and Yousef Gamal El-Din on "Bloomberg Markets: Middle East." (Source: Bloomberg).

In conclusion, oil prices declined as US decided to increase its stockpiles although some OPEC countries reduces production. OPEC and US are on opposite target terms since OPEC has the benefit of higher oil prices considering it's their main source of economy wealth and US is the largest energy consumer sector. Therefore a global supply glut remains a big concern awaiting further deals from OPEC members.

Markets are always on a weekly report with US crude inventories, today at 4 PM GMT, with further efforts to affect oil levels. On the other hand, China also plays a big role on oil demand knowing that it is the second largest consumer thus slower demand might be a result of weaker economy.

Remark : Look forward for US inventories today, a positive data will help oil prices to collapse to S1 51.13, S2 50.48, S3 49.82. The other scenario, in case of negative inventories not meeting forecasts, markets to expect bullish wave powered by disappointment and OPEC efforts towards R1 52.06, R2 52.94, R3 53.94.

For more in depth Research & Analysis please visit FxGrow.http://fxgrow.com/analysis-educatio...cal-analysis-fxgrow-free-forex-analysis-tools

Note: This analysis is intended to provide general information and does not constitute the provision of INVESTMENT ADVICE. Investors should, before acting on this information, consider the appropriateness of this information having regard to their personal objectives, financial situation or needs. We recommend investors obtain investment advice specific to their situation before making any financial investment decision.
 
FxGrow Fundamental Analysis – 20th Jan, 2017
By FxGrow Investment Research Desk

Market Volatility Pledged on Trump's Speech

Talk of the week, Trump's receiving the US presidential ribbon and how the market will react on his speech. But before that, let's go back in time and put puzzle pieces to one place to draw a clearer picture.

1- First on 3rd of Dec, US index rallied significantly ceiling 103.81 2003-fresh-highs, showing how strong USD is but the pace is critical. The next day, Wednesday the 4th, US index was on a date with FOMC meeting which resulted with briefing that US index is relatively high. Also, it could lead to inflation which is a nightmare for central banks. As a result, US index took a dip to 101.30.

2- This week, market awaited 2 speeches for Mrs. Yellen, head of US FED. First meeting was on Wednesday where Yellen boosted collapsing US index by positive speech, lifted US index to 101.33 high and the daily pivot was 100.88. The second speech was today early morning which didn't introduce new perspective for USD, and US index clocked a low 100.83. US index has a strong support level at 100.80. Now if we compare the three numbers, we can conclude that at these levels, the US Fed is satisfied and it's meeting their objectives.

Now comes today's long waited event, Trump's speech. There are three scenarios that can cross minds.

1- Trump, as his previous behavior, will make an attack on US local sectors resulting in US stocks collapse as well for US index.

2- Trump will make a speech matching the prestige of US presidency. A patriotic speech where he'll address US citizens with promise of good and strong economy that will result in energizing USD levels.

3- The event itself, a new president taking the lead despite the content of the speech will also send an optimistic wave through the US market that will boost USD.

In conclusion, whether Trump and Yellen are on the same page or not. Collapsing or bullish US index, the FOMC or Yellen will always try to make keep US index in the above mentioned levels where its meeting their inflation target.

Remark : This is a theory based on fundamental and technical analysis.

For more in depth Research & Analysis please visit FxGrow.http://fxgrow.com/analysis-education/fxgrow-academia/fxgrow-blog

Note: This analysis is intended to provide general information and does not constitute the provision of INVESTMENT ADVICE. Investors should, before acting on this information, consider the appropriateness of this information having regard to their personal objectives, financial situation or needs. We recommend investors obtain investment advice specific to their situation before making any financial investment decision.
 
FxGrow Fundamental Analysis – 23rd Jan, 2017
By FxGrow Investment Research Desk

EUR/USD Surges Ahead of Draghi's Speech
EURUSD_zpssfskwynv.png


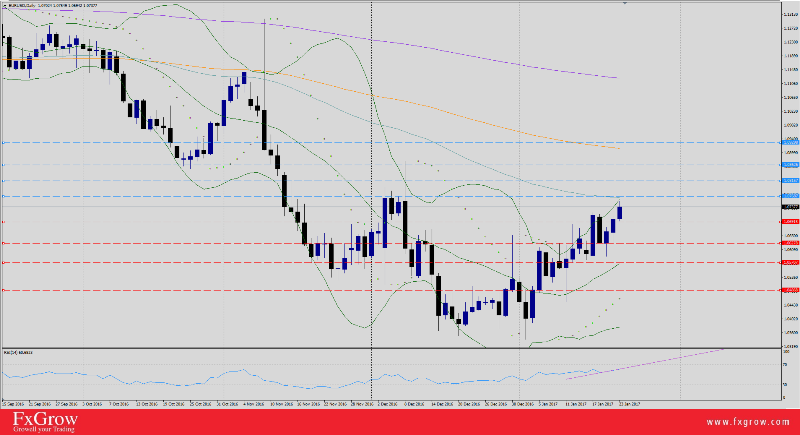
After ECB unchanged rate decision at 0.00% followed by a press conference by Mr. Draghi with a positive tone on EU, EUR/USD rallied to 1.0676 high. The pair extended bullish momentum after Trump's protectionist speech on Friday and clocked 1.0754 today followed by collapsing US index that bottomed today at 100.17 2017-fresh lows. Today, 11:30 PM GMT, Draghi will make a reappearance with a press conference to discuss EU zone further more. Also, tomorrow at 9:30 AM GMT, the final decision on EU court ruling and the release of article 50 will have an impact on EUR/USD levels.

Trend : bullish Sideways

Key levels to watch : Daily Pp 1.0708

Resistance levels : R1 1.0768, R2 1.0815, R3 1.0862, R4 1.0929

Support levels : S1 1.0691, S2 1.0627, S3 1.0570, S4 1.0486

Remark : Look forward for Draghi's speech today and the release of article 50 tomorrow which will impact EUR/USD levels.

For more in depth Research & Analysis please visit FxGrow.http://fxgrow.com/analysis-education/fxgrow-academia/fxgrow-blog

Note: This analysis is intended to provide general information and does not constitute the provision of INVESTMENT ADVICE. Investors should, before acting on this information, consider the appropriateness of this information having regard to their personal objectives, financial situation or needs. We recommend investors obtain investment advice specific to their situation before making any financial investment decision.
 
FxGrow Fundamental Analysis – 24th Jan, 2017
By FxGrow Investment Research Desk

Sterling Depresses Ahead of Article 50 Release
GBPUSD_zpsy2pivs9n.png


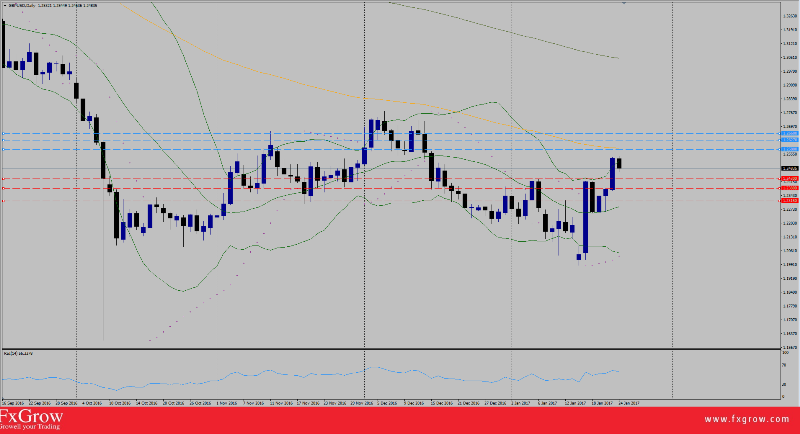
GBP/USD levels are awaiting the final decision for UK's court ruling for the release of article 50 with final stages for eternal break from the EU. But the question is, will UK take soft or hard Brexit road ? A hard Brexit arrangement would likely see the UK give up full access to the single market and full access of the customs union along with the EU. On the other hand, soft Brexit means UK would no longer be a member of the EU and would not have a seat on the European Council. It would lose its MEPs and its European Commissioner. But, it would keep unfettered access to the European single market.

Trend : Bullish Sideways

Resistance levels : R1 1.2580, R2 1.2627, R3 1.2660

Support levels : S1 1.2430, S2 1.2384, S3 1.2315

Remark : Although signs are in favor for UK's final break from EU, but there are no clear signs on the method or which model they will adapt.

For more in depth Research & Analysis please visit FxGrow.http://fxgrow.com/analysis-education/fxgrow-academia/fxgrow-blog

Note: This analysis is intended to provide general information and does not constitute the provision of INVESTMENT ADVICE. Investors should, before acting on this information, consider the appropriateness of this information having regard to their personal objectives, financial situation or needs. We recommend investors obtain investment advice specific to their situation before making any financial investment decision.
 
FxGrow Fundamental Analysis – 25th Jan, 2017
By FxGrow Investment Research Desk

Crude Oil Rallies Over Hints of Major Participation on Cut Reductions
3478idd.jpg


OPEC efforts to curb oil gluts has been fruitful as Iraq's oil minister Al-Luaibi assured on Monday that most oil majors working on its territory were participating in oil output reductions agreed as part of the deal between OPEC and non-OPEC producers to help to balance the market.

Iraqi oil minister Jabar al-Luaibi said pledged to deliver Iraq's quota of agreed oil reduction, the country had cut output from its "national fields" and those of international oil companies (IOCs) working in Iraq were also participating.

Al-Luaibi quoted "We are in collaboration with IOCs to cut from their part," he told Reuters on the sidelines of a conference. "We are in agreement with most IOCs, not all of them, that they will be in line with us. This is going well."

He also added " "It is heading toward $60 now. We hope it will get to the level of $60 and $60-$65 will be reachable." Reuters.

According to Bloomberg, OPEC are doing pretty well although it's not 100% yet, but by end of Feb, 100% compliance will be achieved. right now, OPEC managed to cut 1.5M bpd and the target is to reach 1.8M bpd. Saudi Arabia are pumping less than 10M bpd. Russia will also decrease up to 300,000 bpd by end of April or May.

Also, OPEC is to set a committee which will monitor exports, secondary sources, count tankers, talk to sources, and develop their own mechanism to look into estimates on how countries are producing and make sure they are all in accord.

On the other hand, US will publish today Crude Oil Inventories at 3:30 PM GMT, with efforts to slow bullish oil pace. USA are on opposite end means with OPEC, with consecutive additional drilling and forecasts are at 1.5M barrel compared to 2.3M in previous sessions.

Resistance levels : R1 53.33, R2 54.19, R3 55.28

Support levels : S1 52.52, S2 51.71, S3 50.92

Remark : Look forward for US inventories today at 3:30 PM GMT, also keep posted on OPEC's news and meeting, these are the two main fundamentals for crude oil levels for the coming days. As for technical, long positions below S1 will increase additional selloffs and wash towards S2&S3 levels. On the other hand a close above R1 level indicates that oil trend has shifted bullish and stalling above R2 will fuel bullish waves towards R3.

For more in depth Research & Analysis please visit FxGrow.http://fxgrow.com/analysis-education/fxgrow-academia/fxgrow-blog

Note: This analysis is intended to provide general information and does not constitute the provision of INVESTMENT ADVICE. Investors should, before acting on this information, consider the appropriateness of this information having regard to their personal objectives, financial situation or needs. We recommend investors obtain investment advice specific to their situation before making any financial investment decision.
 
FxGrow Fundamental Analysis – 26th Jan, 2017
By FxGrow Investment Research Desk

Gold Volatility Pledged On US Data
Gold_zpstrpnfzy6.png


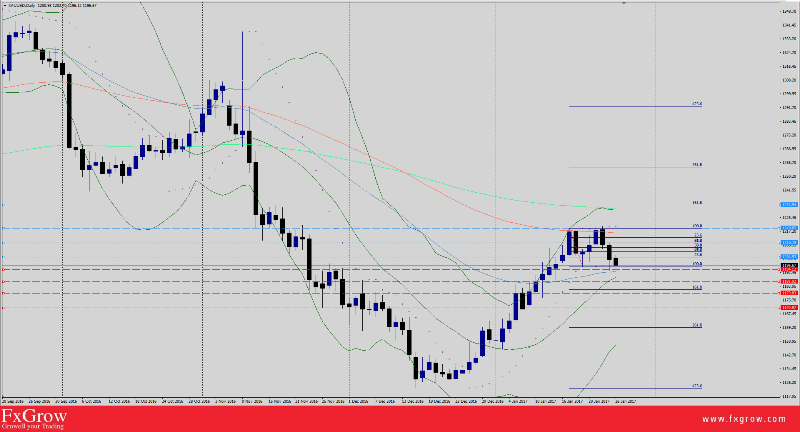
XAUUSD witnessed a significant volatility through the week but currently gold prices are stable at 1196.33 intraday, and it's expected to continue ahead of upcoming US data. Gold took advantage of collapsing US index first on Tuesday at 99.89, extending bearish momentum today hitting rock bottom 9-Dec-fresh-lows at 99.77. As a result, the yellow metal was on roller coaster between 1220.10 high on Tuesday, and 1191.17 low yesterday. Markets are expecting gold prices to stabilize today, but volatility will kick in ahead and after the release of major economic US data today and tomorrow, both at 1:30 PM GMT.

1- Today, US unemployment claims to be released at 1:30 PM GMT.

2- Tomorrow, The US Advance GDP release is the earliest and thus tends to have the most impact. Second US Core Durable Goods. Both data at released at 1:30 PM GMT.

Trend : Bullish Sideways

Key levels to watch : Daily Pp 1198.33

Resistance levels : R1 1203.37, R2 1209.71, R3 1218.16, R4 1232.94

Support levels : S1 1194.12, S2 1186.92, S3 1179.83, S3 1170.97

Remark : Look forward for US data release today and tomorrow as they affect XAUUSD levels significantly with Advanced GDP in focus. Below S2 level the cable to be considered Bearish. Long positions above R1 level comes in favor of additional bullish waves attack towards above resistance levels. A close below S2 level will increase further selloffs and wash towards S3&S4 levels. Be careful from testing on both support and resistance levels as a setback.

For more in depth Research & Analysis please visit FxGrow.http://fxgrow.com/analysis-education/fxgrow-academia/fxgrow-blog

Note: This analysis is intended to provide general information and does not constitute the provision of INVESTMENT ADVICE. Investors should, before acting on this information, consider the appropriateness of this information having regard to their personal objectives, financial situation or needs. We recommend investors obtain investment advice specific to their situation before making any financial investment decision.
 

Live Forex Chart

Currency
Rates
EUR / USD
1.12583
USD / JPY
157.910
GBP / USD
1.33338
USD / CHF
0.82290
USD / CAD
1.41527
EUR / JPY
177.781
AUD / USD
0.69602
Back
Top
Log in Register