BTC USD 81,943.9 Gold USD 4,166.74
Time now: Jun 1, 12:00 AM

Daily Technical Analysis by FxGrow

FxGrow Daily Technical Analysis – 21st Dec, 2016
By FxGrow Research & Analysis Team

Trade on US GDP, Technical Levels to Watch

22-dec_zpshhy58l6j.jpg


Gross Domestic Product, It's the broadest measure of economic activity and the primary gauge of the economy's health. The United States is the world's largest national economy in nominal terms and second largest according to purchasing power parity (PPP), representing 22% of nominal global GDP and 17% of gross world product (GWP). Giving that US dollar is strongest and most traded currency globally, the US GDP released data will have a huge impact on US dollar strength and US economy. A positive outcome means additional stamina to a currently-strong-USD, which means weakening other currencies and the opposite could be said. US GDP is scheduled on 22 of Dec at 1:30 PM GMT.

EUR/USD Technical levels to watch:

Weekly Pp 1.0496

Resistance levels : R1 1.0465, R2 1.0526, R3 1.0580, R4 1.0657

Support levels : S1 1.0350, S2 1.0285, S3 1.0163, S4 1.0120

GBP/USD technical levels to watch :

Weekly Pp 1.2535

Resistance levels : R1 1.2410, R2 1.2463, R3 1.2502, R4 1.2558

Support levels : S1 1.2320, S2 1.2259, S3 1.2197 , 1.2149

USD/JPY technical levels to watch :

Weekly Pp 117.12

Resistance levels : R1 118.64, R2 119.17, R3 119.69, R4 120.26

Support levels : S1 117.14, S2 116.46, S3 115.85, S4 115.24

AUD/USD technical levels to watch :

Weekly Pp 0.7364

Resistance levels : R1 0.7285 , R2 0.7323, R3 0.7366, .7412

Support levels : S1 0.7223 , S2 0.7186, s3 0.7152, S4 0.7111

Gold technical levels to watch :

Resistance levels : R1 1142.35, R2 1152.03, R3 1163.85, R4 1176.75

Support levels : S1 1125.61, S2 1116.02, S3 1107.96, S4 1102.05

For more in depth Research & Analysis please visit FxGrow.http://fxgrow.com/analysis-educatio...cal-analysis-fxgrow-free-forex-analysis-tools

Note: This analysis is intended to provide general information and does not constitute the provision of INVESTMENT ADVICE. Investors should, before acting on this information, consider the appropriateness of this information having regard to their personal objectives, financial situation or needs. We recommend investors obtain investment advice specific to their situation before making any financial investment decision.
 
FxGrow Daily Technical Analysis – 21st Dec, 2016
By FxGrow Research & Analysis Team

Oil Price Inches Higher after API Report, US Inventories in Sight
spw0pf.jpg


Oil prices, on both sides of the Atlantic surged during weekly trading sessions. On Monday oil clocked a 51.49 low, but managed to get fresh traction exceeding 53 level, after after the American Petroleum Institute’s (API) weekly report showed a larger than expected draw of 4.15 million barrels to the United States’ commercial crude inventories, instead of an expected 2.5 million-barrel draw.

On Tuesday, president Obama moved to indefinitely block drilling in vast swaths of U.S. waters. Obama had been expected to take the action by invoking a provision in a 1953 law that governs offshore leases. The law allows a president to withdraw any currently un-leased lands in the Outer Continental Shelf from future lease sales. There is no provision in the law that allows the executive's successor to repeal the decision, so President-elect Donald Trump would not be able to easily brush aside the action. Trump has vowed to open more federal land to oil and natural gas production in a bid to boost U.S. output. Obama on Tuesday said he would designate "the bulk of our Arctic water and certain areas in the Atlantic Ocean as indefinitely off limits to future oil and gas leasing, though the prospects for drilling in the affected areas in the near future were already questionable. This could create an issue for US oil drilling and supply inventories.

Oil prices clocked a 53.75 on Tuesday, closing to last week highs 54.49 as OPEC put final touches on the so long anticipated deal or no deal that markets were awaiting. With absence of fundamentals that could spark additional factors for driving prices, support and resistance could be the elemental factor today. Also US crude inventories scheduled for a release today at 3:30 PM GMT will give a better outlook on how traders will react to the news.

Key levels to watch : Weekly Pp 52.12

Trend : Bullish Sideways

Resistance levels : R1 53.87, R2 54.72, R3 55.92

Support levels : S1 53.11, S2 52.28, S3 51.45

Remark : look forward for US crude inventories today which will drive the market. A break above R2 level is an alarm for R3 to get ready. S3 is a hard level, any below penetration will cause further selloffs and additional downtrend.

For more in depth Research & Analysis please visit FxGrow.http://fxgrow.com/analysis-educatio...cal-analysis-fxgrow-free-forex-analysis-tools

Note: This analysis is intended to provide general information and does not constitute the provision of INVESTMENT ADVICE. Investors should, before acting on this information, consider the appropriateness of this information having regard to their personal objectives, financial situation or needs. We recommend investors obtain investment advice specific to their situation before making any financial investment decision.
 
FxGrow Daily Technical Analysis – 22nd Dec, 2016
By FxGrow Research & Analysis Team

USD/CAD Sinks on Crude Oil Uncertainties, Awaiting Local Data
USDCAD22_zpsbgrpwmsf.png


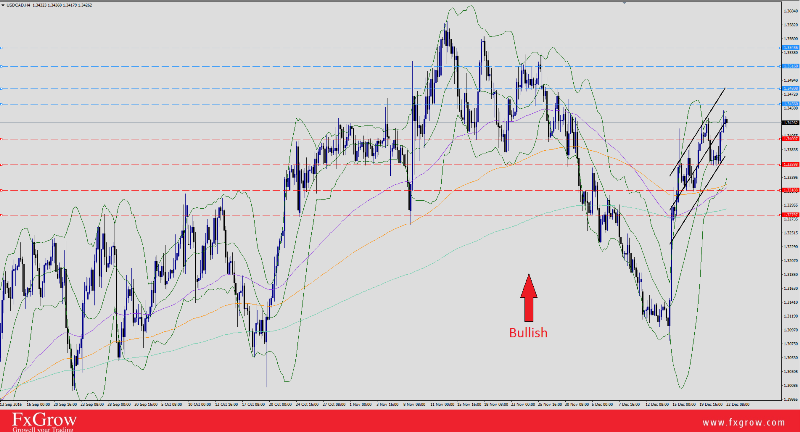
USD/CAD is bullish for the 7th consecutive session after a remarkable dip-phase the pair witnessed last week. On Dec 14th, USD/CAD dropped to 1.3080, 20-Oct-fresh-low, taking advantage of local Canadian positive data, and oil prices peeking to 54.49 as OPEC put final touch on December the 10th for the so long waited deal to cut oil surplus in markets. The loonie had a short moment of strength to enjoy as FOMC meeting concluded with a hike of 0.25% to initial 0.50% bid rate which energized US dollar index to peek to 103.56 2003-fresh-high.

USD/CAD rallied today clocking 1.3446 high in today opening trading sessions following the path of stronger US dollar, then the collapsed crude oil prices added it's additional negative-weigh on Canadian economy which is considered top oil producer. Today, Canadian dollar awaits CPI and retail sales report, on the other hand USD is focused mainly on US GDP report, both scheduled at 1:30 PM GMT.

Trend : Bullish

Key levels to watch: weekly Pp 1.2378

Resistance levels : R1 1.3456, R2 1.3480, R3 1.3516, R4 1.3545

Support levels : S1 1.3400, S2 1.3359, S3 1.3318, S4 1.3279

Remark : Look forward for economic data today both on behalf of Canada and U.S which will determine how the market will react to the published news. A break with long position above R2 is a spark for additional R3 level. However, S1 is a hard psychological level for the pair and a close below S2 is needed for the cable to be considered bearish.

For more in depth Research & Analysis please visit FxGrow.http://fxgrow.com/analysis-educatio...cal-analysis-fxgrow-free-forex-analysis-tools

Note: This analysis is intended to provide general information and does not constitute the provision of INVESTMENT ADVICE. Investors should, before acting on this information, consider the appropriateness of this information having regard to their personal objectives, financial situation or needs. We recommend investors obtain investment advice specific to their situation before making any financial investment decision.
 
FxGrow Daily Technical Analysis – 22nd Dec, 2016
By FxGrow Research & Analysis Team

Gold Prices In Confusion Ahead of US GDP
Gold22_zps54sa8wjn.png


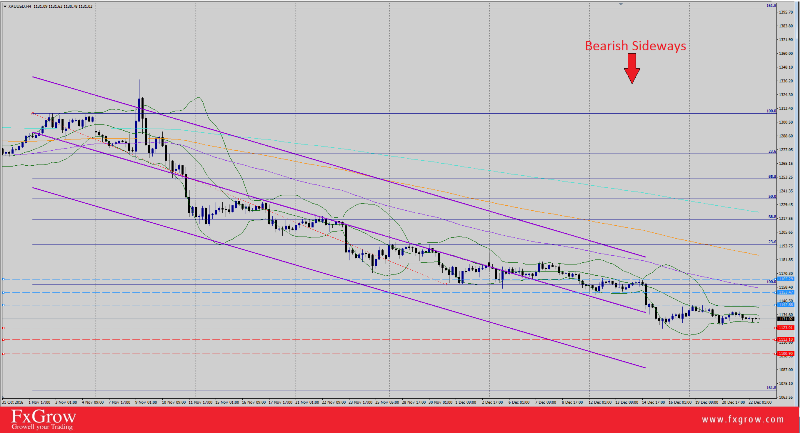
XAUUSD prices on swing since last week between 1144.48 high and 1122.73 low. First gold prices collapsed on Fed rate hike 0.25%, second US economy received additional boost by positive Philly index 21.5 compared with 7.6 in previous session, causing a heavy selloffs for the precious metals. US dollar responded splendidly as the Index peeked to 103.62, 2003-fresh-highs, causing the yellow metal to extend its downward movement, sinking to 2016-Feb-fresh-lows at 1122.73. Gold levels will be tested today further more as US releases local GDP scheduled at 1:30 PM GMT.

Gold is currently trading at 1131.30 intraday, below weekly Pp at 1141.07.

Trend: Bearish Sideways

Resistance levels : R1 1142.88, R2 1153.47, R3 1165.29

Support Levels : S1 1123.10, S2 1113.10, S3 1100.90

Remark : Price range between S1 and R1 but look forward for wider range as the market is poised awaiting US GDP. Long positions below S1 with targets S2, & S3. However, a break R2 will boost additional increase towards R3 level on which XAUUD will be considered as bullish trend.

For more in depth Research & Analysis please visit FxGrow.http://fxgrow.com/analysis-educatio...cal-analysis-fxgrow-free-forex-analysis-tools

Note: This analysis is intended to provide general information and does not constitute the provision of INVESTMENT ADVICE. Investors should, before acting on this information, consider the appropriateness of this information having regard to their personal objectives, financial situation or needs. We recommend investors obtain investment advice specific to their situation before making any financial investment decision.
 
FxGrow Daily Technical Analysis – 23rd Dec, 2016
By FxGrow Research & Analysis Team

GBP/USD Diggs Deeper Ahead of UK Local Data
GBPUSD23_zpsucdvunwl.png


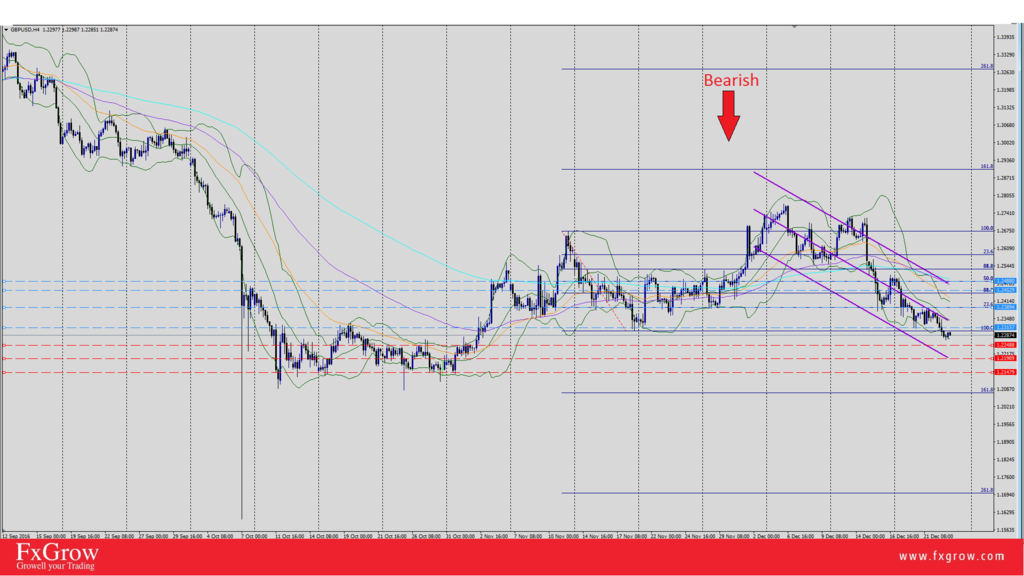
Sterling extends bearish momentum for the 5th consecutive session and every time the GBP/USD shows signs of recovery, the pair re-collapses again, seems to be stuck below 1.25 level. The pair dropped yesterday from 1.2378, hitting 3-Nov-fresh-lows at 1.2277. The GBPUSD seems to have immunity when it comes to holding strong gains or maintaining bull candles over the past days as the pair dug deeper in today's trading sessions hitting 1.2270 low, currently trading 1.2290 intraday.

The fundamentals that are responsible for GBP/USD bears are:

1- Fed Rate hike at 0.75% end result which is still boosting US economy till now.

2- Negative consumer confidence in UK yesterday scoring -7 compared to -8 earlier.

3- Strong US Dollar as the index, hitting 2003-fresh-highs 103.63, currently 102.97 intraday.

4- Lack of confidence for GBP.

5- Positive US GDP yesterday at 3.5% compared to 3.2% previously.

Today, Sterling awaits local economic news scheduled for a release at 9:30 AM GMT which should impact GBP/USD trend for the coming hours.

Trend : Bearish

Resistance levels : R1 1.2315, R2 1.2389, R3 1.2452

Support levels : S1 1.2248, S2 1.2198, S3 1.2147

Remark : The market remains bearish and negative towards GBP/USD which signals for further selloffs and a break below S1 is an indication for lower hole. On the other hand, long positions above R2 level is needed for spark bulls candles and above R3, the pair will wash the bearish trend.

For more in depth Research & Analysis please visit FxGrow.http://fxgrow.com/analysis-educatio...cal-analysis-fxgrow-free-forex-analysis-tools

Note: This analysis is intended to provide general information and does not constitute the provision of INVESTMENT ADVICE. Investors should, before acting on this information, consider the appropriateness of this information having regard to their personal objectives, financial situation or needs. We recommend investors obtain investment advice specific to their situation before making any financial investment decision.
 
FxGrow Daily Technical Analysis – 03rd Jan, 2017
By FxGrow Research & Analysis Team

STERLING BOOSTS ON POSITIVE LOCAL PMI, AWAITING US DATA
GBPUSD_zpssgfpehhi.png


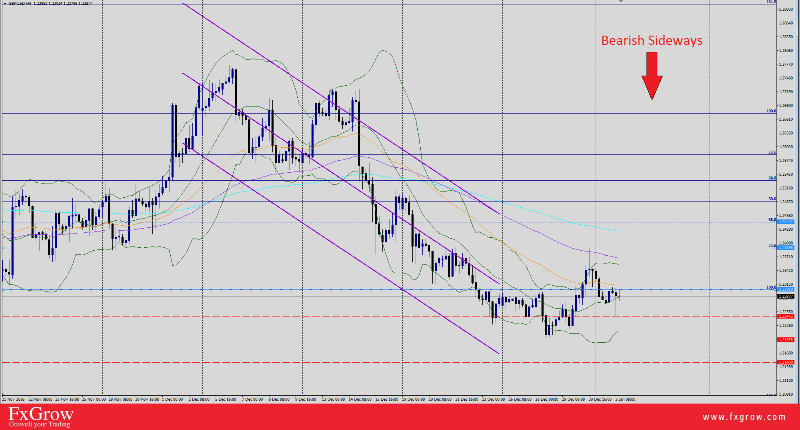
Just a moment ago, UK strated 2017 with positive ISM PMI 56.1, with addition 2.5 of 53.6 previous seesion, causing GBP/USD to rally from 1.2246, and clocked a high 1.2306. US index scored 102,62 low today, then spiked 103.33, currently trading 103.30 which to be considered high and a threatening level for all the rivals, specially sterling. The pair made a test on Fibonacci 100 resistance level R1 1.2301 which was successful causing GBP/USD to retreat 1.2298 at which the cable is trading right now, closing to its weekly Pivot at 1.2308. Today, GBP/USD will undergo a further test when US dollar awaits local PMI at 3:00 PM, published by Institute of Supply management.
'
Trend : Bearish Sideways

Key levels to watch : Weekly Pp 1.2308

Resistance Fibonacci levels : R1 1.2301 , R2 1.2389, R3 1.2444

Support Levels : S1 1.2244 , S2 1.2195, S3 1.2180

Remark : Although Sterling received a positive PMI, the market remains negative and warns for harder selloffs. S1 is a strong level, breaking it and stalling below is a warning for extending the bearish momentum towards S2 and S3 relatively. On the other hand, for the pair to shift into bullish tred, a close above R3 level is needed to spark further rallying. Look forward for US PMI todays at 3:00 PM which should bring new levels to GBP/USD.

For more in depth Research & Analysis please visit FxGrow.http://fxgrow.com/analysis-educatio...cal-analysis-fxgrow-free-forex-analysis-tools

Note: This analysis is intended to provide general information and does not constitute the provision of INVESTMENT ADVICE. Investors should, before acting on this information, consider the appropriateness of this information having regard to their personal objectives, financial situation or needs. We recommend investors obtain investment advice specific to their situation before making any financial investment decision.
 
FxGrow Daily Technical Analysis – 03rd Jan, 2017
By FxGrow Research & Analysis Team

EUR/USD UNDER PRESSURE YET AGAIN, US PMI IN SIGHT
EURUSD_zpsfdecomij.png


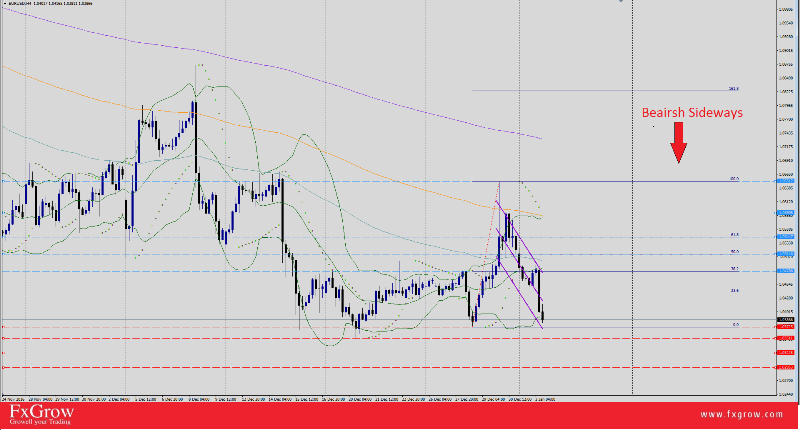
EUR/USD ended 2016 and started 2017 extending bearish momentum following strong greenback bulls today, and ECB non changed bid rate policy plus 20B cut from 80B EUR bond purchasing, which market received with negative reaction towards the EURO following lack of confidence after UK breaking EURO zone. Earlier, the pair opened 2017 sessions at 1.0452, peeked to 1.0490 high, then faded away from 1.04 level, failing to guard it, sank to 1.0390, at which the pair is currently trading. EUR/USD collapsed today following strong US index peeking to 103.40. On the other hand, EUR index dropped to 85.75 dropping from 86.41 top. Today, US index will undergo a further test when US local PMI is released at 3:00 PM, published by Institute of Supply management. Also, tomorrow EUR PMI will be published at 8:55 AM GMT. Market is ignoring EUR data and has its eye set on US data and US index which they both have more impact on the cable.

Trend : Bearish Sideways -- The downside prevails

Key levels to watch : Weekly Pp 1.0513


Fibonacci resistance levels : R1 (38.2) 1.478, R2 (50) 1.0478, R3 (61.8) 1.0511, R4 1.0590

Support levels : S1 1.0372. S2 1.0351, S3 1.0322, S4 1.0295

Remark : The market overall remains bearish and closing under Friday's suggests that bear forces retain control. A close under S1 is will encourage further selloffs. A penetration for S2 could send wash towards S3 & S4 levels. On the other hand, a close above R4 will spark 100 Fibonacci level at 1.0651 which will spark the bullish momentum for EUR/USD. Keep eye on US index level as it lays heavily on EUR/USD plus today's US local PMI at 3:00 PM GMT will bring new perspectives for the cable.

For more in depth Research & Analysis please visit FxGrow.http://fxgrow.com/analysis-educatio...cal-analysis-fxgrow-free-forex-analysis-tools

Note: This analysis is intended to provide general information and does not constitute the provision of INVESTMENT ADVICE. Investors should, before acting on this information, consider the appropriateness of this information having regard to their personal objectives, financial situation or needs. We recommend investors obtain investment advice specific to their situation before making any financial investment decision.
 
FxGrow Daily Technical Analysis – 04th Jan, 2017
By FxGrow Research & Analysis Team

Kiwi Collapses on Negative local GDT
NZDUSD4_zpsem39dtfz.png


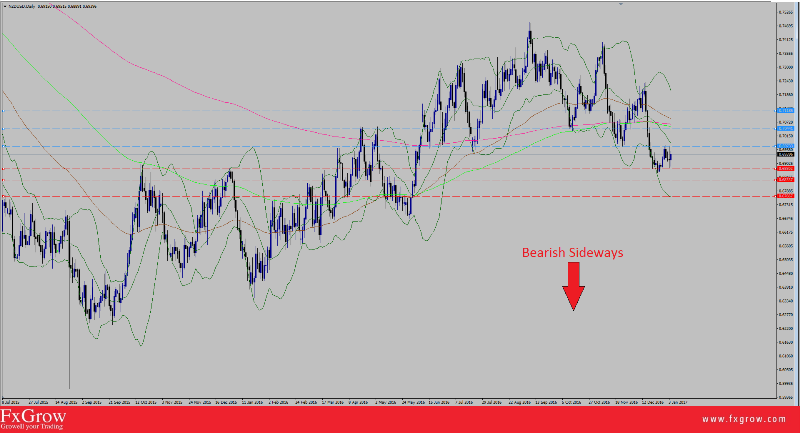
NZD/USD extended bearish momentum following negative local GDT, not meeting expectations. Diary price index scored -3.9% compared -0.5% in previous sessions, causing the pair to plunge to 0.6884 low, after clocking a high 0.6973. NZD/USD opened trading session with a surge at 0.6951 high, at which the cable is currently trading, taking advantage of weaker US dollar as US index dropping from 103.42 high to 102.91 low. Although the pair is showing some short-term-up-trend correction, it's still to be considered bearish taking into consideration strong US dollar even though the index is taking a rest right now after peeking to 103.81 at the end of 2016.

Trend : Bearish Sideways

Key levels to watch : Weekly Pp 0.6933

Resistance levels : R1 0.6973, R2 0.7044, R3 0.7118

Support levels : S1 0.6880, S2 0.6833, S3 0.6766

Remark : Overall the market remains bearish even though the cable is showing some slight recovery. US index is still to be considered relatively high with minor down correction. A break below S1 will cause further selloffs and wash towards S2 & S3. However, if the pair closes above R2 level, price level will trigger towards R3 level and above it the NZD/USD will shift to bullish momentum. Keep eye on US index.


For more in depth Research & Analysis please visit FxGrow.http://fxgrow.com/analysis-educatio...cal-analysis-fxgrow-free-forex-analysis-tools

Note: This analysis is intended to provide general information and does not constitute the provision of INVESTMENT ADVICE. Investors should, before acting on this information, consider the appropriateness of this information having regard to their personal objectives, financial situation or needs. We recommend investors obtain investment advice specific to their situation before making any financial investment decision.
 
FxGrow Daily Technical Analysis – 04th Jan, 2017
By FxGrow Research & Analysis Team

Japanese Yen Strengthen on Kuroda's Positive Comments, NFP Eyed
USDJPY4_zpsjxcfgow8.png


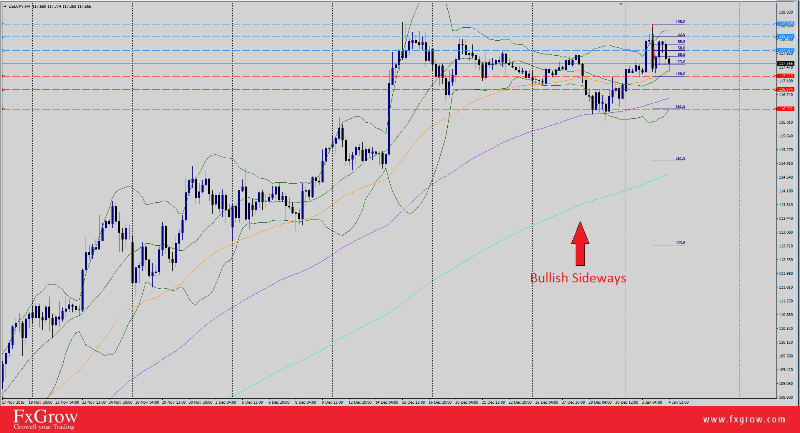
Japanese Yen received a positive shock earlier this morning with hints by Governor Kuroda on behalf of BOJ that progress is being made to end deflation. Yesterday, USD/JPY spiked yesterday to 118.60 April-2016-fresh-highs following strong US index peeking to 103.81, highest since March 2003 after receiving +1.5 on ISM PMI compared to 53.2 previous session. On today's opening sessions, the pair showed minor short-term-down correction following the path of Kuroda's positive comments first, second collapsing US index today at 102.93 low. Japanese Yen was energized by Nekkei index peeking today to 19594 Dec-2015-fresh-highs. USD/JPY is currently trading 117.51 intraday, above weekly Pp 116.91.

Key Headlines:

"More confident will make progress ending deflation"

"More confident will make progress in 2017 on deflation "

Trend : Bullish Sideways

Key levels to watch : Weekly Pp 116.91


Fibonacci resistance levels : R1 117.91, R2 118.27, R3 118.60


Fibonacci Support levels : S1 117.22, S2 116.87, S3 116.35

Remark : The market remains Bullish. Short term minor-downtrend correction is expected due to the ebb and flow between strong US dollar and excessive effort by BOJ to support Japanese Yen. Long positions above R1 will spark additional boost for the cable towards R2 & R3 levels. A break under S3 is needed for USD/JPY to shift into bearish momentum. US index strength is the main player. Also today's FOMC minute meetings is a hint of Friday's NFP which will have a huge impact on US dollar strength.

For more in depth Research & Analysis please visit FxGrow.http://fxgrow.com/analysis-educatio...cal-analysis-fxgrow-free-forex-analysis-tools

Note: This analysis is intended to provide general information and does not constitute the provision of INVESTMENT ADVICE. Investors should, before acting on this information, consider the appropriateness of this information having regard to their personal objectives, financial situation or needs. We recommend investors obtain investment advice specific to their situation before making any financial investment decision.
 
FxGrow Daily Technical Analysis – 05th Jan, 2017
By FxGrow Research & Analysis Team

Oil Plunges Over Doubts of OPEC Allocated Quotas Commitment, Awaiting US Inventories
crudeoil_zpsny1zfkxk.png


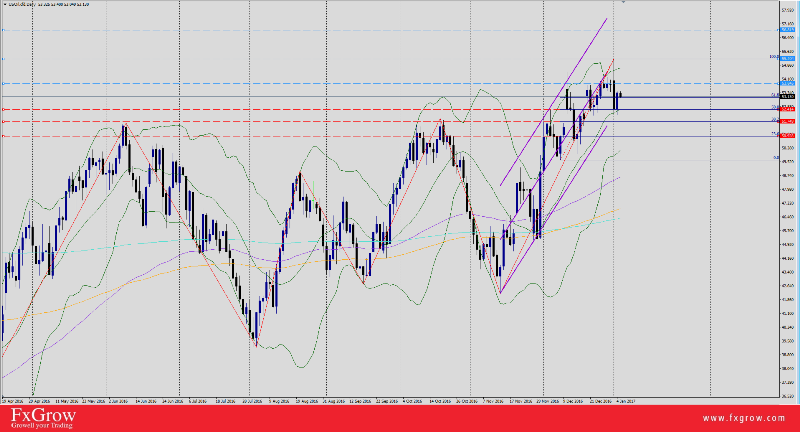
Crude oil started 2017 with a significant rally reaching 56.22 March-2015-fresh-highs following 2016 finale as OPEC reaches final decision regarding allocating shared quotas by OPEC and NON-OPEC cartel producers. Oil prices bulls were under one condition, monitoring production shares as decided without cheating, although doubts were aroused on how far the members will stick to the so anticipated OPEC-deal taking previous history of non compliance. The first domino stone that fell was the Kurds after comments by Iraqi oil minister Haider Al-Abadi delivering on late-Tuesday, citing that the Kurdish region was exporting more than its allocated share of oil as the country seeks to abide by OPEC output cut deal that kicked-in on Jan 1.

Iraqi PM noted, “The region is exporting more than its share, more than the 17 percent stated in the budget.”

Under the terms of the 2017 budget, which passed despite a boycott from a key Kurdish party, the autonomous region is allocated 250,000 bpd exports from oilfields under its control.

Other Rumors on CNBC livesquawk Russia will not start oil cuts until they see proven actions by OPEC.
Yesterday, The American Petroleum Institute (API) has reported a sizable draw on U.S. crude oil inventories, down 7.4 million barrels over the previous week—a much larger draw that expected, and the fifth draw in seven weeks.


Analysts expected a draw of around 1.7-2.2 million barrels for the week, and right ahead of the API data dump, oil prices responded upwards nearly 2 percent, in anticipation of a draw on a smaller scale.

Crude oil prices has entered a vague tunnel with too many factors affecting oil levels.

1- OPEC and Non-OPEC cut production.

2- OPEC and Non-OPEC commitment and compliance to allocated oil production Quotas.

3- US crude inventories that will be published today at 4:00 PM GMT will either support oil bulls or add further losses to price levels.

If OPEC and Non-OPEC cartels combined their efforts respecting cut production with further monitoring, then we will witness new high levels at 2017.

Trend: Sideways

Resistance level : R1 53.84, R2 55.20, R3 56.81

Support levels : S1 52.41, S2 51.74, S3 50.92

Remark : look forward for US crude inventories today scheduled for a release at 4:00 PM GMT.

For more in depth Research & Analysis please visit FxGrow.http://fxgrow.com/analysis-educatio...cal-analysis-fxgrow-free-forex-analysis-tools

Note: This analysis is intended to provide general information and does not constitute the provision of INVESTMENT ADVICE. Investors should, before acting on this information, consider the appropriateness of this information having regard to their personal objectives, financial situation or needs. We recommend investors obtain investment advice specific to their situation before making any financial investment decision.
 

Live Forex Chart

Currency
Rates
EUR / USD
1.12428
USD / JPY
158.042
GBP / USD
1.33318
USD / CHF
0.82484
USD / CAD
1.41713
EUR / JPY
177.683
AUD / USD
0.69520
Back
Top
Log in Register