BTC USD 81,293.3 Gold USD 4,165.56
Time now: Jun 1, 12:00 AM

Daily Technical Analysis by FxGrow

FxGrow Fundamental Analysis – 26th Jan, 2017
By FxGrow Investment Research Desk

Sterling Sharpens Ahead of Local GDP
GBPUSD_zps6vp6anoa.png


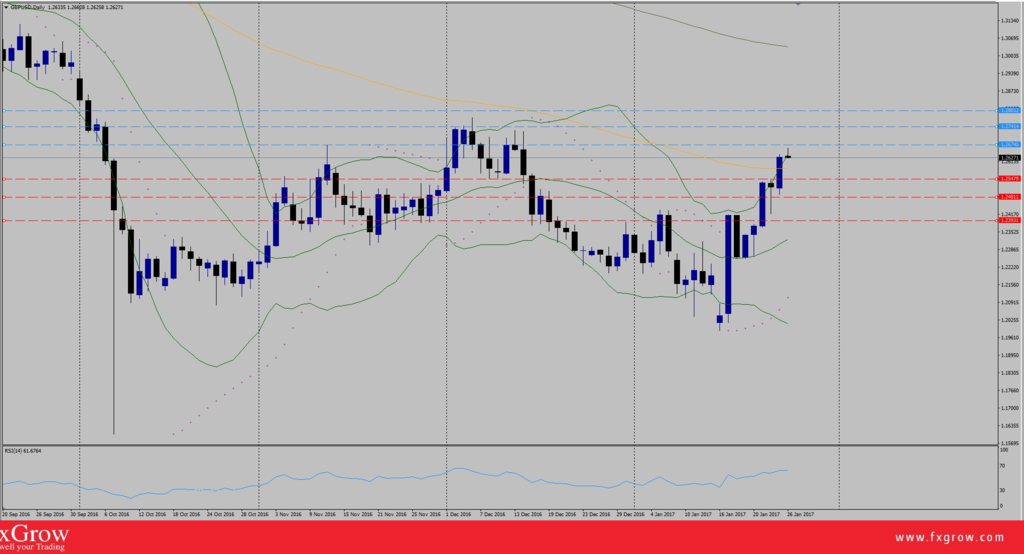
GBP/USD is on the right path of recovery and Brexit experience seems to be behind back. On Tuesday, final steps were put in motion for the release of article 50 and the divorce between the UK and EU has finally come to reality without specification on which trading system UK will adapt with EU and globally. Also, soft or hard Brexit to be decided by PM May and UK parliment. As a result, the pair was bullish since Tuesday, rallying from 1.2418 low, dilating further bull waves and clocked a 15-Jan-fresh-highs today at 1.2625. The pair is to go further test as UK prelim GDP today at 9:30 AM GMT, which will either confirm further up-attacks or make a minor-down-trend-correction depending on the data.

Trend : Bullish

Key levels to watch : Daily Pp 1.2588

Resistance levels : R1 1.2674, R2 1.2741, R3 1.2801

Support levels : S1 1.2547, S2 1.2481, S3 1.2393

Remark : Look forward for UK local GDP at 9:30 AM GMT plus US data today and tomorrow both at 1:30 PM GMT with US advanced GDP in focus.

For more in depth Research & Analysis please visit FxGrow.http://fxgrow.com/analysis-education/fxgrow-academia/fxgrow-blog

Note: This analysis is intended to provide general information and does not constitute the provision of INVESTMENT ADVICE. Investors should, before acting on this information, consider the appropriateness of this information having regard to their personal objectives, financial situation or needs. We recommend investors obtain investment advice specific to their situation before making any financial investment decision.
 
FxGrow Fundamental Analysis – 27th Jan, 2017
By FxGrow Investment Research Desk

USD/JPY Surges as USD Strengthen, US GDP in Sight
USDJPY_zpsb6x02kqt.png


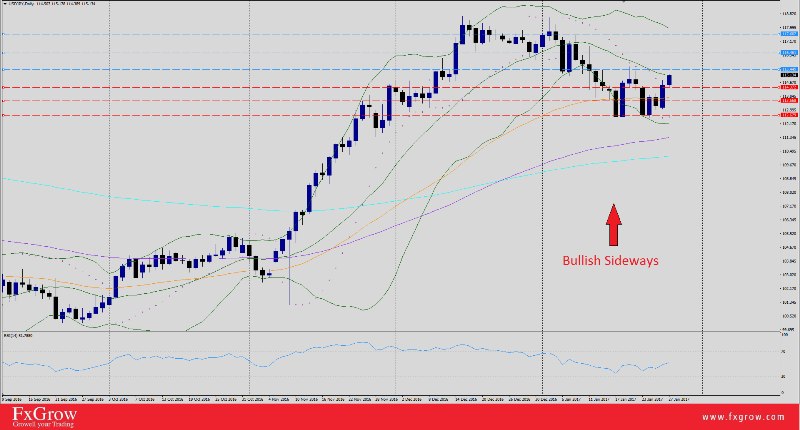
US Dollar extended the strong tone for second day facing Japanese Yen taking advantage of strong US stocks performance which lifted the blue chip (Dow) for a new historical record 20134 high. Yesterday, US index sank to 99.77 9-Dec-fresh-lows then shifted the course, clocking a at 100.71 (+ $0.94 to previous losses), currently US index trading 100.68 intraday. Comments by Japanese PM Abe earlier this morning "Can't say we've emerged from deflation just yet " supported USD/JPY bullish forces. Reuters.

Today, USD/JPY awaits two major economic events, first Core Durable Goods, Second with more focus Advanced GDP, both set for a release at 1:30 PM GMT. US dollar will either continue bullying its rivals, or give a breather depending on the data outcome.

Trend : Bullish

Key levels to watch : Daily Pp 114.14

Resistance levels : R1 115.44, R2 116.46, R3 117.60

Support levels : S1 114.37, S2 113.56, S3 112.67

Remark : look forward for US data today which will determine the cable trend for the coming days. A close below S3 is needed to the pair to shift to bearish trend. However, a penetration for R1 will enhance further attacks towards R2 level.

For more in depth Research & Analysis please visit FxGrow.http://fxgrow.com/analysis-education/fxgrow-academia/fxgrow-blog

Note: This analysis is intended to provide general information and does not constitute the provision of INVESTMENT ADVICE. Investors should, before acting on this information, consider the appropriateness of this information having regard to their personal objectives, financial situation or needs. We recommend investors obtain investment advice specific to their situation before making any financial investment decision.
 
FxGrow Fundamental Analysis – 03rd Feb, 2017
By FxGrow Investment Research Desk

Gold Surges On US Dollar Uncertainties, NFP Eyed
gold_zpsbglvxom1.png


Gold has proven yet again to be a sacred haven and the ultimate substitute when economies seem to be unstable. Between Trump's promises of better US economy and steps of such achievement, US index is wallowing and the shiny metal is taking the advantage being on strong demand. Trump's plan includes lower taxation, lighter regulations, full employment, and faster US economy growth. But Trump's recent pronouncements, political attacks, and threatening previous achieved agreements is creating an unstable environment for US economy, and along with it, global fear of what may come. Add to that, petition singed by UK citizens unwelcoming Trump's visit added a negative weight on the US president being accepted globally. Trump may achieve his goals, but the pathway is spiky.

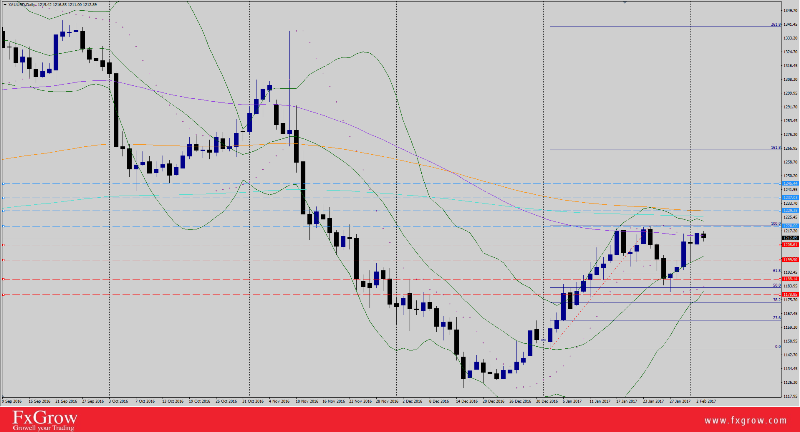
As a result, US index bottomed yesterday at 99.19 15-Nov-fresh-lows after a significant rally at 2017 beginning scoring 103.81 highs. Dow Jones on the other hand, rolled 356 point on Tuesday after ceiling 20138 last week due to the above mentioned fundamentals. XAUUSD was the winner during this week after a significant rally on Monday from 1188.31 low, anchored yesterday at 1225.35 with a new record for 2017.

The question that's evolving now is, how far will US index and gold respond to US economical data today being dragged behind Trump's policies ?

Trend : Bullish Sideways

Resistance levels : R1 1220, R2 1229.28, R3 1237.03, R4 1245.44

Support levels : S1 1208.61 , S2 1199.50, S3 1188.14, S4 1174.46

Remark : Gold is bullish due to weak US dollar performance and US economical instability but look forward for US data today at 1:30 PM GMT with NFP in focus as it has a great effect on US Dollar levels. A close above R2 level projects further attacks towards R3&R4 levels. A close under S2 is needed to reverse gold bullish momentum and a penetration for S2 level will increase further selloffs and wash to S3&S4 levels. Be careful from setbacks and retreats on support and resistance levels as a first test.

For more in depth Research & Analysis please visit FxGrow.http://fxgrow.com/analysis-education/fxgrow-academia/fxgrow-blog

Note: This analysis is intended to provide general information and does not constitute the provision of INVESTMENT ADVICE. Investors should, before acting on this information, consider the appropriateness of this information having regard to their personal objectives, financial situation or needs. We recommend investors obtain investment advice specific to their situation before making any financial investment decision.
 
Last edited:
FxGrow Fundamental Analysis – 06th Feb, 2017
By FxGrow Investment Research Desk

Australian Dollar Slips on Disappointing Local Data, Awaiting RBA Move
AUDUSD_zps6ekl4yiq.png


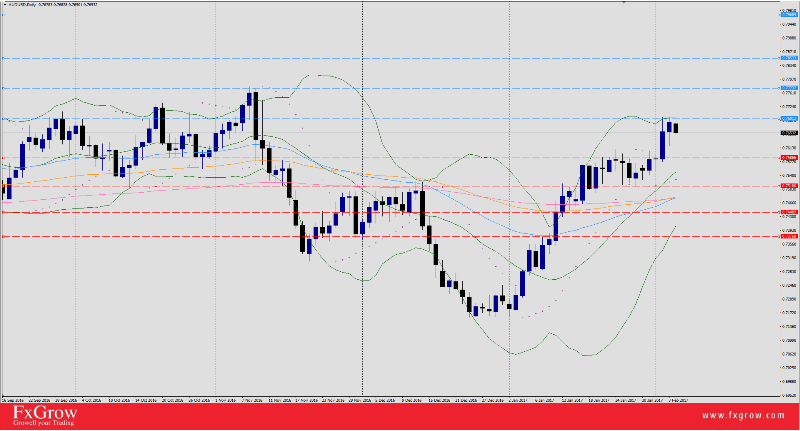
Aussie opened trading session with disappointing local data with retails sales -0.1% compared 0.1% on previous sessions. AUD/USD had the chance to continue withstrong tone facing collapsing US dollar, as US index sank last week to 15-Nov-2017-fresh-lows at 99.23. AUD/USD, last Thursday, clocked a high 0.7696 11-Nov-2017 fresh highs, but faded away from 0.77 handle after negative retail sales.

Eyes now are focused on RBA move, awaiting interest rates decision whether to keep it at current 1.5% or change it with a hike at less expectations. Although forecasts are to leave interest rates at current 1.5% due to strong Australian and growing economy, but the cable could witness some volatility due to the event itself. Also, the interest rate decision will be followed by RBA rate statement or speech and hints of strong economy and positive growing might add some boosters for the AUD level.

Trend : Bullish sideways

Key levels to watch : Daily Pp 0.7677

Resistance levels : R1 0.7691, R2 0.7732, R3 0.7853

Support levels : S1 0.7586, S2 0.7510, S3 0.7450

Remark : Look forward for RBA interest rate statement tomorrow scheduled at 3:30 AM GMT. AUD/USD volatility are expected shortly before the decision and especially during the RBA statement or press release as the content will have a major impact on the pair levels.

For more in depth Research & Analysis please visit FxGrow.http://fxgrow.com/analysis-education/fxgrow-academia/fxgrow-blog

Note: This analysis is intended to provide general information and does not constitute the provision of INVESTMENT ADVICE. Investors should, before acting on this information, consider the appropriateness of this information having regard to their personal objectives, financial situation or needs. We recommend investors obtain investment advice specific to their situation before making any financial investment decision.
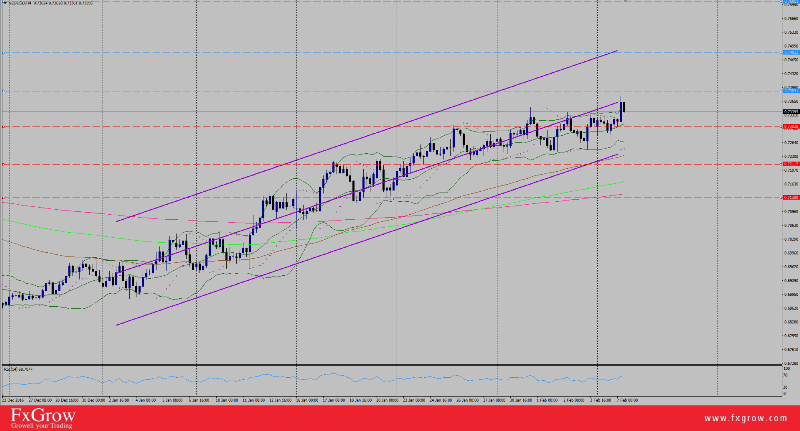
 
FxGrow Fundamental Analysis – 07th Feb, 2017
By FxGrow Investment Research Desk

Kiwi Strengthen On Positive Inflation REPORT, RBNZ Interest Rates Eyed
NZDUSD_zpsem3x75sd.png


NZD/USD extended the bullish momentum on Asian trading session lifted by positive inflation expectations at 1.9% compared with 1.7% on previous sessions. Kiwi found comfort last week with collapsing USD at 99.23 low and even though US index showed some minor recovery today clocking a high 100.23, NZD is ignoring USD and currently flying solo. NZD/USD awaits today GDT price index today at 1:30 PM GMT, but the main focus is shifted till tomorrow's RBNZ interest rates decision at 8 PM GMT, followed by a press conference on behalf of RBNZ at 9:00 PM GMT.

RBNZ current interest rates are 1.75% and forecasts are to leave it unchanged but due to 1.9% inflation expectations published today, the odds of a rate hike are increasing.

Trend : Bullish Sideways

Key levels to watch : Daily Pp 0.7311

Resistance Levels : R1 0.7389, R2 0.7482, R3 0.7606

Support levels : S1 0.7301, S2 0.7211, S3 0.7130

Remark : Look forward for today's GDT index which could shake the pair level but expectations of higher volatility will take place shortly before and after RBNZ interest rates decision. Also, Gov Wheeler speech on Thursday early sessions.


For more in depth Research & Analysis please visit FxGrow.http://fxgrow.com/analysis-educatio...cal-analysis-fxgrow-free-forex-analysis-tools

Note: This analysis is intended to provide general information and does not constitute the provision of INVESTMENT ADVICE. Investors should, before acting on this information, consider the appropriateness of this information having regard to their personal objectives, financial situation or needs. We recommend investors obtain investment advice specific to their situation before making any financial investment decision.
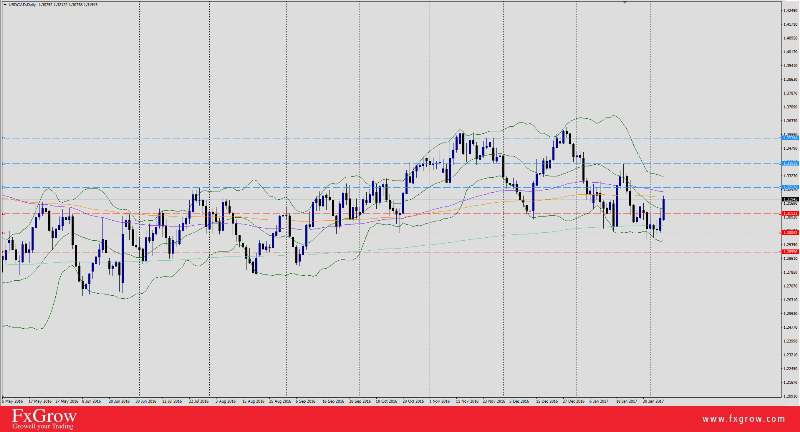
 
FxGrow Fundamental Analysis – 07th Feb, 2017
By FxGrow Investment Research Desk

USD/CAD Extend Gains ahead of US and Canadian trade balance
USDCAD_zps9vfhnfpa.png


US dollar opened trading sessions with a strong tone facing it's south Canadian neighbor and after a long period of comatose, US Dollar has finally shown sings of recovery as the index peeked to 100.69 high today, currently trading at 100.63. Last week USD/CAD bears were supported by positive Canadian GDP at 0.4% compared to -0.2% and weaker US dollar performance. USD/CAD bulls were also fueled today by slipping oil prices which added further losses for the loonie.

Eyes are shifted today on the race between two neighbors as US and Canada will release their trade balance, both at the same time 1:30 PM GMT.

Trend: Sideways

Resistance levels : R1 1.3257, R2 1.3392, R3 1.3534

Support levels : S1 1.3112, S2 1.3004, S3 1.2895

Remark : Look forward today for US and Canadian trade balance released at the same time 1:30 PM GMT in addition to Canadian unemployment rate on Friday at 1:30 PM GMT.

For more in depth Research & Analysis please visit FxGrow.http://fxgrow.com/analysis-educatio...cal-analysis-fxgrow-free-forex-analysis-tools

Note: This analysis is intended to provide general information and does not constitute the provision of INVESTMENT ADVICE. Investors should, before acting on this information, consider the appropriateness of this information having regard to their personal objectives, financial situation or needs. We recommend investors obtain investment advice specific to their situation before making any financial investment decision.

 
FxGrow Fundamental Analysis – 08th Feb, 2017
By FxGrow Investment Research Desk

Oil Price Slips on Hints of Imposing Crude Imports Taxes
crude-oil_zpsvj13r5pt.jpg


The war continues between the two parties, USA and OPEC. Taking into consideration USA is the largest economy in the world, with heavy dependence on Crude oil for industrial and civil sectors, it is of USA's best interest to keep lower prices.

On the other hand we have OPEC, being dependent on oil production as the main source for economy with recent efforts to curb oil production and additional glut in the market with hopes of higher traded oil levels.

OPEC recent meeting in Vienna was fruitful and resulted in an epic so long waited deal to cut 1.8M bpd. Compliance so far was estimated at 85% and 100% is expected to kick by beginning of June 2017 which lifted oil levels from $36 at 2016 opening, extended additional gains at Jan 2017, peeking above $55 and a steady increase was expected through 2017 especially beginning of June.

Yesterday, oil prices took a dip and extended bearish momentum resulted in -3.77% loss (-$2.1) on expectations that Mr. Trump is due to impose a controversial import tax for crude oil products. Now the WTI/Brent trade is back in fashion on expectations that the spread will again become highly changeable due to the possibility that under President Donald Trump the United States will slap an effective 20 percent tax on imports, including oil according to Reuters. Analysts mentioned that such move would almost certainly break World Trade Organization rules.

Uncertainty over Trump's tax policy poses issues for the oil industry itself. Analysts at Goldman Sachs - one of the most active banks in physical commodity trading quoted ""We recommend shifting hedges to Brent as the basis risk is smaller than the policy risks ... In turn, consumers and refiners should consider hedging through WTI instead of Brent until the policy uncertainty is lifted," the bank said.

Also added, "Should the (tax) be implemented, we recommend that US producers aggressively take advantage of the 25-percent relative appreciation of WTI prices."

Analysts assigned only a 20 percent probability to the tax being implemented and 24 reports on futures prices implied only a 9 percent chance. Also, expectations of a surge in outright WTI prices would be short lived, as the oil price rallies would increase additional efforts for US producers to increase their output. With the chance that OPEC members would resume production, chances of oil surplus in 2018 is now into consideration.

A senior executive at a major trading house added that shale producers have been conspicuous by their absence from the hedging market in the past few weeks, precisely because of their reservations over the border tax. "Basically shale firms don't know what to do. You would look ****** if you hedge and the WTI price rally afterwards," he said.

In Conclusion, Trump is controversial and recent speeches and announcements have proven so. Add to that, low expectations of imposing tax law on crude oil imports with possibility of creating a problem for World Trade Organization rules, Trump's plan falls into narrow skepticism. OPEC deal has more solid grounds and it's already being implemented with positive outcomes. Hence, OPEC plan or deal has a heavier impact on the market and expectations of crude oil levels to reverse to bullish momentum are more likely but look forward for Trump's unpredictable moves.

Remark : Look forward for US crude oil inventories today scheduled today at 3:30 PM GMT which will shake oil levels on technical levels .


For more in depth Research & Analysis please visit FxGrow.http://fxgrow.com/analysis-education/fxgrow-academia/fxgrow-blog

Note: This analysis is intended to provide general information and does not constitute the provision of INVESTMENT ADVICE. Investors should, before acting on this information, consider the appropriateness of this information having regard to their personal objectives, financial situation or needs. We recommend investors obtain investment advice specific to their situation before making any financial investment decision.
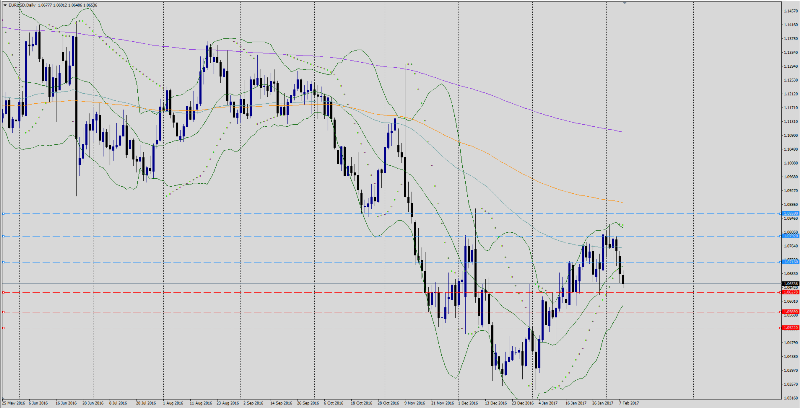
 
FxGrow Fundamental Analysis – 08th Feb, 2017
By FxGrow Investment Research Desk

EUR/USD Plunges On Recovering US Dollar
EURUSD%20investing_zpsdsj0k2wn.png


EUR/USD extended bearish move for the third consecutive day opposed by replenishing US dollar. The pair rolled shed 146 pips since Monday's highs 1.0790 till today's lows 1.0644, currently trading at 1.0647 and it's expected to depress further more as US index peeked today at 100.62. Trump, during a press conference, made a severe attack on the EURO accusing Germany of currency manipulation which created a negative bubble on ECB policy but Draghi responded back with annulment on Monday.

US index surprise recovery was boosted today and yesterday through coordination by Fed members Harker, Evans, and Williams saying that March Fed rate hike is back on the table after giving it 10% odds of occurring. They also added that additional two hikes after march are at higher chances.

Trend : Bearish

Key levels to watch : Daily Pp 1.0695

Resistance levels : R1 1.0716, R2 1.0792, R3 1.0859

Support levels : S1 1.0627, S2 1.0569, S3 1.0522

Remark : Look forward for tomorrow's US Unemployment Claims scheduled at 1:30. Closing under yesterday's lows will send a negative wave for EUR/USD levels with additional selloffs and wash towards S2 level. Closing above R2 is needed to reverse bearish momentum.

For more in depth Research & Analysis please visit FxGrow.http://fxgrow.com/analysis-educatio...cal-analysis-fxgrow-free-forex-analysis-tools

Note: This analysis is intended to provide general information and does not constitute the provision of INVESTMENT ADVICE. Investors should, before acting on this information, consider the appropriateness of this information having regard to their personal objectives, financial situation or needs. We recommend investors obtain investment advice specific to their situation before making any financial investment decision.
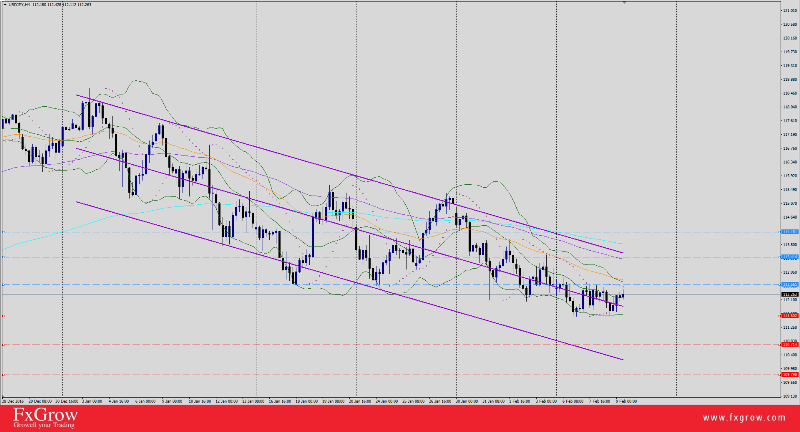
 
FxGrow Fundamental Analysis – 09th Feb, 2017
By FxGrow Investment Research Desk

Japanese Yen Dilates Tight Grip on US Dollar
USDJPY_zpsfoia9afd.png


USD/JPY extended bearish momentum since 3rd Jan 2017 supported by recent positive Japanese data and US dollar uncertainty. Japan Inaugurated early trading session with strong positive machinery orders at 6.7% compared to -5.1% on previous session indicating that manufactures will increase activity significantly. Recent bullish Yen was supported by collapsing USD as the index plunged to 99.19, lowest since 2017.

US benchmark 10-year treasury yield sank at 2.367% low this weak, not buying Fed members Harker, Evans, and Williams hints of the possibility of March Fed rate hike. Meanwhile, the Japanese 10-year government bond yield remained flat lined around 0.10% and efforts by BOJ to buy unlimited 5 year and 10 year bonds on Friday with hopes to withhold the increase on longer yields was deserted. Mr. Nakaso, Deputy of BOJ's, crossed wires via Reuters earlier commented on the price outlook and long-term interest rate target being far long to achieve price goal.

Key headlines:" What's most important is to persistently pursue powerful monetary easing "

"Some in markets argue BOJ might mull raising long-term rate target, but momentum toward hitting price goal not yet sufficient"

"Risks to economic, price outlook remain skewed to downside"

"Global rise in stocks, long-term rates reflects improvements in economic fundamentals, not just hopes for trump's policies"

"Rises in Japan exports, output gaining momentum, broadening to various sectors"

Eyes today are focused on US unemployment rates scheduled at 1:30 PM GMT and tomorrow's epic summit between Trump and PM Abe and subjects for discussion will be trades, currencies, security, macro-economy and China's current trade status is highly rated to be on the greasy menu.

Conclusion: Currently Japanese Yen has the upper hand supported by recent strong data and it's considered a scared haven substitute proved by yesterday's negative local data and USD/JPY remained stable; the pair even showed bearish candle charts. Add to that Trump and US Fed currently not in accord due to different perspectives and agendas.

Trend: Bearish Sideways

Key levels to watch : Daily Pp 112.03

Resistance levels : R1 112.56, R2 113.41, R3 114.18

Support levels : S1 111.60, S2 110.71, S3 109.79

For more in depth Research & Analysis please visit FxGrow.http://fxgrow.com/analysis-educatio...cal-analysis-fxgrow-free-forex-analysis-tools

Note: This analysis is intended to provide general information and does not constitute the provision of INVESTMENT ADVICE. Investors should, before acting on this information, consider the appropriateness of this information having regard to their personal objectives, financial situation or needs. We recommend investors obtain investment advice specific to their situation before making any financial investment decision.
 
FxGrow Fundamental Analysis – 09th Feb, 2017
By FxGrow Investment Research Desk

Gold Instills High Levels Ahead of US Data
gold_zpsadhuvt29.png


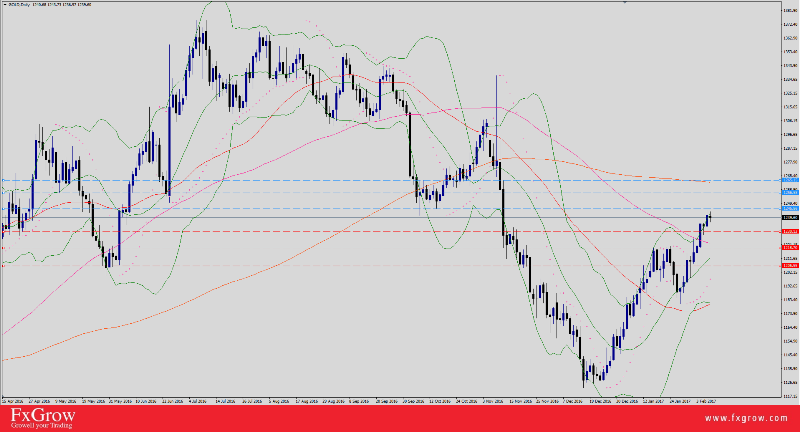
XAUUSD stands immune facing recovering US dollar during this week trading sessions. Current status of USA, Trump's unpredictable announcements, and recent immigration bans forbidding named nations to enter US borders, which was opposed by Fed courts, has created an unstable environment and dragged US dollar behind Trump. US index, since Trump took the rein, is on a chaotic ride between 98.69 low, up to 103.81 high, landed on 99.13 during this week. As a result, Gold took advantage being a safer substitute and considered a sacred haven when uncertainty is created. As a result, gold peeked to 1244.76 yesterday and it's expected to continue so under current circumstances.

Trend : Bullish Sideways

Key levels to watch : Daily Pp 1237.50

Resistance levels : R1 1245.86, R2 1256.58, R3 1265.15

Support levels : S1 1230.13, S2 1218.70, S3 1206.55

Remark : The market remains bullish. Closing above R1 will fuel further attacks towards R2&R3 levels. A penetration for S2 will send a negative wave with selloffs and wash towards S3 level. Look forward for Us unemployment claims today at 1:30 PM GMT.

For more in depth Research & Analysis please visit FxGrow.http://fxgrow.com/analysis-educatio...cal-analysis-fxgrow-free-forex-analysis-tools

Note: This analysis is intended to provide general information and does not constitute the provision of INVESTMENT ADVICE. Investors should, before acting on this information, consider the appropriateness of this information having regard to their personal objectives, financial situation or needs. We recommend investors obtain investment advice specific to their situation before making any financial investment decision.
 

Live Forex Chart

Currency
Rates
EUR / USD
1.12355
USD / JPY
158.015
GBP / USD
1.33280
USD / CHF
0.82593
USD / CAD
1.41575
EUR / JPY
177.538
AUD / USD
0.69510
Back
Top
Log in Register