BTC USD 81,394.7 Gold USD 4,165.56
Time now: Jun 1, 12:00 AM

Daily Technical Analysis by FxGrow

FxGrow Daily Technical Analysis – 07th Dec, 2016
By FxGrow Research & Analysis Team

Kiwi Strengthen on Positive Local Data, Awaiting Wheeler Comments
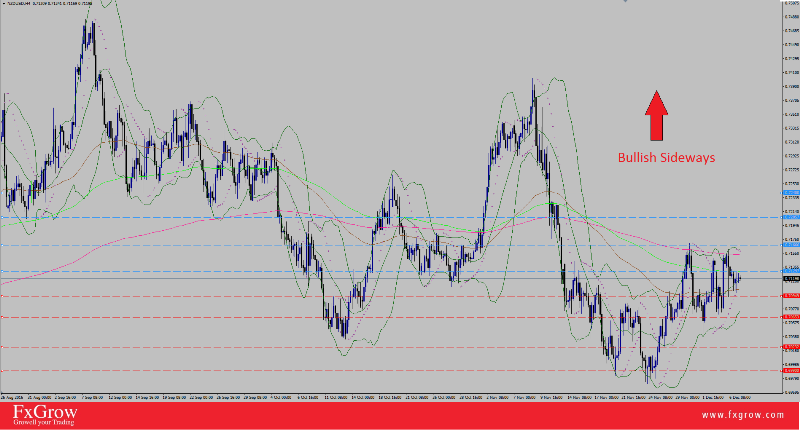
NZDUSD7_zpsdawrpin5.png


Imre Speizer, Research Analyst at Westpac, suggests that the NZD/USD should grind towards 0.7200 this week if the US dollar’s recent decline extends further. Also, NZ economic data continues growing, recently evidenced by the GDT dairy auction which increased 4% which was anticipated by futures pricing. In addition to that, US dollar was on second weak performance as US index dropped for the first time since Trump election to 99.88 after spiking to 102.12 on 24th of Nov.

Trend: Bullish sideways.

Key levels to watch : Weekly Pp 0.7113

Resistance levels : R1 0.7129, R2 0.7166, R3 0.7205, R4 0.7240

Support levels : S1 0.7094, S2 0.7065, S3 0.7023, S4 0.6990

Remark : NZD/USD is bullish sideways. Even though Kiwi economy is growing, US dollar still to be considered strong even on past days of weak performance. Look froward for Wheeler speech tonight as NZ economy will respond and the pair volatility would increase.

For more in depth Research & Analysis please visit FxGrow.http://fxgrow.com/analysis-educatio...cal-analysis-fxgrow-free-forex-analysis-tools

Note: This analysis is intended to provide general information and does not constitute the provision of INVESTMENT ADVICE. Investors should, before acting on this information, consider the appropriateness of this information having regard to their personal objectives, financial situation or needs. We recommend investors obtain investment advice specific to their situation before making any financial investment decision.
 
FxGrow Daily Technical Analysis – 08th Dec, 2016
By FxGrow Research & Analysis Team

USD/JPY Bearish On Weaker USD performance, awaiting further data
USDJPY8_zpsm72givwg.png


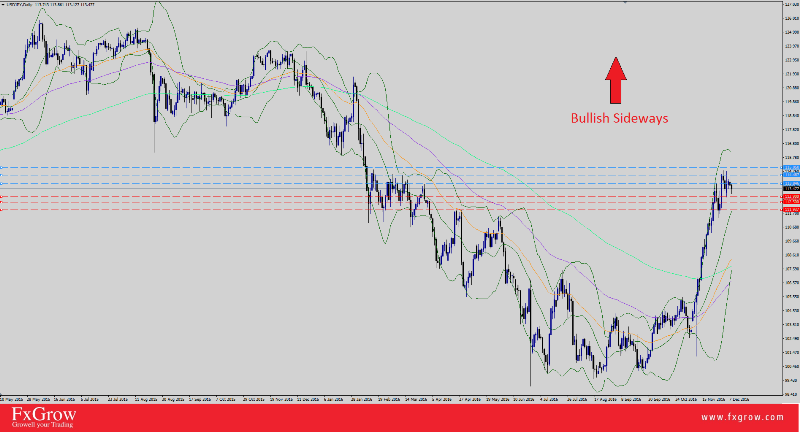
Japanese economy witnessed a mix between positive and negative data. Japanese current account rose 0.45T compared to 1.48T previously, while final GDP was 0.3%, less by 0.2% in last GDP. Bank lending showed no change at 2.4%. On the other hand, Chinese trade balance came 298B, less by 27B in last balance at 398B. Taking into consideration negative atmosphere in economic Asian data, one of the reason that justifies why USD/JPY was not bullish in the weakness of US dollar performance the past few days as US index dropped to 100.00 low yesterday, not long before dropping below 100 level at 99.87 on Monday.

Trend: Bullish Sideways

Key levels to watch : Weekly Pp 113.25

Resistance levels : R1 113.84, R2 114.48, R3 115.05

Support levels: S1 112.90, S2 112.50, S3 111.93

Remark : USD/JPY to be considered bullish with short-term-correction. US dollar on weak performance but still relatively strong. Market is highly poised for US fed rate decision next week but economic data cannot be ignored. Look forward for US Unemployment claims today at 1:30 PM GMT which might create some volatility in the market.

For more in depth Research & Analysis please visit FxGrow.http://fxgrow.com/analysis-educatio...cal-analysis-fxgrow-free-forex-analysis-tools

Note: This analysis is intended to provide general information and does not constitute the provision of INVESTMENT ADVICE. Investors should, before acting on this information, consider the appropriateness of this information having regard to their personal objectives, financial situation or needs. We recommend investors obtain investment advice specific to their situation before making any financial investment decision.
 
FxGrow Daily Technical Analysis – 09th Dec, 2016
By FxGrow Research & Analysis Team

EUR/USD Back to fragile state after Draghi's Speech
EURUSD9_zpsfbd3eysj.png


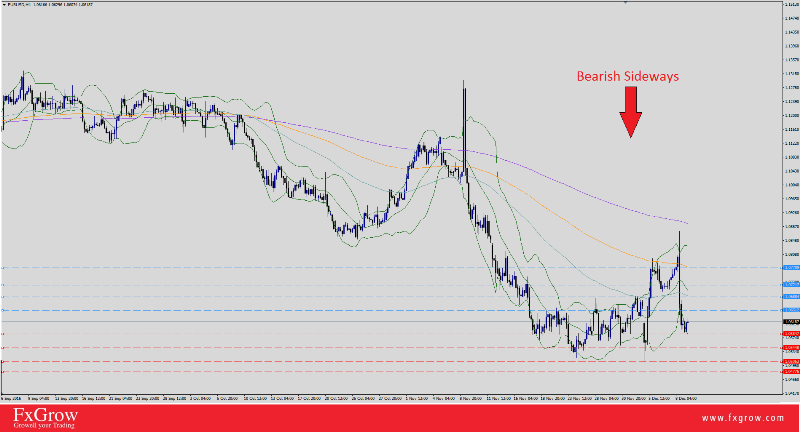
Eurozone, once again votes for unchanged bid rate and left still at 0.00%. But the action came later on as Draghi made speech in which he extended bond purchasing program from April 2017 till the end of December 2017 with additional edition in which the ECB deducts 20B Euro from 80B per month-bond-purchasing. The market did not receive the suggested policy in open arms as they reacted in lesser confidence towards EUR currency. EUR/USD peeked yesterday ahead of local news and suspense took the EUR/USD on a chaotic ride as it spiked 1.0873 2-weeks-fresh highs, then the pair rolled down sinking to 1.0597 low.

Trend : Bearish

Key levels to watch : Weekly Pivot 1.0639

Resistance levels : R1 1.0651 , R2 1.0688 , R3 1.0721, R4 1.077

Support Levels : S1 1.0584 , S2 1.0544, S3 1.0506, S4 1.0477


Remark : EUR/USD is bearish due to disappointing news on ECB policy yesterday and USD recovered and back in bully shape. Look forward for US consumer sentiment today at 3:00 PM GMT which could create some volatility in the market. Also, the focus now is shifted from ECB monetary and fiscal policy, to US FED rate that everyone is awaiting. Also R3 is a strong level in case of price penetration will trigger R4 level.

For more in depth Research & Analysis please visit FxGrow.http://fxgrow.com/analysis-educatio...cal-analysis-fxgrow-free-forex-analysis-tools

Note: This analysis is intended to provide general information and does not constitute the provision of INVESTMENT ADVICE. Investors should, before acting on this information, consider the appropriateness of this information having regard to their personal objectives, financial situation or needs. We recommend investors obtain investment advice specific to their situation before making any financial investment decision.
 
FxGrow Daily Technical Analysis – 09th Dec, 2016
By FxGrow Research & Analysis Team

GBP/USD Sinks on stronger US dollar, Awaiting local data
GBPUSD9_zpsvhhwpoky.png


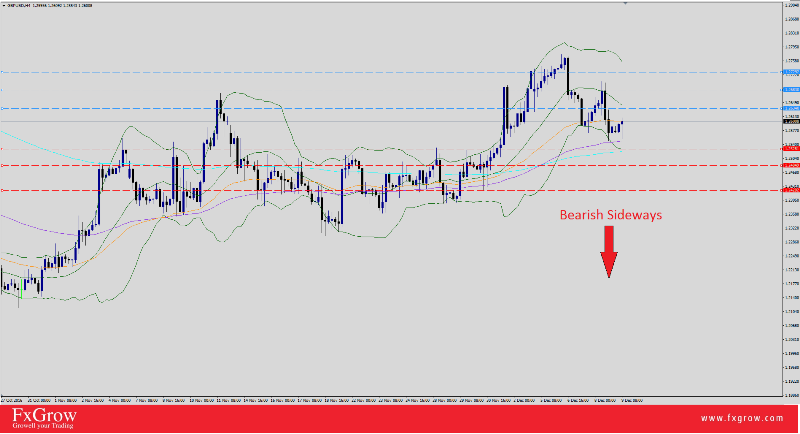
GBP/USD rallied on yesterday's trading sessions to 1.2704 highs, but failed to hold strongly gains against greenback as the pair bearish-ed to 1.2548 lows. There were no macroeconomic signals from Big Ben, although it was the final day of the Supreme Court's hearing on Brexit, to decide whether Theresa May should get the Parliament's permission to trigger the Article 50, but a decision will be known probably next week. Sterling is still on soft ground as long as supreme court is still postponing the final decision regarding it's pre-twin-mate, the Eurozone.
Trend : bearish sideways

Key levels to watch : Weekly Pp 1.2619

Resistance levels : R1 1.2634 , R2 1.2683, R3 1.2729

Support Levels : S1 1.2528, S2 1.2484, S3 1.2420

Remark : Look forward for UK data today at 9:30 AM GMT, later on US data at 3:00 PM GMT which will create some volatility but the main focus is currently shifted towards next Fed Rate meeting and possible outcomes.

For more in depth Research & Analysis please visit FxGrow.http://fxgrow.com/analysis-educatio...cal-analysis-fxgrow-free-forex-analysis-tools

Note: This analysis is intended to provide general information and does not constitute the provision of INVESTMENT ADVICE. Investors should, before acting on this information, consider the appropriateness of this information having regard to their personal objectives, financial situation or needs. We recommend investors obtain investment advice specific to their situation before making any financial investment decision.
 
FxGrow Daily Technical Analysis – 13th Dec, 2016
By FxGrow Research & Analysis Team

GBP/USD Surges on weaker US dollar, Local CPI Eyed
GBPUSD13_zpsanhrh1sh.png


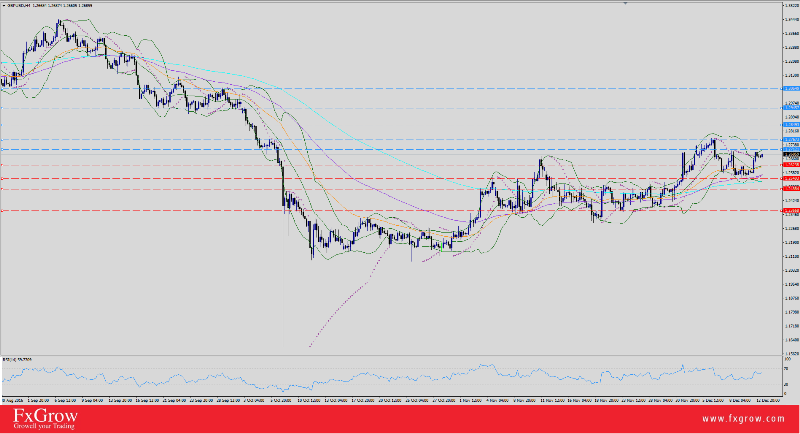
GBP/USD rallied yesterday from 1.2566 low, knocked on 1.27 level, then faded away as the pair closed at 1.2674 after clocking a high 1.2699. Although UK local data was not to expectations, the cable found a shelter in US index weak performance yesterday after remarkable job on Friday. The index dropped to 100.86 yesterday, but before that, it was on 101.82 peek. Currently the pair is trading 1.2672 intraday, above it's weekly pivot at 1.2631.

This week, economic calendar is heavily colored with local UK data, but the FOMC meeting and the possible outcome of anticipated Fed Rate hike stole the thunder lightning and traders are ignoring everything except the FOMC.

Trend: Bullish Sideways , the upside prevails

For more in depth Research & Analysis please visit FxGrow.http://fxgrow.com/analysis-educatio...cal-analysis-fxgrow-free-forex-analysis-tools

Note: This analysis is intended to provide general information and does not constitute the provision of INVESTMENT ADVICE. Investors should, before acting on this information, consider the appropriateness of this information having regard to their personal objectives, financial situation or needs. We recommend investors obtain investment advice specific to their situation before making any financial investment decision.
 
FxGrow Daily Technical Analysis – 14th Dec, 2016
By FxGrow Research & Analysis Team

Trade on FOMC news, Technical levels to watch EUR/USD technical levels to watch :

4iymht.jpg


EUR/USD technical levels to watch :

Weekly Pp : 1.0647

Resistance levels : R1 1.0679 , R2 1.0732, R3 1.0795, R4 1.0856

Support levels : S1 1.0605, S2 1.0568, S3 1.0518, S4 1.0420


GBP/USD Technical levels to watch:

Weekly Pp : 1.2632

Resistance levels : R1 1.2696, R2 1.2767, R3 1.2849, R4 1.2945

Support levels : S1 1.2600 , S2 1.2516, S3 1.2413, S4 1.2312


USD/JPY technical levels to watch :

Weekly Pp : 114.55

Resistance levels : R1 115.54, R2 116.23, R3 116.90, R4 117.66

Support levels : S1 114.38, S2 113.38, S3 112.51, S4 111.63


AUD/USD technical levels to watch :

Weekly Pp : 0.7457

Resistance levels : R1 0.7532, R2 0.7582, R3 0.7634, R4 0.7685

Support levels : S1 0.7474, S2 0.7428, S3 0.7383, S4 0.7350


NZD/USD technical levels to watch :

Weekly Pp 0.7142

Resistance levels : R1 0.7247, R2 0.7303, R3 0.7367, R4 0.7436

Support : levels : S1 0.7171, S2 0.7099, S3 70.42, S4 0.6984


USD/CAD technical levels to watch :

Weekly Pp : 1.3229

Resistance levels: R1 1.3166 , R2 3263, R3 1.3357, R4 1.3435

Support levels : S1 1.3073, S2 1.3002, S3 1.2935, S4 1.2853


Gold technical levels to watch :

Weekly Pp : 1167.37

resistance levels : R1 1170.08, R2 1183.19, R3 1199.88, R4 1230.36

Support levels : S1 1151.60, S2 1140.87, S3 1129.21 , S4 1114.46

Crude oil technical levels to watch :

Weekly Pp : 51.18

Resistance levels : R1 53.12, R2 54.56, R3 55.72, R4 56.96

Support levels : S1 51.63, S2 49.82, S3 47.84, S4 46.22

For more in depth Research & Analysis please visit FxGrow.http://fxgrow.com/analysis-educatio...cal-analysis-fxgrow-free-forex-analysis-tools

Note: This analysis is intended to provide general information and does not constitute the provision of INVESTMENT ADVICE. Investors should, before acting on this information, consider the appropriateness of this information having regard to their personal objectives, financial situation or needs. We recommend investors obtain investment advice specific to their situation before making any financial investment decision.
 
FxGrow Daily Technical Analysis – 16th Dec, 2016
By FxGrow Research & Analysis Team

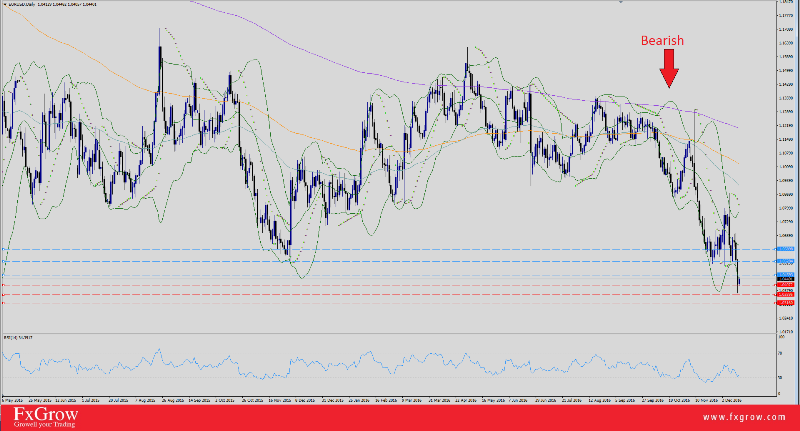
EUR/USD Extends Comatose Further More, Awaiting Local Data
EURUSD16_zpsufos3gfg.png


EUR/USD is on a roller coaster since last Wednesday after a peek at 1.0872, market couldn't swallow ECB decision on zero change-bid-rate and extending bond purchasing further more with a 20B Eur cut from initial 80B Eur. The pair collapsed on Thursday hitting rock bottom at 1.0530. EUR/USD didn't stop at that stage as the pair declined further more after a 0.25% hike on US Fed rates given US dollar additional boost. EUR/USD sank to 1.0365 yesterday, then re-bounced as a short term correction, currently trading 1.0438 intraday. US index hiked to 103.56 2003-March-fresh-highs yesterday then retreated to 102.97 today. EUR index hit rock bottom at 85.77 2016-fresh-low, currently trading 86.29 intraday.

Trend : Bearish , the downside prevails.

Resistance Levels : R1 1.0461, R2 1.0543, R3 1.0628

Support Levels : S1 1.0407, S2 1.0359, S3 1.0316

Remark : Key resistance at R1 1.0459. Short positions below R1 will set an alarm to support levels. A full H4 candle above 1.0459, look further for bull moves towards R2. Look forward for economic news which will give a better outlook for the cable.

For more in depth Research & Analysis please visit FxGrow.http://fxgrow.com/analysis-educatio...cal-analysis-fxgrow-free-forex-analysis-tools

Note: This analysis is intended to provide general information and does not constitute the provision of INVESTMENT ADVICE. Investors should, before acting on this information, consider the appropriateness of this information having regard to their personal objectives, financial situation or needs. We recommend investors obtain investment advice specific to their situation before making any financial investment decision.
 
FxGrow Daily Technical Analysis – 16th Dec, 2016
By FxGrow Research & Analysis Team

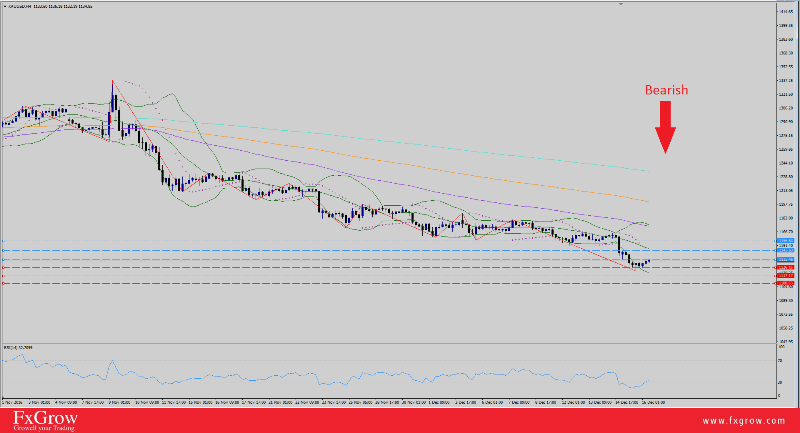
Gold Extends Bearish Mood on Strong US Dollar
Gold16_zpszbotwavz.png


XAUUSD is under pressure yet again. The heaven sacred metal extended further losses on Wednesday when US Fed rate hiked to 0.75%, dropping from 1164.97 high, made several downtrend stations that ended at yesterday's lows 1122.52. US index peeked also yesterday to 103.57 2003-fresh-highs. The general mood trend for gold still to be considered bearish taking into consideration strong US index, although it's trading now at 103, but still to be considered high. Currently, gold touched first resistance at 1135.46 and R1 is being tested. A full H4 cycle above will trigger R2 and R3 levels relatively. The opposite scenario should be taken into consideration with first support at 1126.16, below that, look for more pressure on XAUUSD.

Trend : Bearish

For more in depth Research & Analysis please visit FxGrow.http://fxgrow.com/analysis-educatio...cal-analysis-fxgrow-free-forex-analysis-tools

Note: This analysis is intended to provide general information and does not constitute the provision of INVESTMENT ADVICE. Investors should, before acting on this information, consider the appropriateness of this information having regard to their personal objectives, financial situation or needs. We recommend investors obtain investment advice specific to their situation before making any financial investment decision.
 
FxGrow Daily Technical Analysis – 19th Dec, 2016
By FxGrow Research & Analysis Team

USD/JPY bears on Weaker US Dollar Performance, Awaiting BOJ Policy Rate
USDJPY19-12_zpsjjijiwt9.png


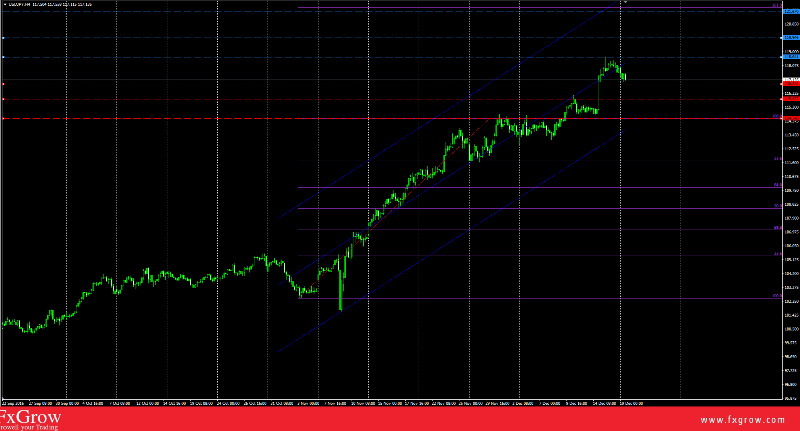
Japanese Yen opened early trading session with a strong tone against greenback after long sessions of soaring rivals since US Fed rate hike. Last week, the pair clocked 4th-Feb-fresh-highs at 118.66 as US dollar index spiked to 103.56. USD/JPY is bearish for the second session as the cable sank to 116.98 low today, in response to weaker US dollar performance as the index 102.50 low, USD/JPY currently trading at 117.29 intraday.

Markets are awaiting BOJ policy rate meeting and in case Mr. Kuroda hold any changes to 0% ongoing policy. Although polls are getting ahead that will be zero change in BOJ policy with some minor upgrade in economic assessments.

Trend: Bullish Sideways

Key levels to watch : Weekly Pp 117.12

Resistance levels : R1 118.64, R2 119.94, R3 121.67

Support levels : S1 116.83, S2 115.82, S3 114.53

Remark : look forward for BOJ announcement early morning on Tuesday which will bring new perspectives for Japanese Yen and how the currency will perform facing US dollar. A break above R2 Fibonacci 161.8 level will trigger R3 level. However, if the cable dropped to S3 Fibonacci 100 level, the pair to be considered bearish after long sessions of bullish momentum.

For more in depth Research & Analysis please visit FxGrow.http://fxgrow.com/analysis-educatio...cal-analysis-fxgrow-free-forex-analysis-tools

Note: This analysis is intended to provide general information and does not constitute the provision of INVESTMENT ADVICE. Investors should, before acting on this information, consider the appropriateness of this information having regard to their personal objectives, financial situation or needs. We recommend investors obtain investment advice specific to their situation before making any financial investment decision.
 
FxGrow Daily Technical Analysis – 20th Dec, 2016
By FxGrow Research & Analysis Team

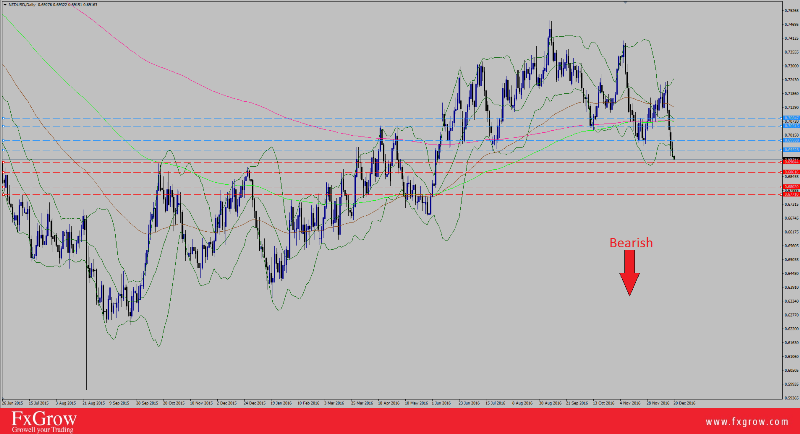
NZD Plunges on Stronger US Dollar, GDT in Mind
NZDUSD20-12%20investing_zpsnxqrmhp3.png


NZD/USD depreciates further more as US dollar continues to strengthen further more after Fed Rate hike. The pair extends bearish momentum for the fifth consecutive session, dropping from 0.7238 highs last Wednesday, landing on 0.6015 low today. Yesterday, ANZ business confidence was released with surplus of 1.2 to 20.5 in previous sessions but it didn't support NZD facing strong greenback. The main player on the ground still remains strong USD as the index managed to break the 103 level yesterday once again, currently trading at 103.19 intraday. Today, local GDT data will be released in the after noon with possibility of short-term-correction to support the Kiwi. The pair is currently trading 0.6919 intraday, below its weekly Pp 0.7049.

Trend: Bearish

Key levels to watch : Weekly Pp 0.7049

Resistance levels : R1 0.6952, R2 0.6993, R3 0.7051, R4 0.7084

Support levels : S1 0.6904, S2 0.6861, S3 0.6802, S4 0.6771

Remark : First today the GDT index to be released in the after noon, second q/q GDP tomorrow before midnight to give a further outlook for the New Zealand dollars.

For more in depth Research & Analysis please visit FxGrow.http://fxgrow.com/analysis-educatio...cal-analysis-fxgrow-free-forex-analysis-tools

Note: This analysis is intended to provide general information and does not constitute the provision of INVESTMENT ADVICE. Investors should, before acting on this information, consider the appropriateness of this information having regard to their personal objectives, financial situation or needs. We recommend investors obtain investment advice specific to their situation before making any financial investment decision.
 

Live Forex Chart

Currency
Rates
EUR / USD
1.12355
USD / JPY
158.015
GBP / USD
1.33280
USD / CHF
0.82593
USD / CAD
1.41575
EUR / JPY
177.538
AUD / USD
0.69510
Back
Top
Log in Register