FxGrow Support
Active Member
- Messages
- 1,073
- Joined
- May 6, 2015
- Messages
- 1,073
- Reaction score
- 2
- Points
- 25
FxGrow Daily Technical Analysis – 31st May, 2017
By FxGrow Research & Analysis Team
GBP/USD Technical Overview
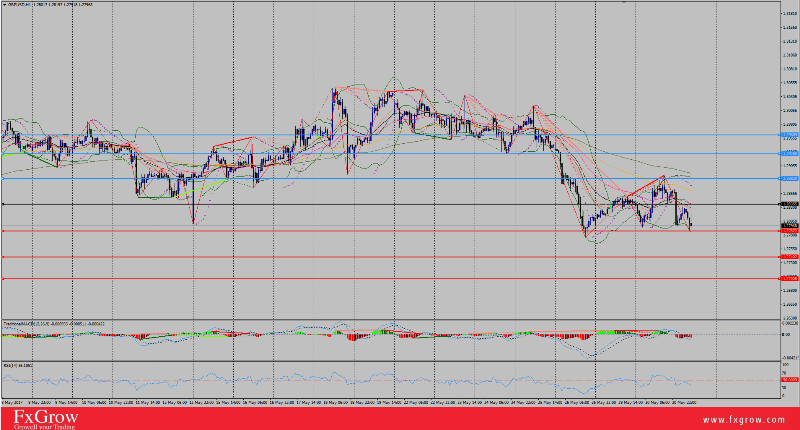
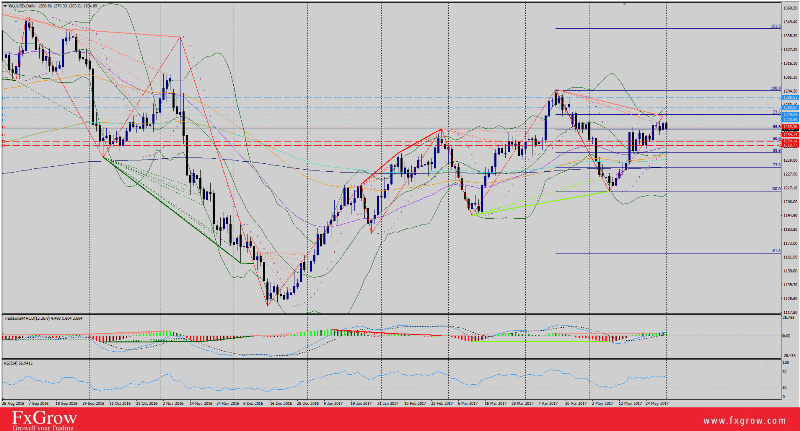
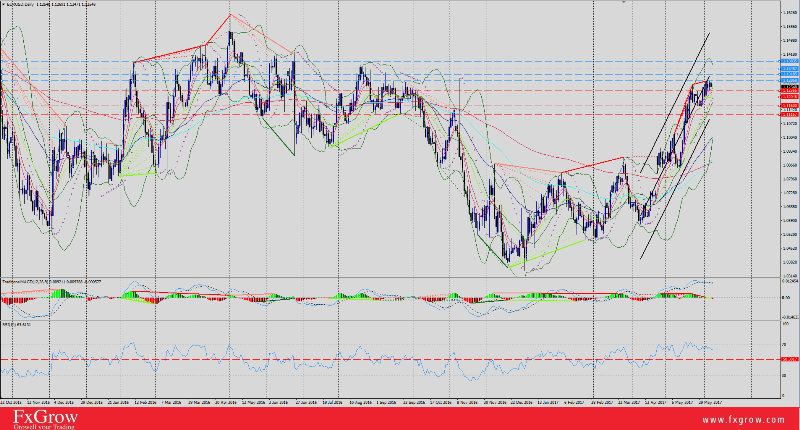
With absence of economic data on both Sterling and U.S Dollar, the pair should trade technically.
Trend: Bearish /Sideways (H1)
Pivot: 1.2835
Preferable scenario: Short positions below pivot 1.2835 holds further dips seeing 1.2787 (S1), in case of penetration next station should be 1.2740 (S2), then (S3) at 1.2700. (H1 supports)
The alternative case, if GBP/USD stayed above pivot 1.2835, expectations for further attacks at (R1) 1.2882 first. If (R1) failed, potentials for additional hikes seeing (R2) at 1.2925, next (R3) 1.2960. (H1 Resistances)
Comment: keep an eye on U.S Index levels, he upward potential is likely to be limited by the resistance at 1.2840.
MACD indicates bearish momentum (H1).
RSI indicates bearish momentum (H1).
For more in depth Research & Analysis please visit FxGrow.https://goo.gl/Xg0ZwG
Note: This analysis is intended to provide general information and does not constitute the provision of INVESTMENT ADVICE. Investors should, before acting on this information, consider the appropriateness of this information having regard to their personal objectives, financial situation or needs. We recommend investors obtain investment advice specific to their situation before making any financial investment decision.
By FxGrow Research & Analysis Team
GBP/USD Technical Overview
With absence of economic data on both Sterling and U.S Dollar, the pair should trade technically.
Trend: Bearish /Sideways (H1)
Pivot: 1.2835
Preferable scenario: Short positions below pivot 1.2835 holds further dips seeing 1.2787 (S1), in case of penetration next station should be 1.2740 (S2), then (S3) at 1.2700. (H1 supports)
The alternative case, if GBP/USD stayed above pivot 1.2835, expectations for further attacks at (R1) 1.2882 first. If (R1) failed, potentials for additional hikes seeing (R2) at 1.2925, next (R3) 1.2960. (H1 Resistances)
Comment: keep an eye on U.S Index levels, he upward potential is likely to be limited by the resistance at 1.2840.
MACD indicates bearish momentum (H1).
RSI indicates bearish momentum (H1).
For more in depth Research & Analysis please visit FxGrow.https://goo.gl/Xg0ZwG
Note: This analysis is intended to provide general information and does not constitute the provision of INVESTMENT ADVICE. Investors should, before acting on this information, consider the appropriateness of this information having regard to their personal objectives, financial situation or needs. We recommend investors obtain investment advice specific to their situation before making any financial investment decision.