BTC USD 82,932.5 Gold USD 4,194.30
Time now: Jun 1, 12:00 AM

Daily Technical Analysis by FxGrow

FxGrow Daily Technical Analysis – 17th May, 2017
By FxGrow Research & Analysis Team

Gold Initiated Daily Bullish Trend
2qnbm1s.jpg


As Gold penetrated 1239 100-EMA-D1, the yellow metal has officially launched the daily bullish momentum with expectations for additional gains in the coming hours and the coming days. Gold inaugurated Wednesday's trading sessions with $8.53 profits and 1245 high, and as U.S Dollar extended the bearish momentum with severe losses at 97.78 low, Gold should find comfort as Trump continues tanking U.S Index.
Fundamentals:

With absence of U.S Data today, and current situation of pale U.S Dollar, gold should behave technically today, but U.S internal politic events should always be taken into consideration as a stand-by spot news that could affect gold.

Technical Overview:

Trend: Bullish

Resistance levels: R1 1245.15, R2 1247.81, R3 1251.13 (H1)

Support levels: S1 1237.72, S2 1233.40, S3 1230.75 (H1)

Comment: Gold over passed 100-EMA but only a close above it keeps and sustains the daily bullish trend. A penetration with long positions for R1 level stretches bullish flags with a high pace seeing R2&R3 levels as target. The less preferred scenario, in case gold closes below 1239, then we can see a repetition of yesterday's trading scenario but dips seeing S2 as a destination, dips should fight fight S1 level. Gold is strong supported by a strong rising oblique trend line that prioritize bullish waves with higher highs.

MACD indicates a bullish trend.
RSI indicates a Bullish Trend.


For more in depth Research & Analysis please visit FxGrow.http://fxgrow.com/analysis-educatio...cal-analysis-fxgrow-free-forex-analysis-tools

Note: This analysis is intended to provide general information and does not constitute the provision of INVESTMENT ADVICE. Investors should, before acting on this information, consider the appropriateness of this information having regard to their personal objectives, financial situation or needs. We recommend investors obtain investment advice specific to their situation before making any financial investment decision.
 
FxGrow Daily Technical Analysis – 17th May, 2017
By FxGrow Research & Analysis Team

USD/JPY Plunges As U.S Index Clocks 2017-Fresh-lows
2ajc6ft.jpg


USD/JPY inaugurated Asian Trading Sessions with 78-pips price action and plunged to 112.34 low. As U.S Dollar extends current bearish momentum with 2017 fresh low at 97.78 low over U.S negative politics, Japanese Yen took advantage of current pale greenback as pulled USD/JPY lower and if U.S issues continue on such pace, expectations that the pair will dip lower, first as a reaction to U.S Dollar losses, second as the Yen tends to be a haven substitute when bad politics surrounds the rival greenback. Currently USD/JPY is trading 112.30 below 100-EMA-D1 at 112.56.

Japanese Revised Industrial Production showed a minor recovery earlier with -1.9% compared to -2.1% on previous session which added some "positive" push for USD/JPY to pull lower.

Fundamentals:

There are no data to be released by Japanese and U.S today, only politics in the U.S will play the bigger role. But tomorrow U.S Unemployment Claims at 12:30 PM GMT will affect U.S Dollar performance.

Technical Overview:

Trend: Bearish / Sideways

Resistance levels: R1 112.47, R2 112.73, R3 113.06

Support levels: S1 112.17, S2 111.78, S3 111.41

Comment: USD/JPY dropped below 100-EMA daily which suggest that market has turned bearish. A penetration cor S1 level will increase further selloffs seeing S2 as target. Closing above R1 brings back retracements seeing R2&R3 as target. Keep an eye on U.S Index levels + U.S Politics + U.S Data tomorrow is vital.

MACD indicates bearish momentum.

RSI indicates bearish momentum.

For more in depth Research & Analysis please visit FxGrow.http://fxgrow.com/analysis-educatio...cal-analysis-fxgrow-free-forex-analysis-tools

Note: This analysis is intended to provide general information and does not constitute the provision of INVESTMENT ADVICE. Investors should, before acting on this information, consider the appropriateness of this information having regard to their personal objectives, financial situation or needs. We recommend investors obtain investment advice specific to their situation before making any financial investment decision.
 
FxGrow Daily Technical Analysis – 17th May, 2017
By FxGrow Research & Analysis Team

Crude Oil Recoups Over OPEC's Positive Signs, Awaiting U.S Inventories
b8r50l.jpg


Fundamentals:

Crude Oil managed to reimburse $4.12 since last Monday where crude plunged to $45.52 bp, and today, oil clocked $49 high bp with failure to close above 200-EMA (D1) for three consecutive daily sessions, leaving daily trend to sideways with more tendency to bullish taking into consideration that oil has a support by a rising (H4) trend line.

Oil prices were highly fluctuated during May 2017 between U.S and OPEC with apposed interests keeping lower price (U.S) and higher price (OPEC).

U.S managed to plunge oil price over several consecutive API reports indicating a significant increase in U.S crude inventories, and this week some positive and promising signs were signaled by OPEC and particularly by Non-OPEC counties, as sharp response to the U.S.

Iraqi Prime Minister Haider al-Abadi said in a news conference broadcast on state TV late-Tuesday, Iraq is committed to reducing oil production to decrease a glut in the global market, and will support extending oil output cuts in line with any OPEC decision, Reuters reports. Russian compliance rate was estimated by 77%. Meanwhile, the OPEC’s compliance rate is 96%.

Russia and Saudi Arabia agreed earlier this week to prolong the output cut deal till March 2018 and along with, A proposal to extend an OPEC and non-OPEC supply cut for nine months is a positive idea, sources familiar with Iranian thinking said, suggesting OPEC's third-largest producer is likely to go along with such a plan if there is a consensus. Kuwait, a Gulf producer usually aligned with the Saudi OPEC view, said on Tuesday it supported the proposal. The Iranian position is less predictable, however, as it was the only OPEC member allowed to increase its output under the supply cut deal and holds presidential elections on Friday. (Reuters)

Today, U.S is due to release weekly crude inventories at 2:30 PM GMT which will settle oil levels technically, but fundamentally, OPEC efforts seems to be more fruitful with more bullish tendency as an impact. Currently U.S-Oil is trading 48.85 intraday.

Technical Overview:

Trend: Sideways

Resistance levels: R1 49.58, R2 50.43, R3 51.61

Support levels: S1 48.00, S2 47.00, S3 45.67

Comment: Closing above 49.00 confirms the bullish momentum. A penetration for R1 stretches additional bullish waves seeing R2&R3 destination. Closing above 49.00 is positive. Closing below S1 hold bearish setbacks and retracements as a reminder of 9th may lows. OPEC cut-deal should be a stand by motion as a spot news with major impact. Also, U.S Inventories will give a better perspective on how crude oil trend will behave.

MACD indicates bearish momentum but a penetration for R1 level will shift bullish.

RSI indicates Bullish momentum.

For more in depth Research & Analysis please visit FxGrow.http://fxgrow.com/analysis-educatio...cal-analysis-fxgrow-free-forex-analysis-tools

Note: This analysis is intended to provide general information and does not constitute the provision of INVESTMENT ADVICE. Investors should, before acting on this information, consider the appropriateness of this information having regard to their personal objectives, financial situation or needs. We recommend investors obtain investment advice specific to their situation before making any financial investment decision.
 
FxGrow Daily Technical Analysis – 18th May, 2017
By FxGrow Research & Analysis Team

EUR/USD Bullish Fever To Be Re-Tested Ahead of U.S Data
2hous5f.jpg


EUR/USD was on superb performance this week as the pair managed to rally +251-pips with new record for 2017 at 1.1172 high today. EU economic data was neutral bias yesterday as both CPI and Core CPI recorded zero change with both at 1.2% and 1.9% which leaves markets intrigued by the sudden intensive rising for pair. Currently EUR/USD trading 1.1135 as U.S Index shows some recovering symptoms but still remains week.

As U.S political tension continues to re-surface and tightening pace pulling greenback lower as U.S Index plunged today at 97.26 low, the pair found comfort with continuous depressing U.S Dollar levels. EUR/USD bullish momentum has to submit for final two ......

For more in depth Research & Analysis please visit FxGrow.https://goo.gl/zpU3sL

Note: This analysis is intended to provide general information and does not constitute the provision of INVESTMENT ADVICE. Investors should, before acting on this information, consider the appropriateness of this information having regard to their personal objectives, financial situation or needs. We recommend investors obtain investment advice specific to their situation before making any financial investment decision.
 
Last edited:
FxGrow Daily Technical Analysis – 18th May, 2017
By FxGrow Research & Analysis Team

Gold Bullish Trend Has One Final Test, US Data
2znoowz.jpg


Gold retreated to 1253.80 today as a lowest record, but managed to recoup losses with high pace at 1265 high, currently trading 1261.92 intraday. Gold is rising a strong bullish since yesterday with +342-pips as price action supported by weaker U.S Dollar performance as the Index bottomed at 97.26 2017-fresh-low.

Gold bullish momentum will be re-tested today as U.S releases unemployment claims, and in case gold closes below 1246, alerts will be signaled as XAUUSD failed to hold the rising trend, and .....

For more in depth Research & Analysis please visit FxGrow.https://goo.gl/WHNND0

Note: This analysis is intended to provide general information and does not constitute the provision of INVESTMENT ADVICE. Investors should, before acting on this information, consider the appropriateness of this information having regard to their personal objectives, financial situation or needs. We recommend investors obtain investment advice specific to their situation before making any financial investment decision.
 
FxGrow Daily Technical Analysis – 19th May, 2017
By FxGrow Research & Analysis Team

Gold Remains Bullish Despite Yesterday's Losses
rlazao.jpg


Gold was nursed yesterday with a dropping pressure at 1246 low, but still remains above 200-EMA (D1) by 80-pips, which sends a message that XAU/USD remains bullish despite severe losses yesterday -$19 after positive unemployment claims beating expectations.

U.S Dollar performance remained weak yesterday but managed to peek at 97.96 with +$0.6, but expectation were build for more point basis considering that U.S Index anchored yesterday at 79.26 2017-low which indicates U.S current political drama still tackling greenback rallies.

Technically, gold is currently trading 1245 after clocking 1252 high showing recovery symptoms. Still above 200-EMA and and ....

For more in depth Research & Analysis please visit FxGrow.https://goo.gl/tLyUb8

Note: This analysis is intended to provide general information and does not constitute the provision of INVESTMENT ADVICE. Investors should, before acting on this information, consider the appropriateness of this information having regard to their personal objectives, financial situation or needs. We recommend investors obtain investment advice specific to their situation before making any financial investment decision.
 
FxGrow Daily Technical Analysis – 19th May, 2017
By FxGrow Research & Analysis Team

USD/CAD Shows Stingy Price Action Over Crisp U.S Dollar
2wovnv7.jpg


Unlike major currencies seen taking advantage of weak greenback, the loonie traded with shy 45-pips price action today, currently at 1.3570 after retreating from 1.3610 high today. Although Crude Oil is currently bullish, but remaining below $50 bp slowed USD/CAD bearish forces as Canada as major oil producers.

In addition to that, the Trump administration on Thursday set the clock ticking toward a mid-August start of renegotiation's of the North American Free Trade Agreement with Canada and Mexico to try to win better terms for U.S. workers and manufacturers which gave some solid ground for greenback as uncertainties ....


For more in depth Research & Analysis please visit FxGrow.https://goo.gl/tLyUb8

Note: This analysis is intended to provide general information and does not constitute the provision of INVESTMENT ADVICE. Investors should, before acting on this information, consider the appropriateness of this information having regard to their personal objectives, financial situation or needs. We recommend investors obtain investment advice specific to their situation before making any financial investment decision.
 
FxGrow Daily Technical Analysis – 23rd May, 2017
By FxGrow Research & Analysis Team

EURO Toughens On Weak U.S Dollar Ahead of Local Data
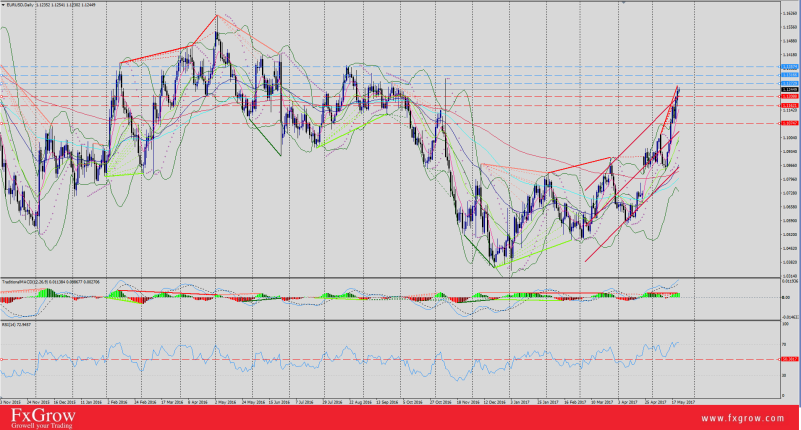
EURUSD_zpssgpzlfds.png


EUR/USD sustained the bullish momentum for 30 consecutive days, trading with +100-pips above its daily 7-EMA, and clocked a 1.1263 high yesterday, a peek the pair has not witnessed since Oct-2016. On the other hand, weakness in U.S Dollar as the Index plunged today to 96.68 low indicates the sharp tone of EURO facing its west rival greenback and EUR/USD still has potential to revenge with higher gains ahead of EU local data today.

Previous EU Data including PMI, CPI, and Retails sales were increasing session over session, but the main focus today will be on German Data, along with the increasing inflation, and ...


For more in depth Research & Analysis please visit FxGrow.https://goo.gl/PFykVr

Note: This analysis is intended to provide general information and does not constitute the provision of INVESTMENT ADVICE. Investors should, before acting on this information, consider the appropriateness of this information having regard to their personal objectives, financial situation or needs. We recommend investors obtain investment advice specific to their situation before making any financial investment decision.
 
FxGrow Daily Technical Analysis – 23rd May, 2017
By FxGrow Research & Analysis Team

Sterling Dips Slightly Over UK's Attack Ahead of Inflation Report
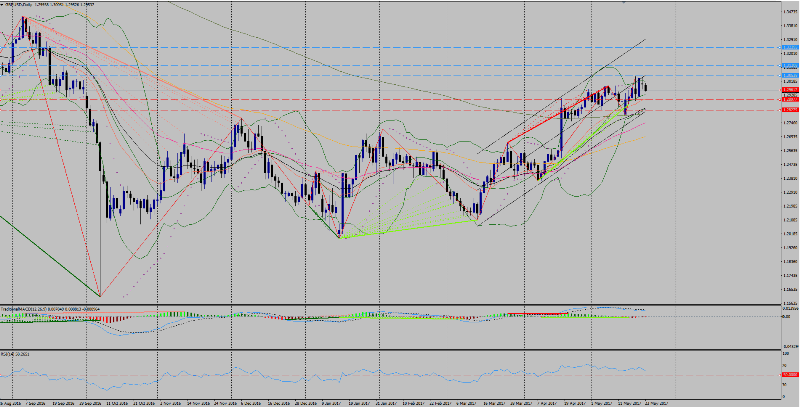
GBPUSD%20investing_zpsdw4r0loo.png


Yesterday. GBP/USD bullish momentum with a high 1.3034 supported by soft U.S Dollar tone was tanked by terrorist attack on the UK, tripping and erasing the daily +78-pips market action. The pair failed to withhold the 1300 level and anchored at 1.2965 low. Currently the pair is trading 1.2977, only +12-pips above yesterday's lows which indicates that yesterday's ugly events still has negative tails to Sterling current bearish pattern. On the other hand, U.S Dollar is showing some vital signs as the Index traders 96.90 after dipping to 96.74 low, but unless the Index penetrates 97.35 (Yesterday's high), greenback remains under pressure, giving room for Sterling take a breath and slow the bearish trend.

Away from politics, BOE Governor and several MPC members will testify testify today regarding inflation and the ...


For more in depth Research & Analysis please visit FxGrow.https://goo.gl/0VaV2d

Note: This analysis is intended to provide general information and does not constitute the provision of INVESTMENT ADVICE. Investors should, before acting on this information, consider the appropriateness of this information having regard to their personal objectives, financial situation or needs. We recommend investors obtain investment advice specific to their situation before making any financial investment decision.
 
FxGrow Daily Technical Analysis – 23rd May, 2017
By FxGrow Research & Analysis Team

Gold: Closing Above 1263 will Fuel Additional Bullish Waves
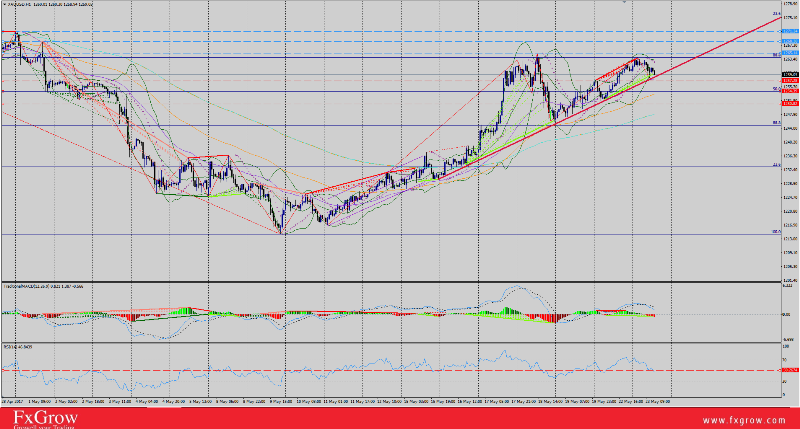
Gold_zps34w5w9g6.png


The hardest obstacle facing gold bullish with extension is today's high resistance located at 1263.80 and 1265. A resistance door which gold has knocked several times in the past two months with failure to penetrate and technically retreating, but fundamentals were always there for the help including safe haven and negative U.S Data interventions. But technical intakes with gold closing above daily 100 and 200 SMA at 1238 indicates that gold current trend is bullish supported by strong rising trend line, the yellow metal should overcome the 1265 with no hard time. Closing Above 1265, traders should prepare for themselves seeing gold on a jet ride with further inclines seeing 1280+ as a destination.

For more in depth Research & Analysis please visit FxGrow.https://goo.gl/FQJEvx

Note: This analysis is intended to provide general information and does not constitute the provision of INVESTMENT ADVICE. Investors should, before acting on this information, consider the appropriateness of this information having regard to their personal objectives, financial situation or needs. We recommend investors obtain investment advice specific to their situation before making any financial investment decision.
 

Live Forex Chart

Currency
Rates
EUR / USD
1.12030
USD / JPY
158.285
GBP / USD
1.32415
USD / CHF
0.82966
USD / CAD
1.42645
EUR / JPY
177.327
AUD / USD
0.69840
Back
Top
Log in Register