FxGrow Daily Technical Analysis – 18th March, 2016 By FxGrow Research & Analysis Team
OIL WTI - nearest target for upward movement is 43.20
Rebound at OIL WTI is in progress. After new low on 11 February, when price reached to 26.00 rebound occurred and it lasts for today. At chart we can indicate uptrend channel in which price is moving.
Note: This analysis is intended to provide general information and does not constitute the provision of INVESTMENT ADVICE. Investors should, before acting on this information, consider the appropriateness of this information having regard to their personal objectives, financial situation or needs. We recommend investors obtain investment advice specific to their situation before making any financial investment decision.
FxGrow Daily Technical Analysis – 21st March, 2016 By FxGrow Research & Analysis Team
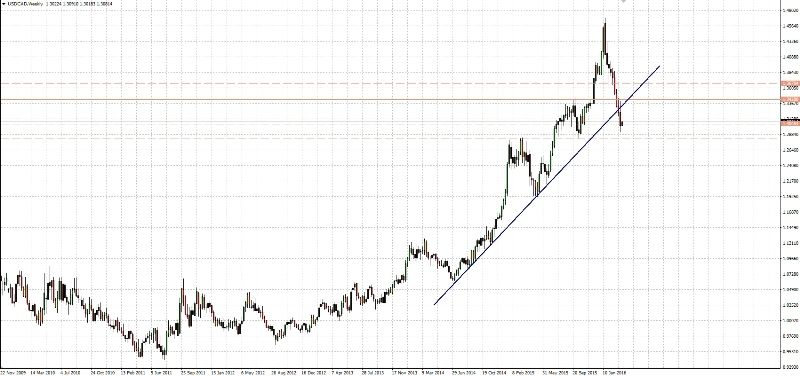
USDCAD at key level
USDCAD is continuing downward movement which was started in mid-January 2016. Currently further direction of the main uptrend is endangered. Because uptrend line was broken (that line was respected since 2012), return above 1.3200 - 1.3250 area should be treated as a bullish signal. It will inform that demand returned to the market.
Note: This analysis is intended to provide general information and does not constitute the provision of INVESTMENT ADVICE. Investors should, before acting on this information, consider the appropriateness of this information having regard to their personal objectives, financial situation or needs. We recommend investors obtain investment advice specific to their situation before making any financial investment decision.
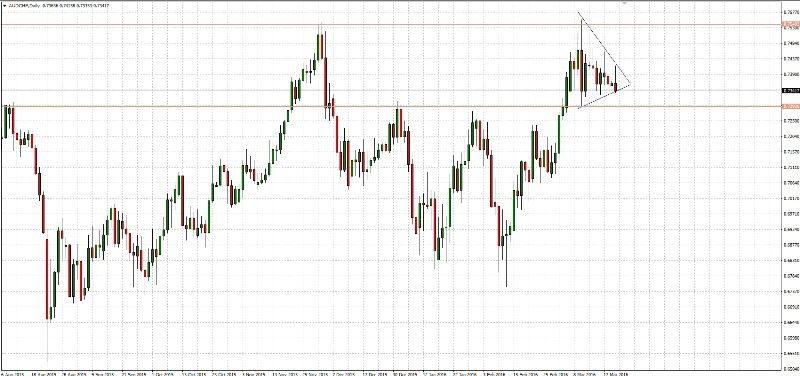
Since almost two weeks AUDCHF is moving inside a triangle. Its breakout will show further direction of price movement. It should occur soon because inside the triangle there is only 100 pips left (0.7330 - 0.7430 range).
Note: This analysis is intended to provide general information and does not constitute the provision of INVESTMENT ADVICE. Investors should, before acting on this information, consider the appropriateness of this information having regard to their personal objectives, financial situation or needs. We recommend investors obtain investment advice specific to their situation before making any financial investment decision.
FxGrow Daily Technical Analysis – 22nd March, 2016 By FxGrow Research & Analysis Team
GBPUSD - sharp decline after attack in Brussels
Current week began with declines at GBPUSD. Yesterday support at 1.4400 was broken below and today just after attack in Brussels dollar strengthened vs most of the currencies. GBPUSD broke below another support at 1.4300 and right now it is leading towards 1.4220 - 1.4150.
Note: This analysis is intended to provide general information and does not constitute the provision of INVESTMENT ADVICE. Investors should, before acting on this information, consider the appropriateness of this information having regard to their personal objectives, financial situation or needs. We recommend investors obtain investment advice specific to their situation before making any financial investment decision.
FxGrow Daily Technical Analysis – 22nd March, 2016 By FxGrow Research & Analysis Team
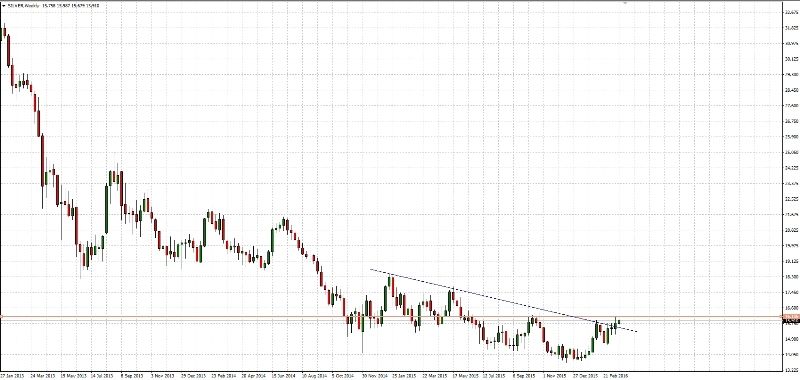
SILVER - downtrend line was broken at weekly time-frame
Today's terror at Brussels caused temporary volatility, which was corrected in next trading hours. On silver volatility was huge. After sharp upward movement in the morning, decline and rebound occurred which lead price to daily high.
At time-frame H1 we can see a bullish regression channel and lower limit of that channel is located at 15.40 area. Above that area there is 15.70 (current nearest support). It has to be noted that uptrend on silver continues since December 2015. Important level for demand is located at 116.10, after break above that level price should fast reach 10-months high.
Note: This analysis is intended to provide general information and does not constitute the provision of INVESTMENT ADVICE. Investors should, before acting on this information, consider the appropriateness of this information having regard to their personal objectives, financial situation or needs. We recommend investors obtain investment advice specific to their situation before making any financial investment decision.
FxGrow Daily Technical Analysis – 23rd March, 2016 By FxGrow Research & Analysis Team
GBPAUD - after short break price is continuing downward movement
Last week support at 1.8820 caused rebound which was finished just after two days and at the beginning of current week price returned to declines. Declines lasts since August 2015 and there wasn't any bigger rebound in this period. The support at 1.8820 yesterday was broken and today supply is trying to break another support (but weaker) at 1.8620.
Note: This analysis is intended to provide general information and does not constitute the provision of INVESTMENT ADVICE. Investors should, before acting on this information, consider the appropriateness of this information having regard to their personal objectives, financial situation or needs. We recommend investors obtain investment advice specific to their situation before making any financial investment decision.
FxGrow Daily Technical Analysis – 23rd March, 2016 By FxGrow Research & Analysis Team
EURUSD reached support at 1.1160 strengthened by Fibonacci 61,8%
Since last Thursday EURUSD is sliding down without any hints on the next movement. Declines are very small relative to some previous movements. Today price reached very interesting level, which has a chance to prepare field for a rebound. Mentioned level is 1.1160, it is support strengthened by Fibonacci 61,8% of previous upward movement (it was just after FED's meeting).
Note: This analysis is intended to provide general information and does not constitute the provision of INVESTMENT ADVICE. Investors should, before acting on this information, consider the appropriateness of this information having regard to their personal objectives, financial situation or needs. We recommend investors obtain investment advice specific to their situation before making any financial investment decision.
FxGrow Daily Technical Analysis – 24th March, 2016 By FxGrow Research & Analysis Team
USDJPY - rebound in progress
In last analysis I indicated the triangle pattern, as you can see it was broken down. After that declines accelerated, however once again support at 110.90 stopped them and caused rebound. Since the beginning of current week price is moving up and resistance at 111.70 was successfully broken.
Note: This analysis is intended to provide general information and does not constitute the provision of INVESTMENT ADVICE. Investors should, before acting on this information, consider the appropriateness of this information having regard to their personal objectives, financial situation or needs. We recommend investors obtain investment advice specific to their situation before making any financial investment decision.
FxGrow Daily Technical Analysis – 24th March, 2016 By FxGrow Research & Analysis Team
EURGBP - 16-months high
Since the beginning of December 2015 EURGBP moved in strong uptrend. Short correction which started one month ago probably was finished. New 16-months high confirms that correction was ended.
If price keeps standing above 0.7910 next important resistances will be located at 0.8000 and 0.8150 (strong resistance and long term downtrend line which connects highs since January 2009 coincide in this area).
Note: This analysis is intended to provide general information and does not constitute the provision of INVESTMENT ADVICE. Investors should, before acting on this information, consider the appropriateness of this information having regard to their personal objectives, financial situation or needs. We recommend investors obtain investment advice specific to their situation before making any financial investment decision.
FxGrow Daily Technical Analysis – 25th March, 2016 By FxGrow Research & Analysis Team
GBPCAD - support at 1.8540 stopped declines
Last week supply tried again to broke support at 1.8540 but that attempt failed. Since Wednesday rebound is in progress and upward movement should test at least 1.8830 area. If bulls will be strong enough even 1.9080 level may be tested. Currently there isn't any positive signs for bulls.
Note: This analysis is intended to provide general information and does not constitute the provision of INVESTMENT ADVICE. Investors should, before acting on this information, consider the appropriateness of this information having regard to their personal objectives, financial situation or needs. We recommend investors obtain investment advice specific to their situation before making any financial investment decision.