FxGrow Daily Technical Analysis – 09th March, 2016 By FxGrow Research & Analysis Team
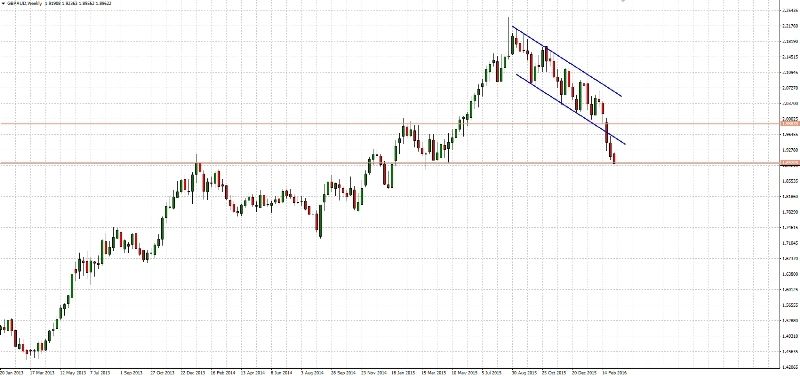
GBPAUD - after 5 weeks of falls it's time to look for the correction
GBPAUD falls since 5 weeks. Correction has to occur in all trends even in as strong as this. Current level give a chance that rebound may occur at the moment. Price reached support in 1.8970 - 1.8820 area. Of course you can't count on trend reversal, but some correction in such oversell price should occur. If price rebounds nearest target for falls will be at 1.9280.
Note: This analysis is intended to provide general information and does not constitute the provision of INVESTMENT ADVICE. Investors should, before acting on this information, consider the appropriateness of this information having regard to their personal objectives, financial situation or needs. We recommend investors obtain investment advice specific to their situation before making any financial investment decision.
FxGrow Daily Technical Analysis – 14th March, 2016 By FxGrow Research & Analysis Team
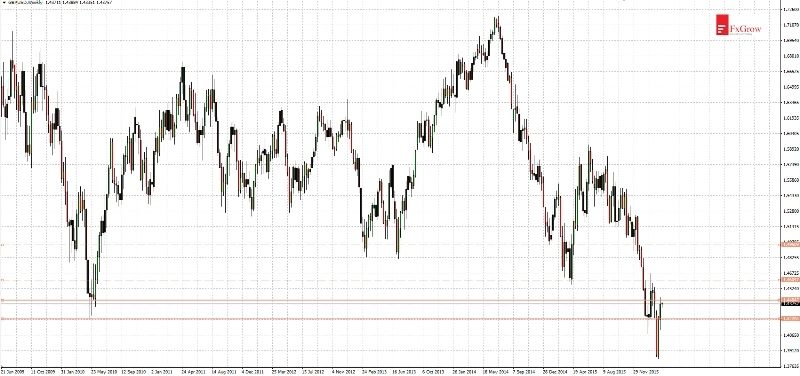
GBPUSD below important resistance
Upward movement at GBPUSD is in progress. In March situation is opposed that it was in February. In February we saw huge sell-off wave and in March price is continuing its rebound. Right now after two weeks of upward movement GBPUSD is starting below important resistance.
At charts below you can see that 1.4400 level was important in the past. This level stopped declines in 2010. It is likely that till next Wednesday (nearest FOMC meeting) price won't be very far from current level.
Note: This analysis is intended to provide general information and does not constitute the provision of INVESTMENT ADVICE. Investors should, before acting on this information, consider the appropriateness of this information having regard to their personal objectives, financial situation or needs. We recommend investors obtain investment advice specific to their situation before making any financial investment decision.
FxGrow Daily Technical Analysis – 14th March, 2016 By FxGrow Research & Analysis Team
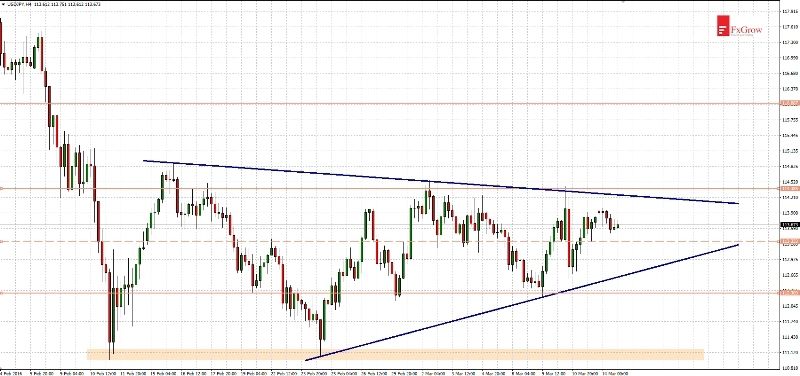
USDJPY - movement inside big triangle pattern
Since February 26 USDJPY is moving in side trend between levels 112.30 - 114.40. It has to be noted that volatility is decreasing and at time-frame H4 triangle pattern occurred. Currently lower limit of the triangle should be found at 112.60 and upper limit at 114.30. After breaking one of indicated levels, dynamic movement is expected.
Note: This analysis is intended to provide general information and does not constitute the provision of INVESTMENT ADVICE. Investors should, before acting on this information, consider the appropriateness of this information having regard to their personal objectives, financial situation or needs. We recommend investors obtain investment advice specific to their situation before making any financial investment decision.
FxGrow Daily Technical Analysis – 15th March, 2016 By FxGrow Research & Analysis Team
CADJPY - declines after BOJ meeting
On Tuesday there was a meeting of the Japanese central bank. BOJ didn't change anything - left interest rates and QE at current levels. Japanese Yen in reaction, strengthened to all of the currencies.
Declines at CADJPY wasn't a surprise. Since two weeks price moved below upper limit of the bullish regression channel. Yesterday we saw a rebound from resistance at 86.20. Target for declines should be 83.10 level. There coincides lower limit of the channel and support. On the way to indicated level there is a support at 84.30.
Note: This analysis is intended to provide general information and does not constitute the provision of INVESTMENT ADVICE. Investors should, before acting on this information, consider the appropriateness of this information having regard to their personal objectives, financial situation or needs. We recommend investors obtain investment advice specific to their situation before making any financial investment decision.
FxGrow Daily Technical Analysis – 15th March, 2016 By FxGrow Research & Analysis Team
EURUSD - silence before the storm, ahead of FOMC meeting
Price stabilized above 1.1070 level after huge volatility on the last Thursday. It was caused by ECB meeting. It's not the end of market's attractions because tomorrow there will be the FOMC meeting and decision about interest rates.
Note: This analysis is intended to provide general information and does not constitute the provision of INVESTMENT ADVICE. Investors should, before acting on this information, consider the appropriateness of this information having regard to their personal objectives, financial situation or needs. We recommend investors obtain investment advice specific to their situation before making any financial investment decision.
FxGrow Daily Technical Analysis – 16th March, 2016 By FxGrow Research & Analysis Team
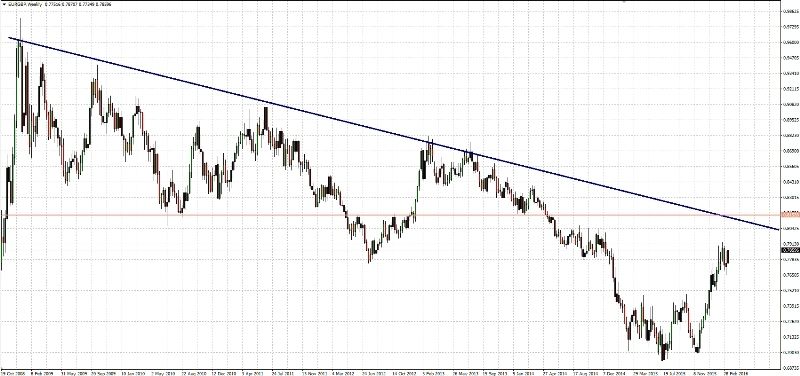
EURGBP highest since the beginning of march
Yesterday EURGBP broke above resistance at 0.7840. Upward movement may reach 0.7910 and next 0.8020 if demand won't fail. However if supply wins and price returns below 0.7840 nearest supports will be located at levels: 0.7710, 0.7610.
Note: This analysis is intended to provide general information and does not constitute the provision of INVESTMENT ADVICE. Investors should, before acting on this information, consider the appropriateness of this information having regard to their personal objectives, financial situation or needs. We recommend investors obtain investment advice specific to their situation before making any financial investment decision.
FxGrow Daily Technical Analysis – 16th March, 2016 By FxGrow Research & Analysis Team
EURPLN - uptrend line was broken
During last 2 months EURPLN felt 2400 pips. Previous upward movement from January 2016 was caused by the decision of Standard & Poor's agency, which unexpectedly cut Poland's credit rating. As you can see current declines shows that previous reaction on PLN was exaggerated.
Note: This analysis is intended to provide general information and does not constitute the provision of INVESTMENT ADVICE. Investors should, before acting on this information, consider the appropriateness of this information having regard to their personal objectives, financial situation or needs. We recommend investors obtain investment advice specific to their situation before making any financial investment decision.
FxGrow Daily Technical Analysis – 17th March, 2016 By FxGrow Research & Analysis Team
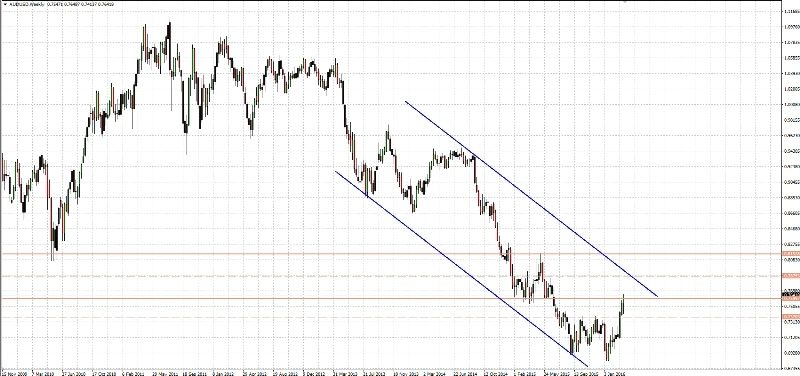
AUDUSD broke above resistance at 0.7600
Since two months there is a bull market on AUDUSD. Today price broke above resistance at 0.7600 and right now is leading to next resistance at 0.7880. Before test of indicated level it is likely that price will re-test 0.7600 again, but this time test will be from the top.
Note: This analysis is intended to provide general information and does not constitute the provision of INVESTMENT ADVICE. Investors should, before acting on this information, consider the appropriateness of this information having regard to their personal objectives, financial situation or needs. We recommend investors obtain investment advice specific to their situation before making any financial investment decision.
FxGrow Daily Technical Analysis – 17th March, 2016 By FxGrow Research & Analysis Team
EURUSD - fight at 1.1330 resistance area
EURUSD sharply moved up after FOMC meeting where Janet Yellen FED's chair was very dovish. For last 24 hours price moved up by 300 pips. So far high from February wasn't tested however it is a matter of time that level 1.1380 will be re-tested.
Note: This analysis is intended to provide general information and does not constitute the provision of INVESTMENT ADVICE. Investors should, before acting on this information, consider the appropriateness of this information having regard to their personal objectives, financial situation or needs. We recommend investors obtain investment advice specific to their situation before making any financial investment decision.
FxGrow Daily Technical Analysis – 18th March, 2016 By FxGrow Research & Analysis Team
GBPCAD new 10-months low
Since the beginning of the March GBPCAD moved up in correction. Rebound wasn't very strong because upward movement didn't reach even to Fibonacci 38.2% level. Correction finished on Wednesday when new low occurred. Yesterday price reacted at support and 1.8680 level has been defended.
Note: This analysis is intended to provide general information and does not constitute the provision of INVESTMENT ADVICE. Investors should, before acting on this information, consider the appropriateness of this information having regard to their personal objectives, financial situation or needs. We recommend investors obtain investment advice specific to their situation before making any financial investment decision.