FxGrow Daily Technical Analysis – 06th Nov, 2015 By FxGrow Research & Analysis Team
GBPUSD - macro data caused six-months low
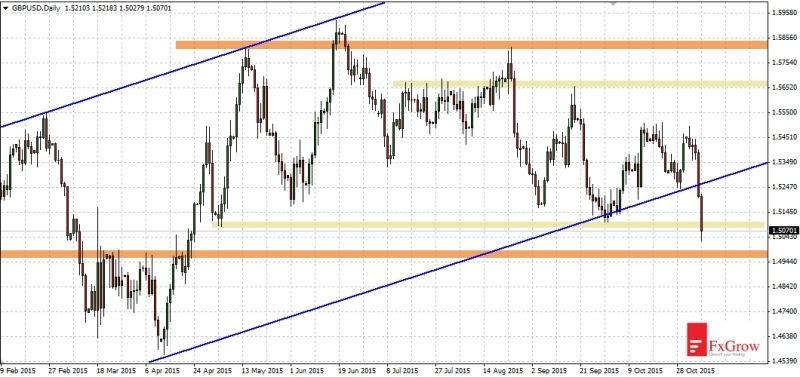
Yesterday dovish Bank Of England caused a breach of channel's low in which the price moved. Today's US non farm payrolls and employment data confirmed falls and after that GBPUSD break below first important support at 1.5100. Unemployment has fallen to 5%, which was one of the task of the FED. At this moment probability of the first rate hike in the US in December increased. The first level, which may cause rebound is 1.4980. Next support is 1.4800 and the next one is low of 2015 at 1.4560.
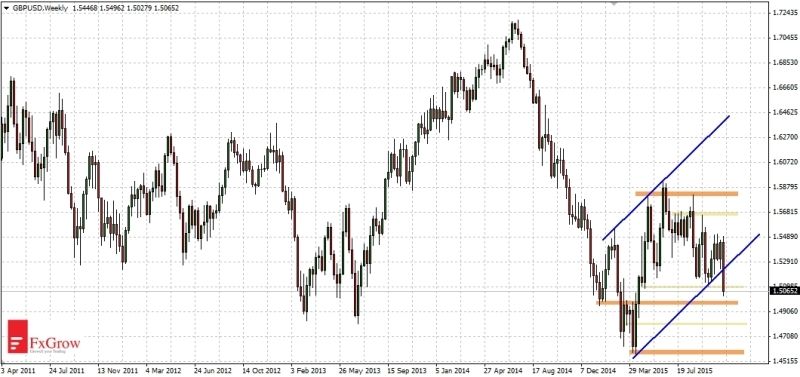
When we take a look at weekly interval, the situation is even more serious. Since the beginning of the year upward movement took form of flag, which suggests a continuation of previous trend. If price couldn't get back inside the flag, this year's lows will be under pressure of sellers. Upward movement, which took place from the beginning of the year, got the form of flag, which promises a continuation of the previous trend. If price cannot quickly get back inside the flag, then this year lows will find themselves under sellers pressure.
Note: This analysis is intended to provide general information and does not constitute the provision of INVESTMENT ADVICE. Investors should, before acting on this information, consider the appropriateness of this information having regard to their personal objectives, financial situation or needs. We recommend investors obtain investment advice specific to their situation before making any financial investment decision.
FxGrow Daily Technical Analysis – 09th Nov, 2015 By FxGrow Research & Analysis Team
USDJPY - the 2-months correction approaching to end
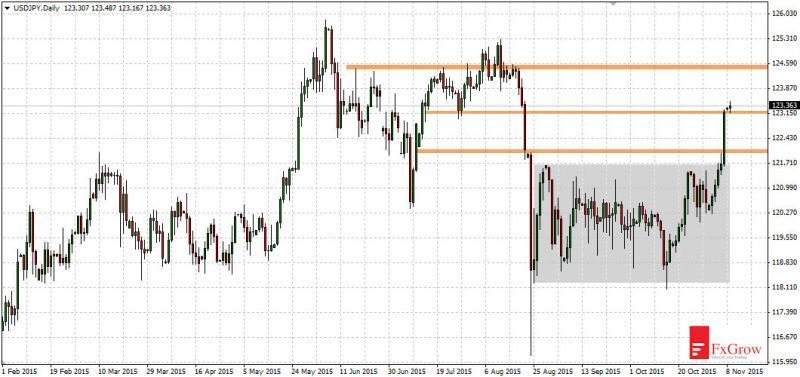
A very interesting situation on USDJPY. Since 2012, the price is in an uptrend. In June 2015 reached a high on 125.85 and a correction has started which lasted more than two months. Price moves in consolidation between the levels of 118.20 - 121.65. In last week was break above from pointed consolidation (such scenario I assumed in analysis at the beginning of November entitled: "correction may be already finished").
Today the price confirmed break above resistance at level 123.20 and upward movement continues. Next targets for demand are 124.50, 125.20 and 125.85 which is this year's high. After leaving on a new high strong resistance is at level 135.15 which is high from 2002 year. If there was correction of recent upward movement and price falls below levels 123.20 - 123.00 the nearest support that should cause rebound is at 122.00.
Note: This analysis is intended to provide general information and does not constitute the provision of INVESTMENT ADVICE. Investors should, before acting on this information, consider the appropriateness of this information having regard to their personal objectives, financial situation or needs. We recommend investors obtain investment advice specific to their situation before making any financial investment decision.
FxGrow Daily Technical Analysis – 09th Nov, 2015 By FxGrow Research & Analysis Team
EURJPY - consolidation before further declines
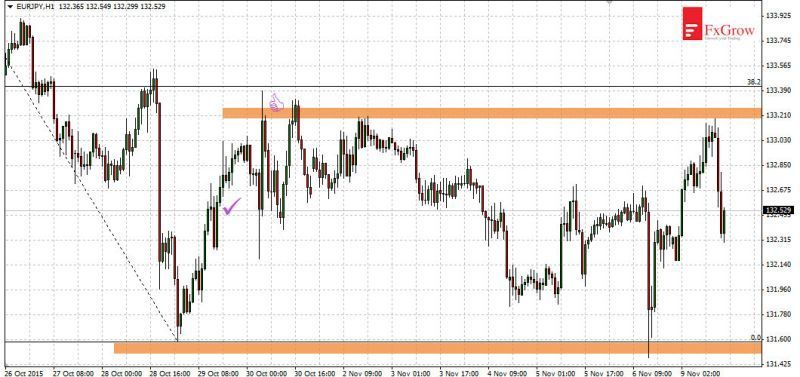
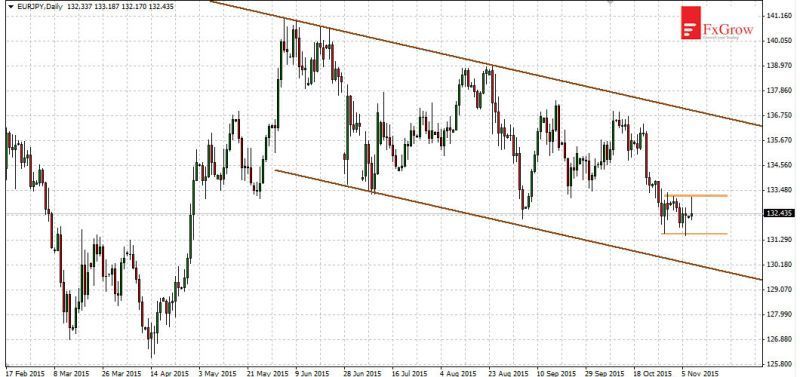
In analysis from October 29 I pointed that rebound which just started could be very weak. I wrote: "there is a rebound that may reach 133.15 and 134.00. Only moving back above the 133.15 and next to 135.00 give a chance of further EURJPY upward movement". And indeed the demand was trying to break above indicated resistance. Price reached 133.38 and there was a quick supply counterattack and last six months low has been deepened again.
In the coming days it is more likely that the price will move in the consolidation between the levels of 131.50 - 133.30. And next wave of falls after break below the lower limit of that consolidation. The European Central Bank seems very determined to weaken the euro. Falls can be noticeable on most currency pairs with the euro. If level 131.50 breaks, target of next falls is at 126.00 which is a 2015 low (showed on the D1 TF chart).
Note: This analysis is intended to provide general information and does not constitute the provision of INVESTMENT ADVICE. Investors should, before acting on this information, consider the appropriateness of this information having regard to their personal objectives, financial situation or needs. We recommend investors obtain investment advice specific to their situation before making any financial investment decision.
FxGrow Daily Technical Analysis – 10th Nov, 2015 By FxGrow Research & Analysis Team
EURCAD - broken below uptrend line
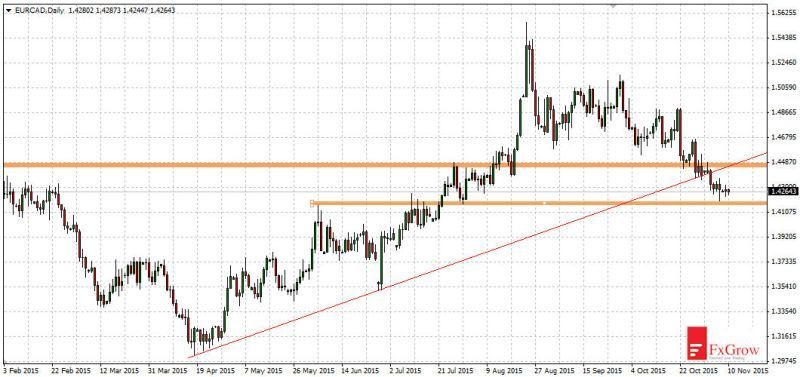
Since the top of the August 24 which EURCAD established at level 1.5560 continues the downward movement. At the level 1.4480 broke below was first support and already 60 pips below also the uptrend line that lasted from April 2015.
Declines have been stopped on the support, which is located in the area of 1.4200 - 1.4160. If this support will be break below downward movement should be very dynamic and will amount a minimum of 400 pips. The next support levels are located at: 1.3800, 1,3760, 1.3400, 1.3000. If upward movement will return the most difficult resistance for the demand will be at the level 1.4480. There is resistance and earlier uptrend line.
Note: This analysis is intended to provide general information and does not constitute the provision of INVESTMENT ADVICE. Investors should, before acting on this information, consider the appropriateness of this information having regard to their personal objectives, financial situation or needs. We recommend investors obtain investment advice specific to their situation before making any financial investment decision.
FxGrow Daily Technical Analysis – 10th Nov, 2015 By FxGrow Research & Analysis Team
EURUSD - below level 1.0700
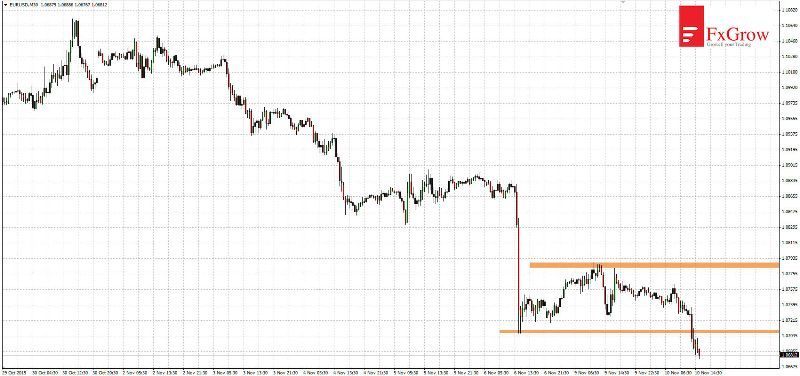
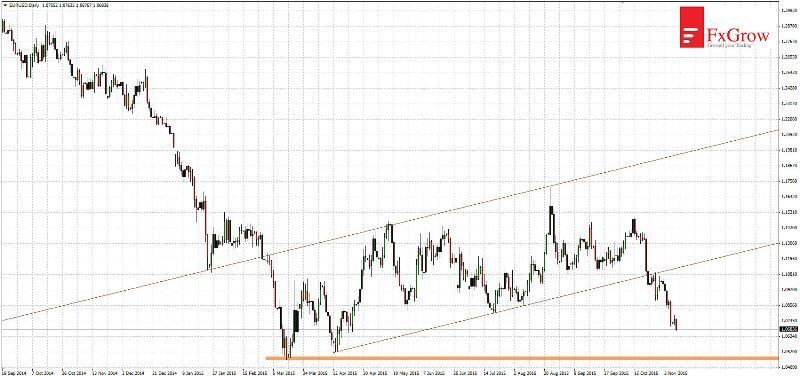
Since almost one moth EURUSD moves in a dynamic downtrend. During this time price fell 800 pips and there wasn't any correction. Falls are still supported by divergent behavior of a central banks. The European ECB intends to further ease the monetary policy, while US FED is more hawkish and perhaps as early as next month will raise interest rates first time in a decade.
Today EURUSD break below low from last week which was the support at level 1.0710. Testing this year low at 1.0460 seems to be a matter of time. If price rebounds earlier, the closest resistances will be at levels: 1.0710, 1.0790.
Note: This analysis is intended to provide general information and does not constitute the provision of INVESTMENT ADVICE. Investors should, before acting on this information, consider the appropriateness of this information having regard to their personal objectives, financial situation or needs. We recommend investors obtain investment advice specific to their situation before making any financial investment decision.
FxGrow Daily Technical Analysis – 11th Nov, 2015 By FxGrow Research & Analysis Team
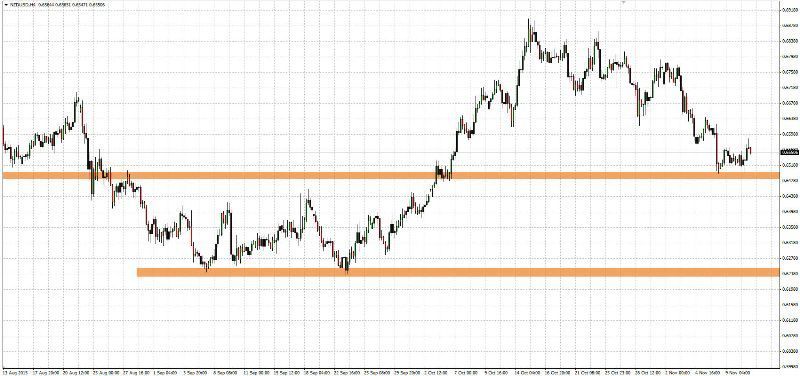
NZDUSD double bottom on support 0.6500
Last analysis of October 29 gave earn 160 pips. I wrote: "Last year on NZDUSD is a downtrend. Currently rebound reached to level fibo 38.2% and with strong trend price may now return to the declines" and "In the near future it is likely the second test of this support, and if the bears will be strong enough support will be broken below and falls may reach to the level of 0.6500".
For 4 days volatility is weaker on NZDUSD. Bulls will buy through the formation double bottom (shown on H4). However, the current consolidation is more likely to continue to fall, and rebound may be shallow. Due to the fact that the dollar strengthened against most currencies, and so far there is no indication that this trend was reversed. If support at 0.6500 will be broken next targets of falls are at levels 0.6240, 0.6015. Alternatively if rebound will be strong enough next strong resistances are at levels: 0.6630, 0.6710, 0.6900.
Note: This analysis is intended to provide general information and does not constitute the provision of INVESTMENT ADVICE. Investors should, before acting on this information, consider the appropriateness of this information having regard to their personal objectives, financial situation or needs. We recommend investors obtain investment advice specific to their situation before making any financial investment decision.
FxGrow Daily Technical Analysis – 12th Nov, 2015 By FxGrow Research & Analysis Team
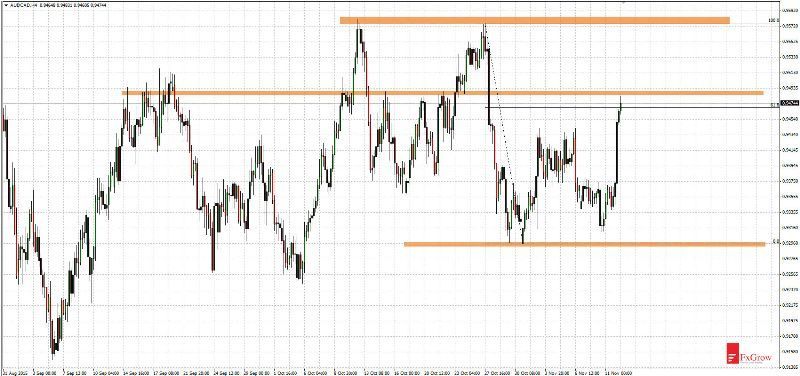
AUDCAD - dynamic upward movement reached Fibo 61,8%
AUDCAD moved very dynamically this morning. One 5 minute upward candle was 80 pips long. During this movement price break above resistance at 0.9440 and reached Fibo 61,8% level of last downward impulse. However before correction and potential falls, AUDCAD may test 0.9490. After break above this level target for the demand is at 0.9580, but fast break above is unlikely. If price rebounds, next supports will be located at: 0.9440, 0.9370, 0.9290.
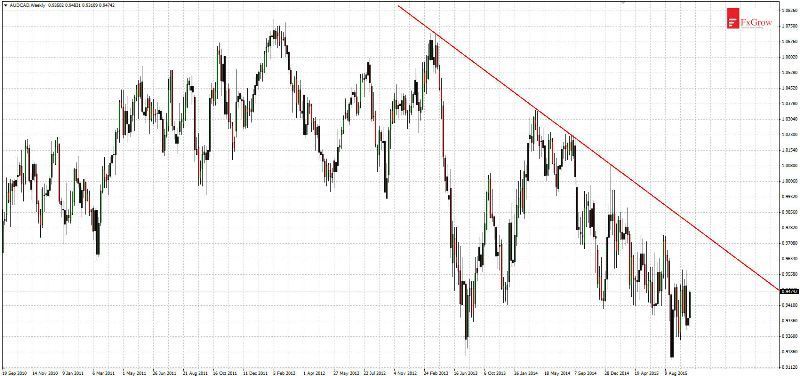
Wider view, time-frame W1
From September 2015 bottom (0.9150) AUDCAD moves in a weak uptrend. However in a long term since 2012 when price was at 1.0785 it constantly falls, forming lower highs and lower lows. Therefore, in the long term new lows are more likely than a trend change.
Note: This analysis is intended to provide general information and does not constitute the provision of INVESTMENT ADVICE. Investors should, before acting on this information, consider the appropriateness of this information having regard to their personal objectives, financial situation or needs. We recommend investors obtain investment advice specific to their situation before making any financial investment decision.
FxGrow Daily Technical Analysis – 12th Nov, 2015 By FxGrow Research & Analysis Team
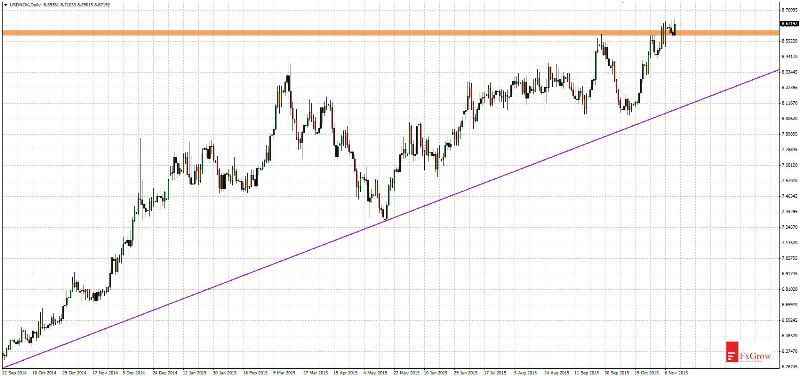
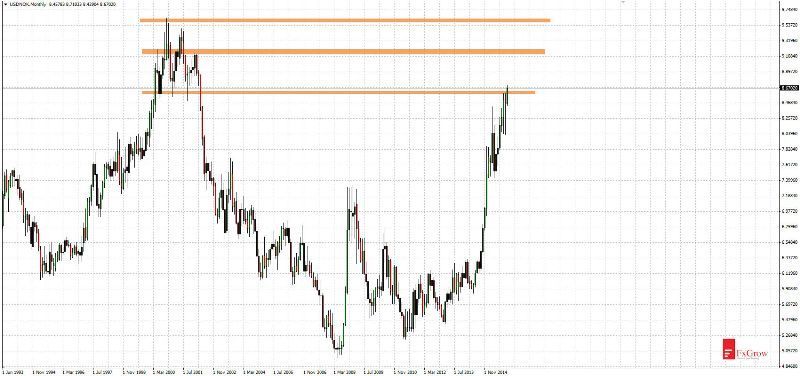
USDNOK - on 13-years high
Today USDNOK reached 13-years high. It happened thanks to break above resistance at 8.6000 which took place last week. Demand couldn't break above that level in October. The next strong resistances that can stop the current upward movement are at levels of 9.2000, 9.6200. Alternatively if correction start, nearest supports level are at 8.6000, 8.4300.
Wider view, time-frame Monthly
USDNOK moves almost in vertical uptrend since 2013. During this time the price has appreciated from level 5.4350 to 8.7100. Correction which was in second Quarter of 2015 reached only fibo 38,2% and upward movement continues.
Note: This analysis is intended to provide general information and does not constitute the provision of INVESTMENT ADVICE. Investors should, before acting on this information, consider the appropriateness of this information having regard to their personal objectives, financial situation or needs. We recommend investors obtain investment advice specific to their situation before making any financial investment decision.
FxGrow Daily Technical Analysis – 13th Nov, 2015 By FxGrow Research & Analysis Team
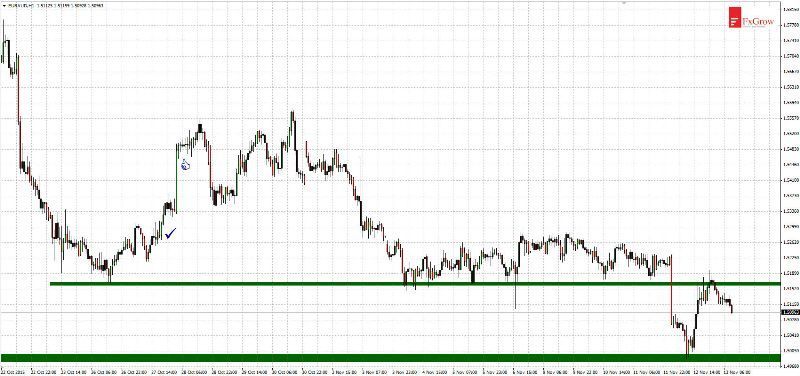
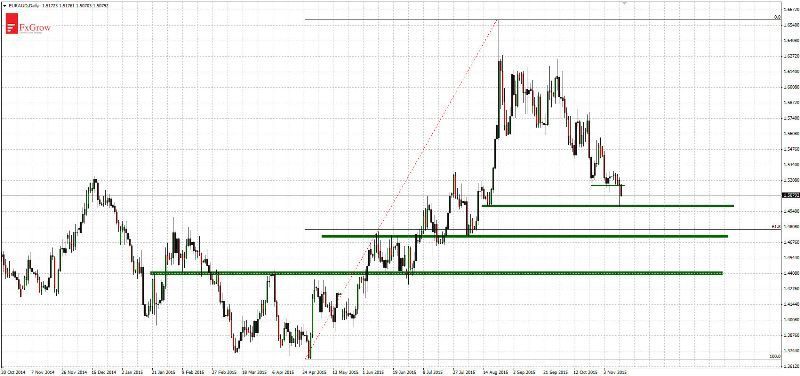
EURAUD - movement in direction of 1.5000
In analysis of October 27 I pointed impending correction and further return to decline. I wrote: "At the moment rebound may appear near 1.5420. After that there should be a continuation of falls". There have been a rebound that was even stronger because it reached 1.5576, then returned to the EURAUD decline.
Today support at 1.5150 was break below and downward movement is continuing in direction of level 1.5000. This support has a chance to cause rebound, if it happened target of upward movement will be first 1.5150 and second 1.5285. After break below support at 1.5000 target of falls will be 1.4730, 1.4400. On level 1.4780 is fibo 61,8% of upward movement which lasted from April to August of 2015. Therefore levels 1.4730 - 1.4780 give a chance to finish the current declines.
Note: This analysis is intended to provide general information and does not constitute the provision of INVESTMENT ADVICE. Investors should, before acting on this information, consider the appropriateness of this information having regard to their personal objectives, financial situation or needs. We recommend investors obtain investment advice specific to their situation before making any financial investment decision.
FxGrow Daily Technical Analysis – 13th Nov, 2015 By FxGrow Research & Analysis Team
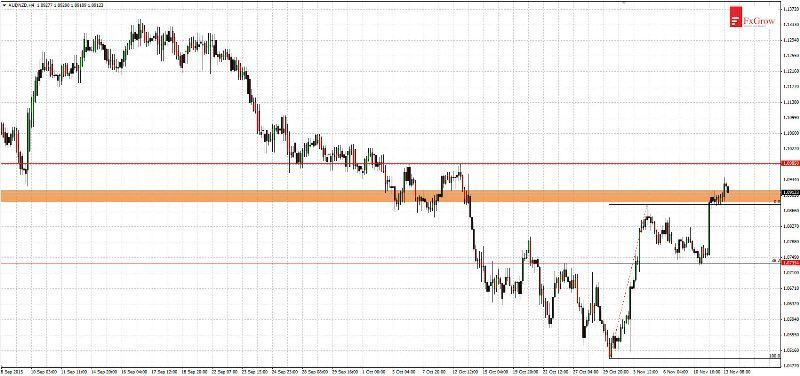
AUDNZD - break above resistance at 1.0900
On October 30 AUDNZD reached low at 1.0496, since then the price moves in an upward trend. Upward movement has been corrected in previous days of 38,2% which is a basic Fibonacci level. Currently price is trying to return to uptrend. AUDNZD reached to a strong resistance. So rapid break above should be unsuccessful. By four months before that resistance at 1.0900 has stopped falls. This resistance is reinforced by fibo 50% of downward movement from the period of September - October 2015.
If there will be a rebound falls should reach the level of 1.0730. If break above 1.0900 proves successful the next resistance level is 1.0980.
Note: This analysis is intended to provide general information and does not constitute the provision of INVESTMENT ADVICE. Investors should, before acting on this information, consider the appropriateness of this information having regard to their personal objectives, financial situation or needs. We recommend investors obtain investment advice specific to their situation before making any financial investment decision.