FxGrow Daily Technical Analysis – 01st Sept, 2015 By FxGrow Research & Analysis Team
GBPAUD - easy it's only break before upward movement
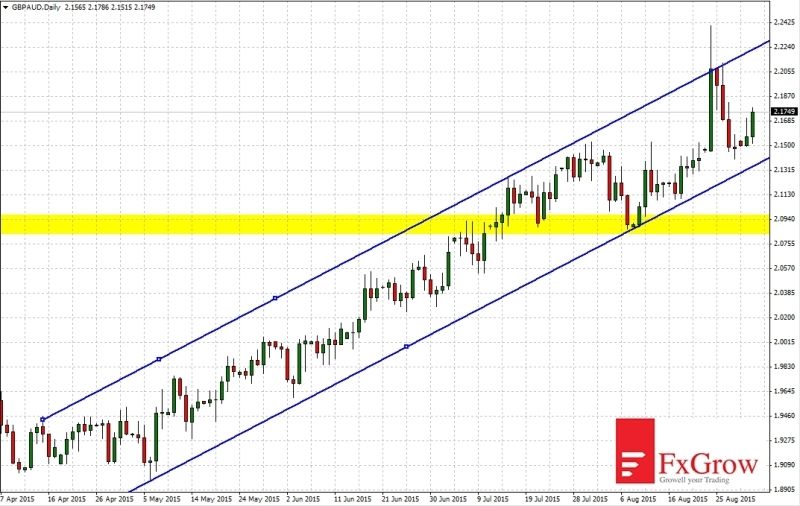
Since March 2013 GBPAUD moves in the upward movement. In early July price broke up resistance and in August was re-test. Since April 2015 GBPAUD is moving in the upward channel. Last Monday attempt to leave the channel top failed. As a result, this caused the descent to the bottom of the channel.
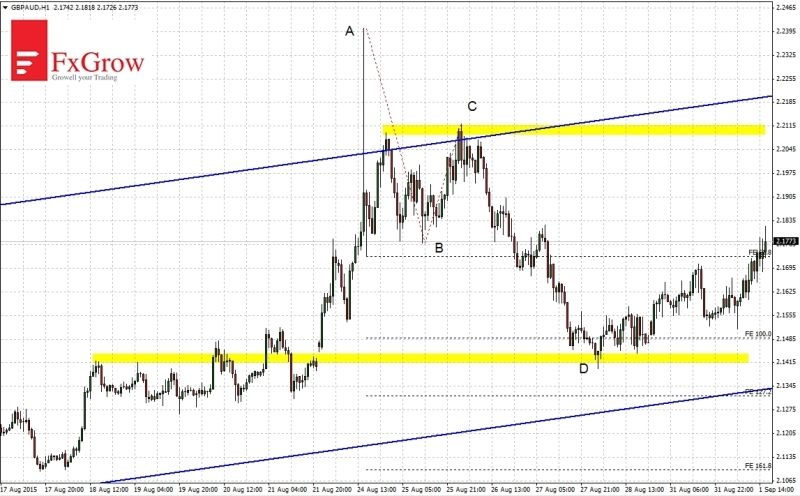
H1 Time-frame
Descent that took place in last week took the form of a simple correction ABCD and fall in the GBPAUD stopped the 2.1420 level. For the bulls there will be a strong resistance level of 2.2100. In the short term resistance should be broken and upward movement continues.
Note: This analysis is intended to provide general information and does not constitute the provision of INVESTMENT ADVICE. Investors should, before acting on this information, consider the appropriateness of this information having regard to their personal objectives, financial situation or needs. We recommend investors obtain investment advice specific to their situation before making any financial investment decision.
FxGrow Daily Technical Analysis – 02nd Sept, 2015 By FxGrow Research & Analysis Team
EURUSD fibo 78,6% stopped the descent
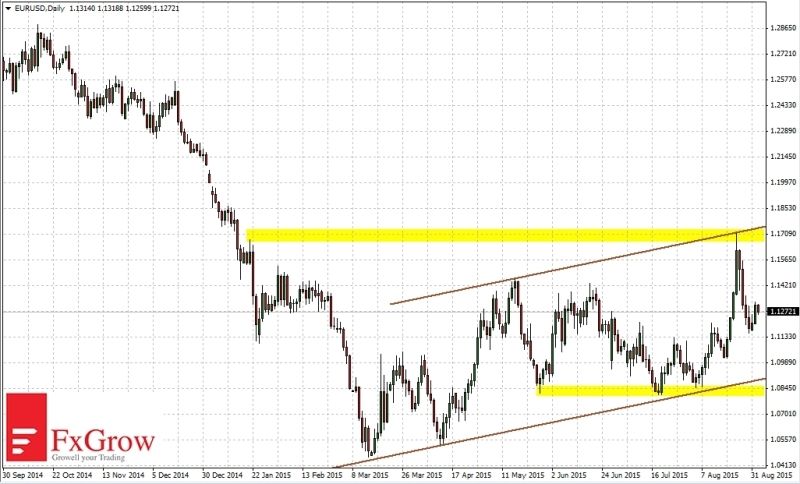
EURUSD rebound from top of the upward channel, additionally 1.1700 level is a resistance chich price were seen in January 2015. Currently EURUSD is in the middle of the channel. At the level 1.0850 is a lower limit of the channel and a resistance.
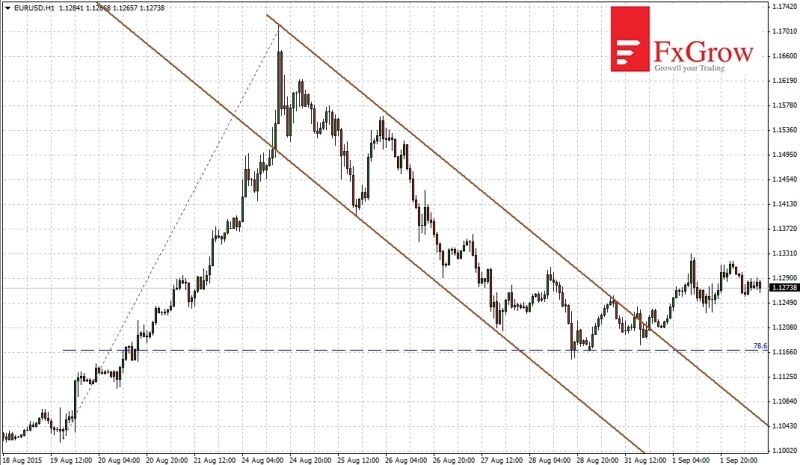
H1 Time-frame
After descent from 1.1700 level fibo 78,6% stopped the fall. The descent took a form of a downward channel and if Friday upper limit of the channel was break. Price stabilized around the 1.1280 level. Currently move up is more likely. Alternatively broke lower limit from the last week will lead price to 1.0850.
Note: This analysis is intended to provide general information and does not constitute the provision of INVESTMENT ADVICE. Investors should, before acting on this information, consider the appropriateness of this information having regard to their personal objectives, financial situation or needs. We recommend investors obtain investment advice specific to their situation before making any financial investment decision.
FxGrow Daily Technical Analysis – 02nd Sept, 2015 By FxGrow Research & Analysis Team
EURCAD - it's not the end of falls
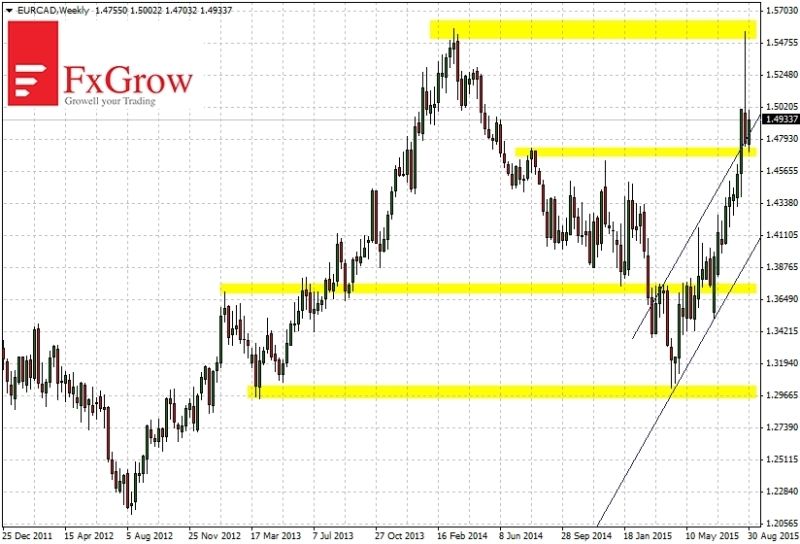
EURCAD for last 4 months moves in a upward trend. Movement forms trend channel which was break up 3 weeks ago. Last week after re-test of the resistance 1.5560, price move down. Currently is on the border of the upper limit channel and support on level 1.4720. If bulls will capitulate, there is possible move to around 1.4000.
H1 Time-frame
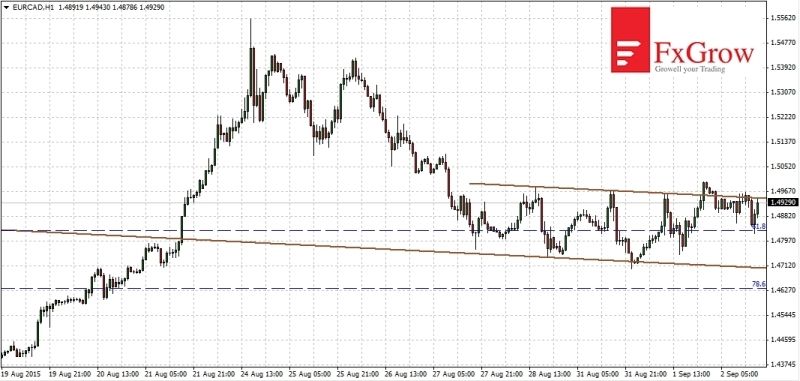
After fast move up in last week there has been a return movement which correct more than 61,8%. EURCAD at the same time created a channel in which it moves. Tonight was a failed attempt to go top of the channel, after which there was a move down. It is possible that the price will test the lower limit of the channel 1.4707. If the bears will continue the push the next target will be fibo 78,6% (level 1.4640).
Note: This analysis is intended to provide general information and does not constitute the provision of INVESTMENT ADVICE. Investors should, before acting on this information, consider the appropriateness of this information having regard to their personal objectives, financial situation or needs. We recommend investors obtain investment advice specific to their situation before making any financial investment decision.
FxGrow Daily Technical Analysis – 03rd Sept, 2015 By FxGrow Research & Analysis Team
USDJPY - important resistance began a correction?
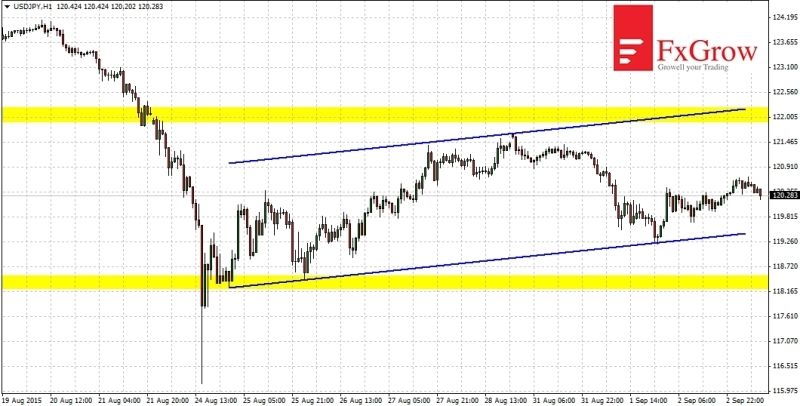
High volatility in USDJPY took place on 20-24 August where was a drop from 124.00 to 116.13. Currently it settled down and price for more than a week moves in a flat upward channel. Nearby intraday support is on 118.40 and resistance 122.00. After break one of them a further target is above-mentioned extreme.
Time-frame M1
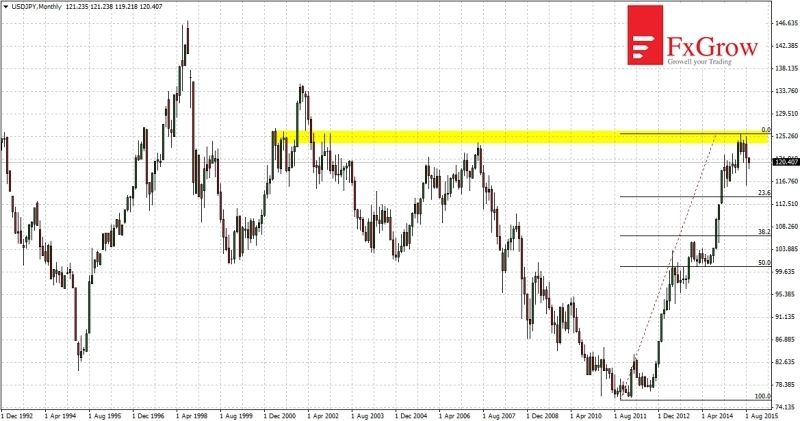
USDJPY is moving in an upward trend. The level 125.80 which stops further upward movement is a major resistance. It already stopped trend in the years 2001, 2002 and 2007. There is a probability of correction because there wasn't any since three years. If the last drop will be a beginning of the correction the minimum level of falls is 38.2% fibo (106.60 level).
Note: This analysis is intended to provide general information and does not constitute the provision of INVESTMENT ADVICE. Investors should, before acting on this information, consider the appropriateness of this information having regard to their personal objectives, financial situation or needs. We recommend investors obtain investment advice specific to their situation before making any financial investment decision.
FxGrow Daily Technical Analysis – 03rd Sept, 2015 By FxGrow Research & Analysis Team
AUDCAD - breached two years support
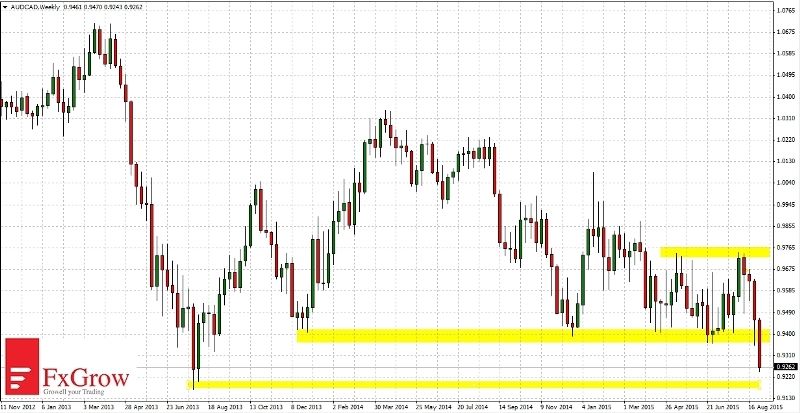
After fourth test of support on level 0.9400 bears reached its purpose and support was breached. The price was so low last time in August 2013. At the same time there's only 100 pips left to the next support. Its breakthrough could lead price to a level 0.8600 and below. After a bounce, level of 0.9400 will be resistance to upward movement. Next resistance is 0.9740.
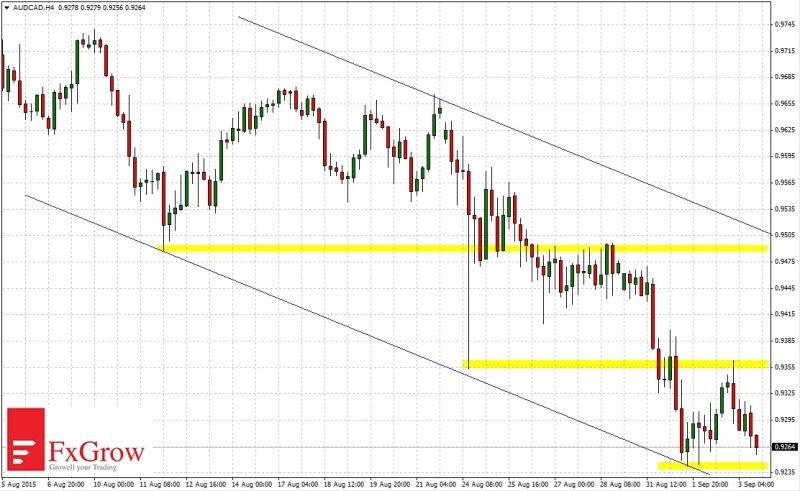
Time-frame H4
Downward trend on AUDCAD for a month took the form of a channel. The lower limit of the channel has been tested od Tuesday and since then the price is trying to bounce back. If the bulls break through resistance at 0.9360 this bounce may lead price to 0.9500, where is another resistance and the upper limit of the downward channel.
Note: This analysis is intended to provide general information and does not constitute the provision of INVESTMENT ADVICE. Investors should, before acting on this information, consider the appropriateness of this information having regard to their personal objectives, financial situation or needs. We recommend investors obtain investment advice specific to their situation before making any financial investment decision.
FxGrow Daily Technical Analysis – 04th Sept, 2015 By FxGrow Research & Analysis Team
EURGBP breakout from the consolidation will indicate the direction
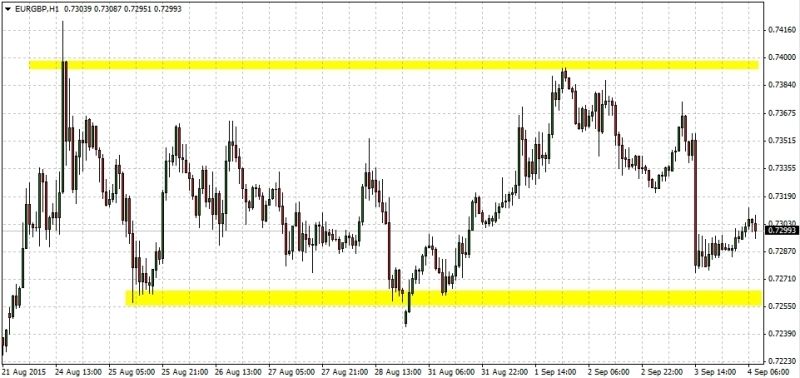
For more than a week EURGBP moves in consolidate between 0.7394 and 0.7260. Yesterday at the press conference ECB President Mario Draghi euro depreciated against other currencies and is also clearly visible on the chart with the pound. Drop wasn't deep enough to breach the support. Currently only breakout one of indicated levels should start longer movement.
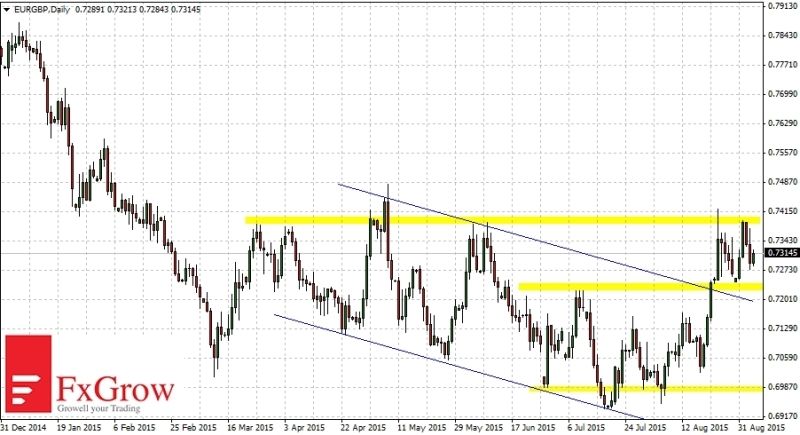
Time-frame D1
In August EURGBP left downward channel and now 6-month resistance at 0.7390 effectively stops the aspirations of the bulls. If it had been broken the support 0.7220 that the price will return to the inside of the downward channel and it will move towards the July low. Price moves in a downward trend, and the current rally should be seen more as a rebound than changing the long-term downtrend. Alternatively, if bulls could break the resistance the target of upward movement will be 0.7760.
Note: This analysis is intended to provide general information and does not constitute the provision of INVESTMENT ADVICE. Investors should, before acting on this information, consider the appropriateness of this information having regard to their personal objectives, financial situation or needs. We recommend investors obtain investment advice specific to their situation before making any financial investment decision.
FxGrow Daily Technical Analysis – 04th Sept, 2015 By FxGrow Research & Analysis Team
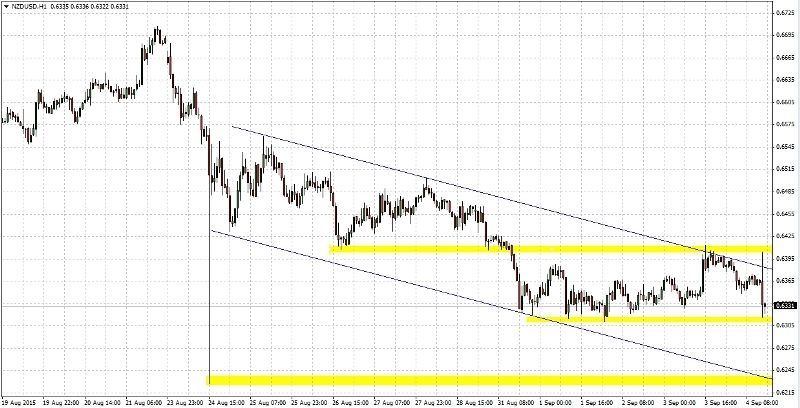
NZDUSD - support is broken, target of falls 0.5900
NZDUSD for nearly two weeks is moving in a downward channel. Today there was an attempt to leave top of the channel but ended on a false breaking. On the chart appeared a long upper shadow and a red candle. It may end by the test of the lower limit of the channel at 0.6230 where there is also a minimum of 24 August. First bears must break the next support on level 0.6310.
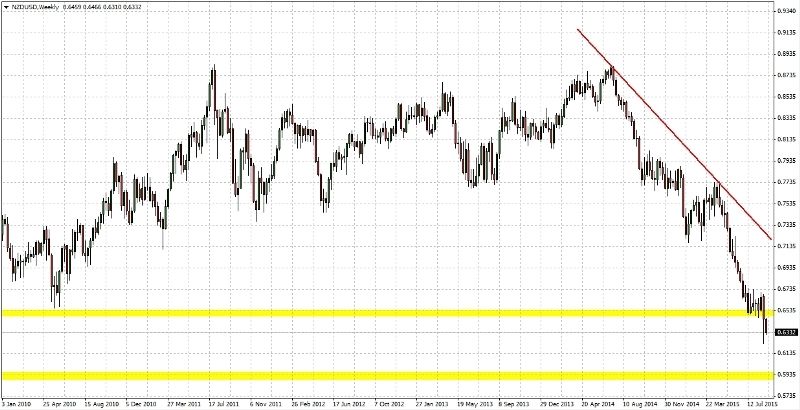
Time-frame W1
NZDUSD for a year is moving in a strong downtrend and it looks like that falls will be continued. Seven weeks has lasted consolidation at support level 0.6500. So long impotence of bulls to perform bounce has to end broken of support. So it happened and support has been broken. Last week's minimum may cause slight rebound, but the next strong support is at 0.5900. That should be a target to bears which will allow for a longer rebound.
Note: This analysis is intended to provide general information and does not constitute the provision of INVESTMENT ADVICE. Investors should, before acting on this information, consider the appropriateness of this information having regard to their personal objectives, financial situation or needs. We recommend investors obtain investment advice specific to their situation before making any financial investment decision.
FxGrow Daily Technical Analysis – 07th Sept, 2015 By FxGrow Research & Analysis Team
EURAUD - breakout from the consolidation that lasted for three years
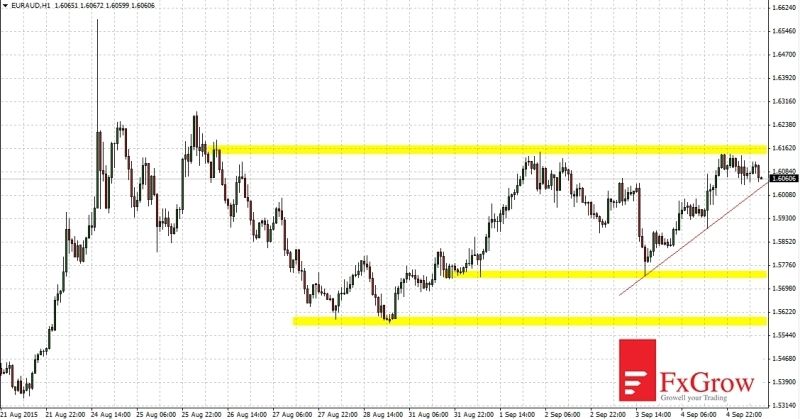
EURAUD on hourly interval approached to the resistance level at 1.6150. After his breakthrough nearest target will be 1.6585 which is a maximum of 24 August. The trend is upward (confirmed with the red line on the graph H1 and breakout from the consolidation on W1 chart). Any descent of pointed resistance should not be too deep because the bears will have to overcome several suport levels. Key support is at 1.5600.
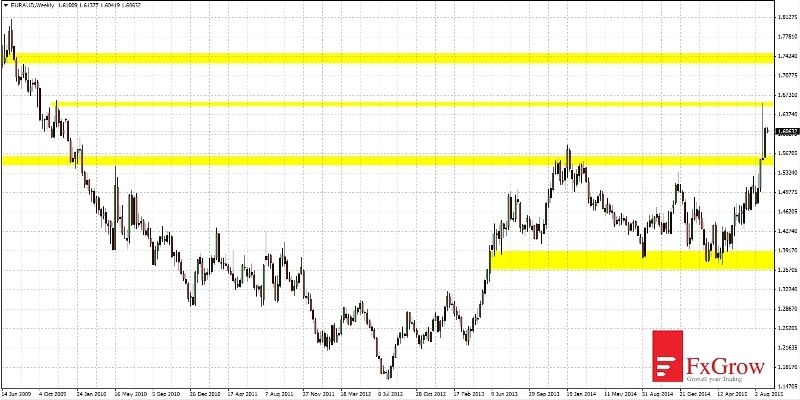
Time-frame W1
Two weeks ago resistance that stopped move up for more than 2 years was broken. Long candle PIN BAR looks like fakey, but last week's candle confirmed the move up. August 24 the price has tested level which has not been since 2009 and return of the bulls to that level is a matter of time. After breakout the level 1.6585 next target will be at 1.7400.
Note: This analysis is intended to provide general information and does not constitute the provision of INVESTMENT ADVICE. Investors should, before acting on this information, consider the appropriateness of this information having regard to their personal objectives, financial situation or needs. We recommend investors obtain investment advice specific to their situation before making any financial investment decision.
FxGrow Daily Technical Analysis – 08th Sept, 2015 By FxGrow Research & Analysis Team
AUDJPY it's time for a rebound
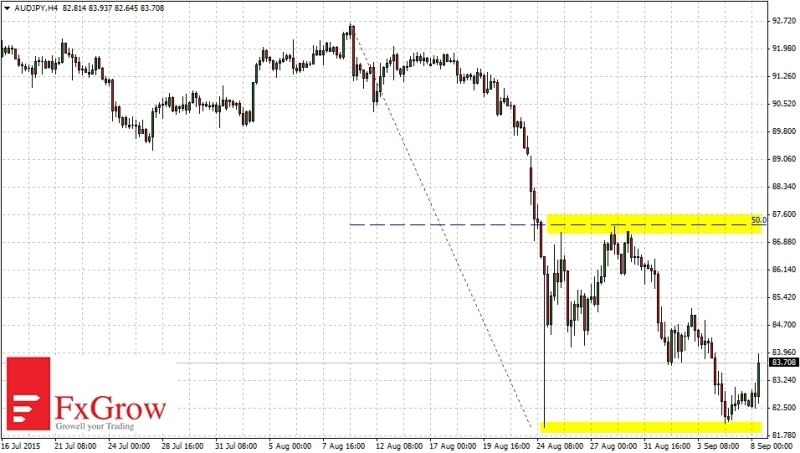
In July and August AUDJPY moved in consolidation between the levels of 89.15 - 92.65. Break below pointed minimum of 24 August triggered a sharp move down. On the same day AUDJPY started to rebound, which achieved 50% of last downward move. August 24th bottom at the level of 82.00 was tested again last Friday. Rebound can be weak and successful pressure of the bears on level 82.00 will move down to the next support of 79.50.
Alternatively, if the bears will not aggressively push this rebound may come to the last resistance level at 87.30 and only there return to the declines.
Time-frame H1
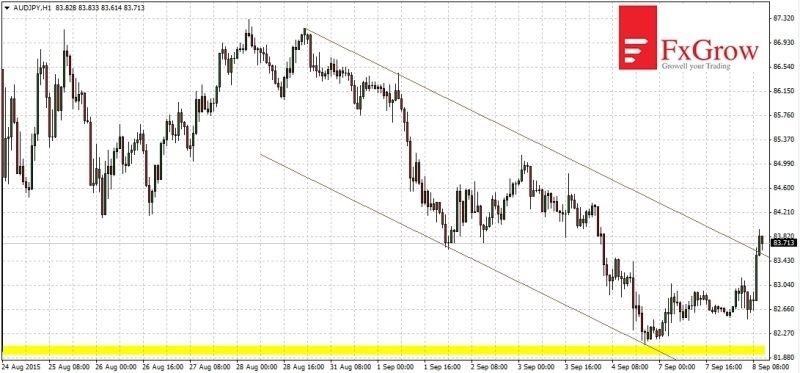
For two weeks AUDJPY is moving in a downward channel. The lower limit of the channel was tested on Friday and rebounded. Today AUDJPY broke above upper limit of the channel. If this break was fakey last minimums will be again under pressure of sellers.
Note: This analysis is intended to provide general information and does not constitute the provision of INVESTMENT ADVICE. Investors should, before acting on this information, consider the appropriateness of this information having regard to their personal objectives, financial situation or needs. We recommend investors obtain investment advice specific to their situation before making any financial investment decision.
FxGrow Daily Technical Analysis – 08th Sept, 2015 By FxGrow Research & Analysis Team
EURUSD prepare for long movement
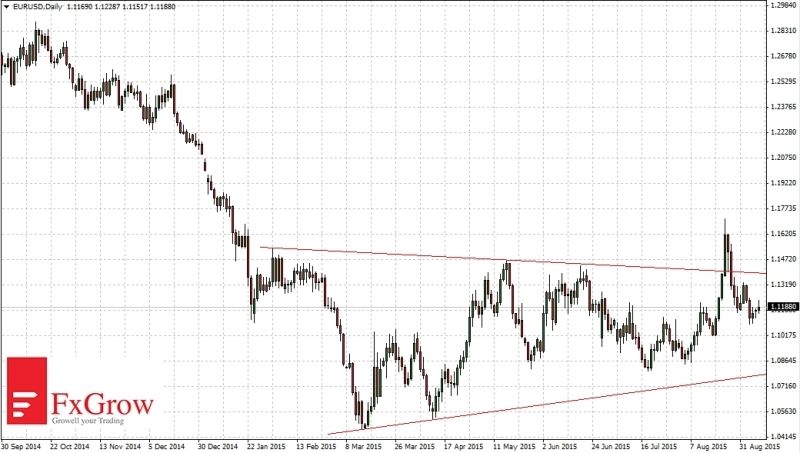
EURUSD after a false breakout above the triangle on August 24 returned to its range. Currently, the volatility is very small which normally ends with a dynamic movement. Policy of central banks suggests that the move could be down. From the one hand we have the FED meeting and possible rate hike. On the other hand, the ECB, which is in the middle of the QE program trying to weaken the euro. Break below the last support should lead price to a lower limit of the triangle (that is 1.0780).
Time-frame M30
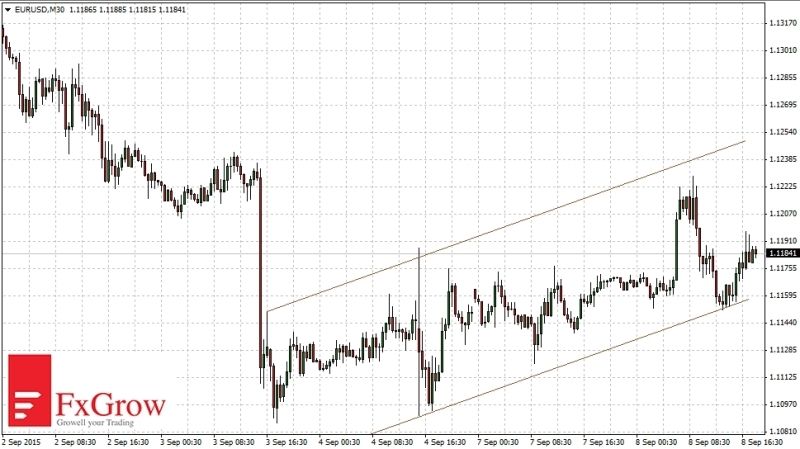
Since the week beginning EURUSD moves in a upward channel. Today price tested lower band of the channel, chich caused the rebound. Break below lower band of this channel will be the first signal of upcoming falls.
Note: This analysis is intended to provide general information and does not constitute the provision of INVESTMENT ADVICE. Investors should, before acting on this information, consider the appropriateness of this information having regard to their personal objectives, financial situation or needs. We recommend investors obtain investment advice specific to their situation before making any financial investment decision.