BTC USD 81,905.1 Gold USD 4,141.87
Time now: Jun 1, 12:00 AM

Daily Technical Analysis by FxGrow

Daily Technical Analysis – 16th June, 2016
By FxGrow Research & Analysis Team

AUDUSD
AUDUSD_zpsx9ypzqm9.png


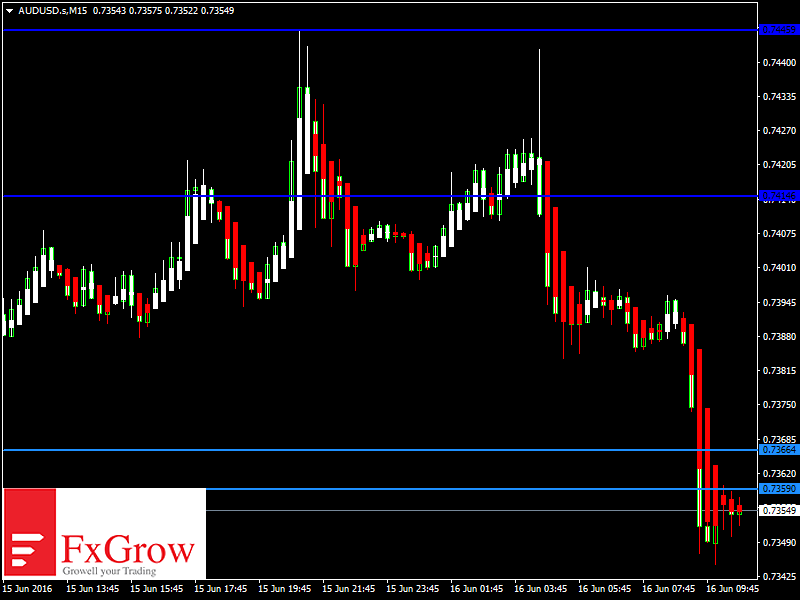
AUDUSD came down yesterday and is presently in the bearish tone trading below 0.7400 handle, the near term bias is bearish with targets of 0.7300 to 0.7250

RSI (14), MACD (12, 26), STOCH (9, 6), ADX (14) indicate a SELL while STOCHRSI (14) is Oversold. Average True Range (14) indicates High Volatility.

Support is at 0.7333 while Resistance is at 0.7425

16th June 2016 – 07:56hrs GMT


USDJPY
USDJPY_zpsty9jqepz.png


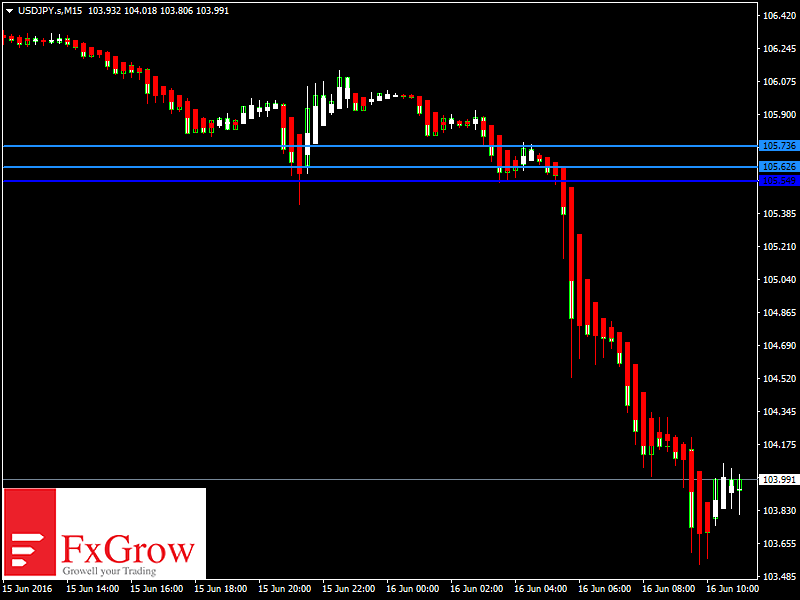
USDJPY continues its Bearish trend dropping below 104.50 in the Asian trading session. The near term bias is bearish with targets of 103.50

ADX (14), MACD (12, 26), STOCH (9, 6), STOCHRSI (14) indicate a SELL; while Average True Range (14) indicates High Volatility.

Support is at 103.18 while Resistance is at 104.62

16th June 2016 – 08:17hrs GMT

For more in depth Research & Analysis please visit FxGrow.http://fxgrow.com/

Note: This analysis is intended to provide general information and does not constitute the provision of INVESTMENT ADVICE. Investors should, before acting on this information, consider the appropriateness of this information having regard to their personal objectives, financial situation or needs. We recommend investors obtain investment advice specific to their situation before making any financial investment decision.
 
FxGrow Daily Technical Analysis – 17th June, 2016
By FxGrow Research & Analysis Team

EURUSD
EURUSD_zpswicrcxht.png


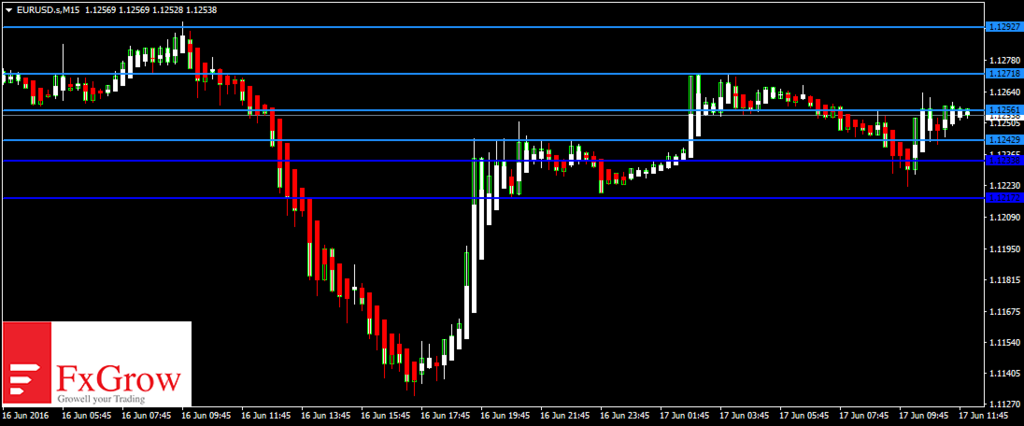
EURUSD pushed lower yesterday touching 1.1130 its lowest level this month. After finding support the pair ascended upwards and crossed 1.1200 handle and continues to hold on to its bullish tone. The near term bias is Neutral to bullish with targets of 1.1310

RSI (14), STOCH (9, 6), CCI (14) are Neutral; MACD (12, 26), ROC, MA100 indicate a BUY; while Average True Range (14) indicates Less Volatility.

Support is at 1.1227 while Resistance is at 1.1270 and 1.1281

17th June 2016 – 09:09hrs GMT


GBPUSD
GBPUSD_zpsrmclioqb.png


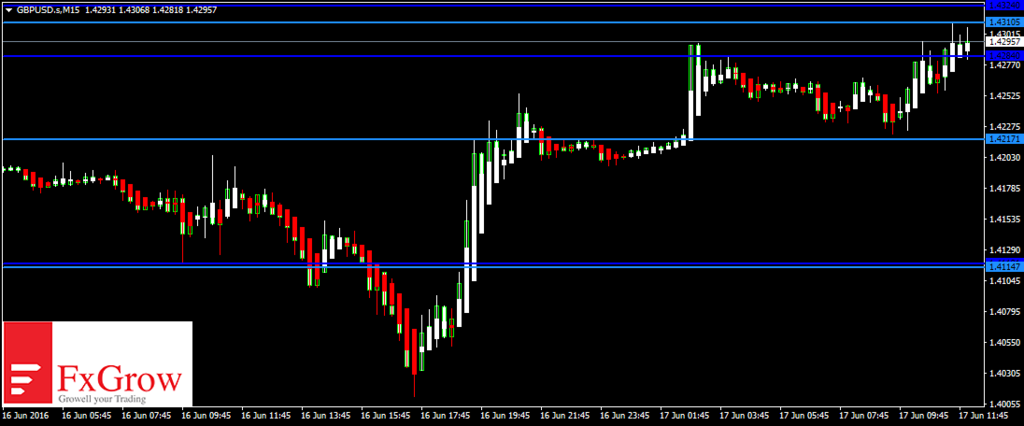
GBPUSD had a roller coaster drive yesterday as it slipped to lows of 1.4015 and after finding support it staged an upwards rally crossing the 1.4200 handle in the US trading session. It continues to maintain Bullish tone trading above 1.4250 in the European trading session. The near term bias is Bullish with targets of 1.4370

RSI (14), CCI (14), STOCH (9, 6), STOCHRSI (14), MACD (12, 26), ROC indicate a BUY; ADX (14) is Neutral while Average True Range (14) indicates Less Volatility.

Support is at 1.4205 while Resistance is at 1.4373

17th June 2016 – 09:18hrs GMT

For more in depth Research & Analysis please visit FxGrow.http://fxgrow.com/

Note: This analysis is intended to provide general information and does not constitute the provision of INVESTMENT ADVICE. Investors should, before acting on this information, consider the appropriateness of this information having regard to their personal objectives, financial situation or needs. We recommend investors obtain investment advice specific to their situation before making any financial investment decision.
 
FxGrow Daily Technical Analysis – 17th June, 2016
By FxGrow Research & Analysis Team

AUDUSD
AUDUSD_zpsejwaefnd.png


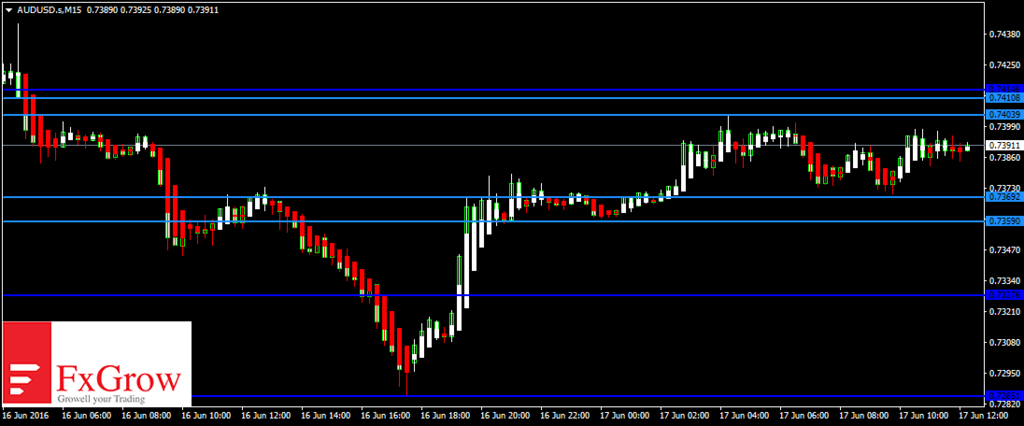
AUDUSD was lower yesterday and touched its base support at 0.7300 after which it recovered and closed above 0.7350 and is presently in the bullish tone trading at 0.7380 levels, the near term bias is Bullish with targets of 0.7400 to 0.7450

RSI (14), MACD (12, 26), STOCHRSI (14), CCI (14) indicate a BUY; ADX (14) is Neutral while Average True Range (14) indicates Less Volatility.

Support is at 0.7285 while Resistance is at 0.7414

17th June 2016 – 09:29hrs GMT


USDJPY
USDJPY_zpszcpv4ack.png


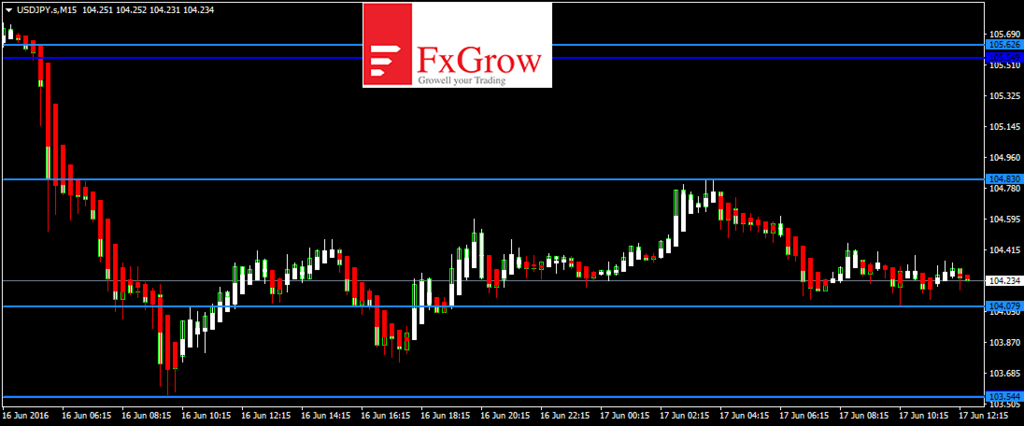
USDJPY had a strong bearish tone yesterday as it slipped to lows of 103.60 and has since then staged a recovery to trade above the 104 handle in the European trading session. The near term bias is bearish with targets of 103.50

RSI (14), ADX (14), MACD (12, 26), STOCH (9, 6) indicate a SELL; STOCHRSI (14) is Oversold while Average True Range (14) indicates Less Volatility.

Support is at 103.54 while Resistance is at 105.62

17th June 2016 – 09:35hrs GMT

For more in depth Research & Analysis please visit FxGrow.http://fxgrow.com/

Note: This analysis is intended to provide general information and does not constitute the provision of INVESTMENT ADVICE. Investors should, before acting on this information, consider the appropriateness of this information having regard to their personal objectives, financial situation or needs. We recommend investors obtain investment advice specific to their situation before making any financial investment decision.
 
FxGrow Daily Technical Analysis – 20th June, 2016
By FxGrow Research & Analysis Team

EURUSD
EURUSD_zpsqjgqnus1.png


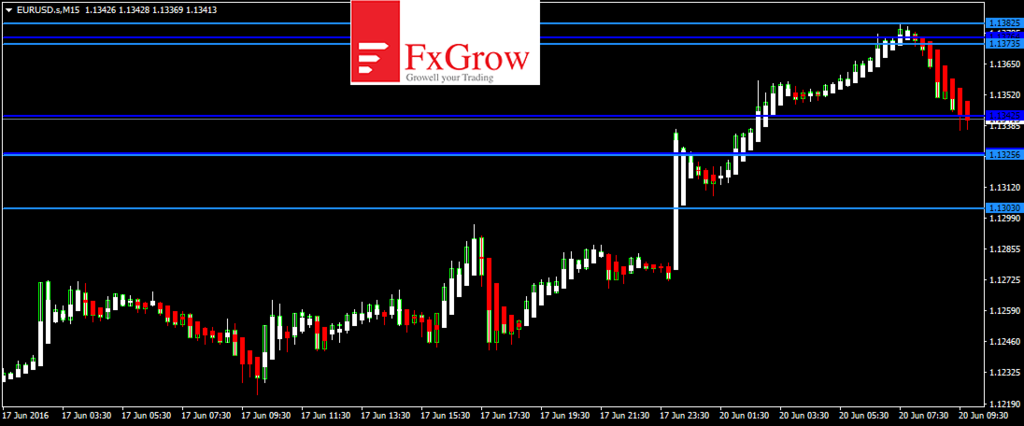
EURUSD closed higher at the end of the week and continues its bullish tone crossing 1.1350 in the Asian trading session. The pair is trading in a strong bullish trend trading above its 100day SMA. The near term bias is Bullish with targets of 1.1450

RSI (14), STOCH (9, 6), MACD (12, 26), ADX (14) indicate a BUY; CCI (14) is Neutral while Average True Range (14) indicates Less Volatility.

Support is at 1.1303 while Resistance is at 1.1382 and 1.1397

20th June 2016 – 07:01hrs GMT


GBPUSD
GBPUSD_zpswiwt6g6r.png


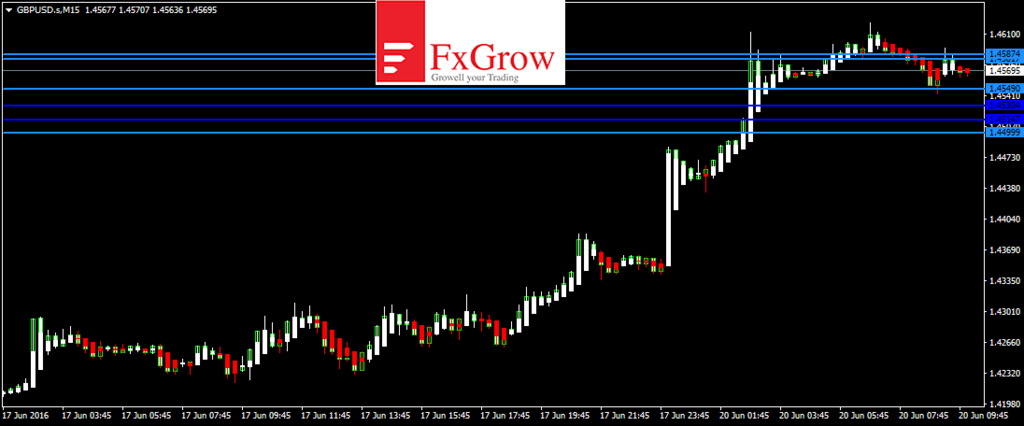
GBPUSD closed the week with significant gains and opened up higher this week crossing 1.4500 in the Asian trading session. It continues to maintain Bullish tone trading above 1.4550 in the European trading session. The near term bias is Bullish with targets of 1.4650

RSI (14), CCI (14), STOCH (9, 6), ADX (14), MACD (12, 26), ROC indicate a BUY; while Average True Range (14) indicates Less Volatility.

Support is at 1.4496 while Resistance is at 1.4640

20th June 2016 – 07:07hrs GMT

For more in depth Research & Analysis please visit FxGrow.http://fxgrow.com/

Note: This analysis is intended to provide general information and does not constitute the provision of INVESTMENT ADVICE. Investors should, before acting on this information, consider the appropriateness of this information having regard to their personal objectives, financial situation or needs. We recommend investors obtain investment advice specific to their situation before making any financial investment decision.
 
FxGrow Daily Technical Analysis – 20th June, 2016
By FxGrow Research & Analysis Team

AUDUSD
AUDUSD_zpsdx7cheyi.png


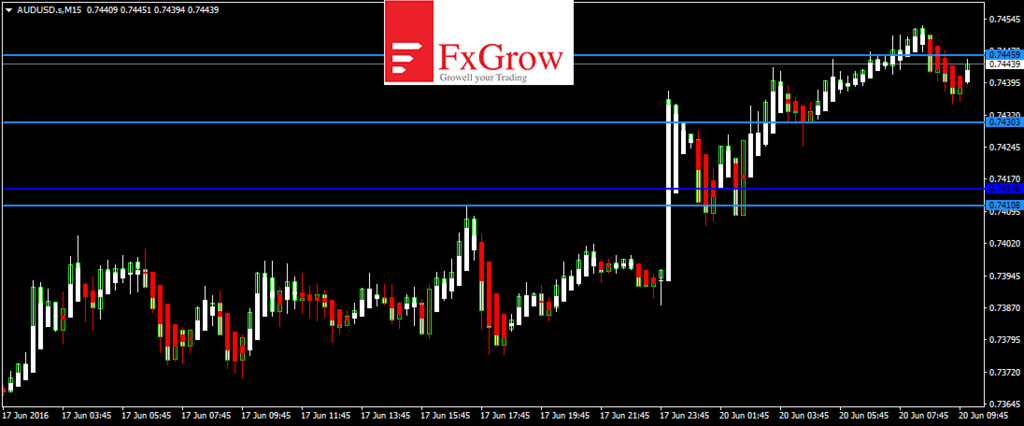
AUDUSD opened this week with a strong bullish tone and is trading above its 100 day SMA of 0.7383 in the Asian trading session. It crossed its daily pivot of 0.7440 and the near term bias is Bullish with targets of 0.7500 to 0.7550

RSI (14), MACD (12, 26), ADX (14), CCI (14) indicate a BUY; STOCH (9, 6) is Overbought while Average True Range (14) indicates Less Volatility.

Support is at 0.7421 while Resistance is at 0.7460

20th June 2016 – 07:15hrs GMT


USDJPY
USDJPY_zpslsejkrlw.png


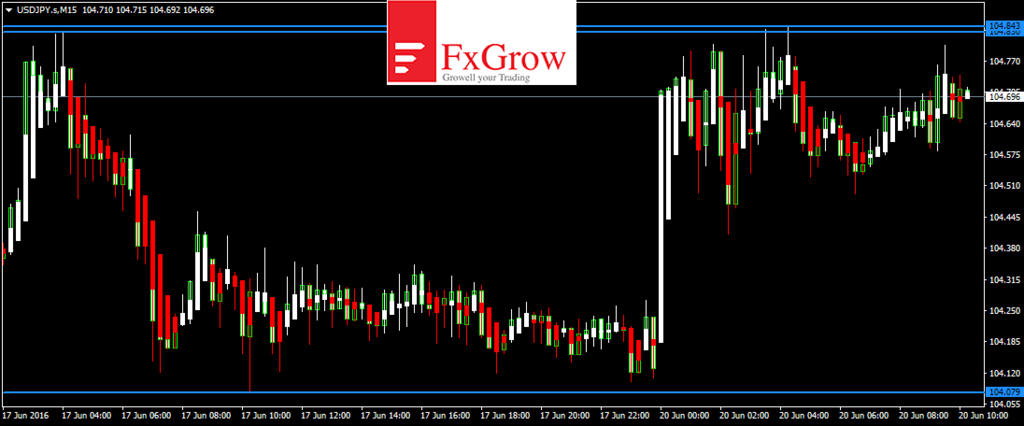
USDJPY opened this week with a strong bullish tone and is trading above 104.50 in the Asian trading session. It is trading above its 50 day SMA of 104.36 and some correction is expected in the European trading session. The near term bias is Bullish with targets of 105.25

RSI (14), ADX (14), MACD (12, 26), STOCH (9, 6), STOCHRSI (14) indicate a BUY; while Average True Range (14) indicates High Volatility.

Support is at 104.07 while Resistance is at 104.84

20th June 2016 – 07:24hrs GMT

For more in depth Research & Analysis please visit FxGrow.http://fxgrow.com/

Note: This analysis is intended to provide general information and does not constitute the provision of INVESTMENT ADVICE. Investors should, before acting on this information, consider the appropriateness of this information having regard to their personal objectives, financial situation or needs. We recommend investors obtain investment advice specific to their situation before making any financial investment decision.
 
FxGrow Daily Technical Analysis – 21st June, 2016
By FxGrow Research & Analysis Team

EURUSD
EURUSD_zps3n2b5f0e.png


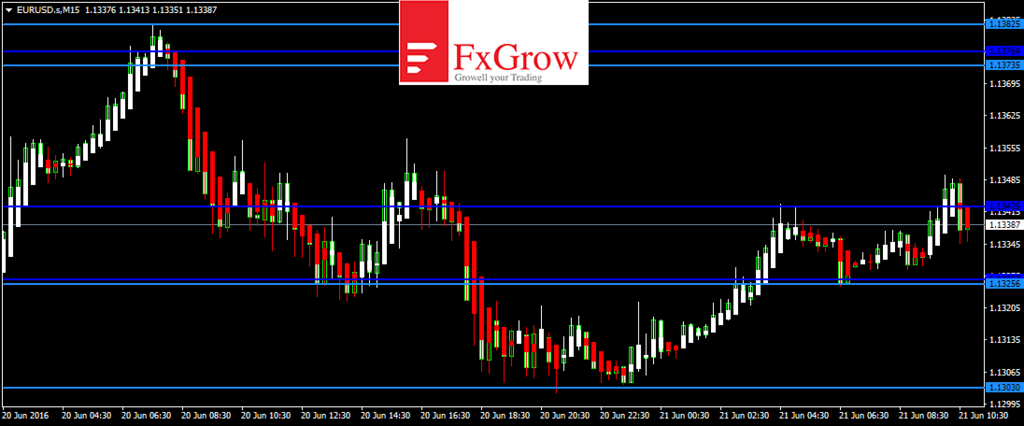
EURUSD had a slight bearish correction yesterday and is now trading in a bullish tone crossing 1.1340 in the Asian trading session. The pair is trading above its 100day SMA of 1.1275; the near term bias is Bullish with targets of 1.1350

RSI (14), STOCH (9, 6), MACD (12, 26), ADX (14), CCI (14) indicate a BUY; STOCHRSI (14) is Overbought while Average True Range (14) indicates Less Volatility.

Support is at 1.1303 while Resistance is at 1.1376 and 1.1382

21st June 2016 – 08:05hrs GMT


GBPUSD
GBPUSD_zps3u8vdqqq.png


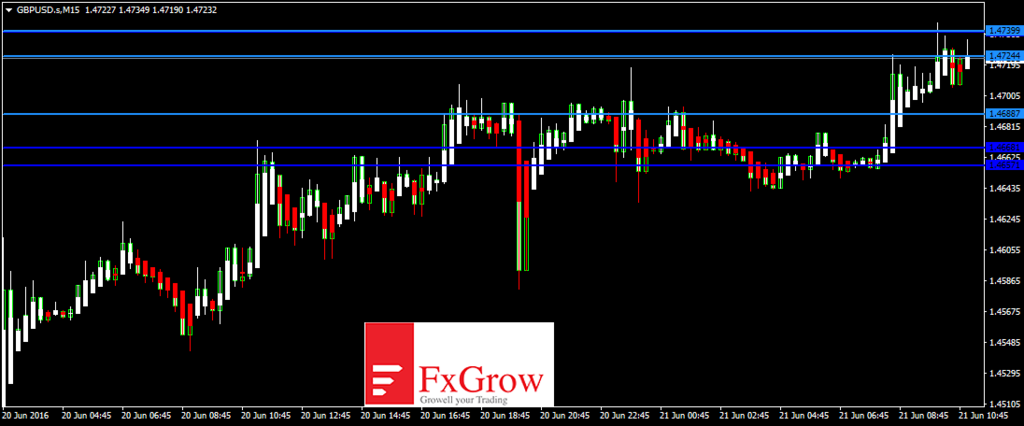
GBPUSD continued its strong bullish overtone yesterday and is now trading above the 1.4700 handle in the Asian trading session. Some downside correction is expected in the European trading session. The near term bias is Neutral to Bullish with targets of 1.4750

RSI (14), STOCHRSI (14), MACD (12, 26), ADX (14), CCI (14), ROC indicate a BUY; STOCH (9, 6) is Neutral while Average True Range (14) indicates Less Volatility.

Support is at 1.4657 while Resistance is at 1.4739

21st June 2016 – 08:15hrs GMT

For more in depth Research & Analysis please visit FxGrow.http://fxgrow.com/

Note: This analysis is intended to provide general information and does not constitute the provision of INVESTMENT ADVICE. Investors should, before acting on this information, consider the appropriateness of this information having regard to their personal objectives, financial situation or needs. We recommend investors obtain investment advice specific to their situation before making any financial investment decision.
 
FxGrow Daily Technical Analysis – 21st June, 2016
By FxGrow Research & Analysis Team

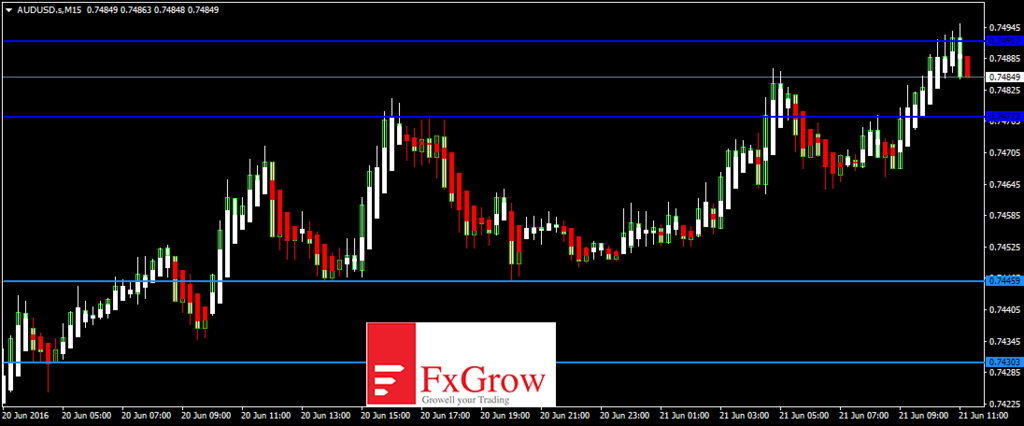
AUDUSD
AUDUSD_zpselr0aw79.png


AUDUSD is trading above its 100 day SMA of 0.7409 in the Asian trading session. It is near to its daily pivot of 0.7490 and the near term bias is Bullish with targets of 0.7500 to 0.7550

RSI (14), STOCH (9, 6), MACD (12, 26), ADX (14), CCI (14) indicate a BUY; while Average True Range (14) indicates Less Volatility.

Support is at 0.7430 while Resistance is at 0.7491

21st June 2016 – 08:22hrs GMT

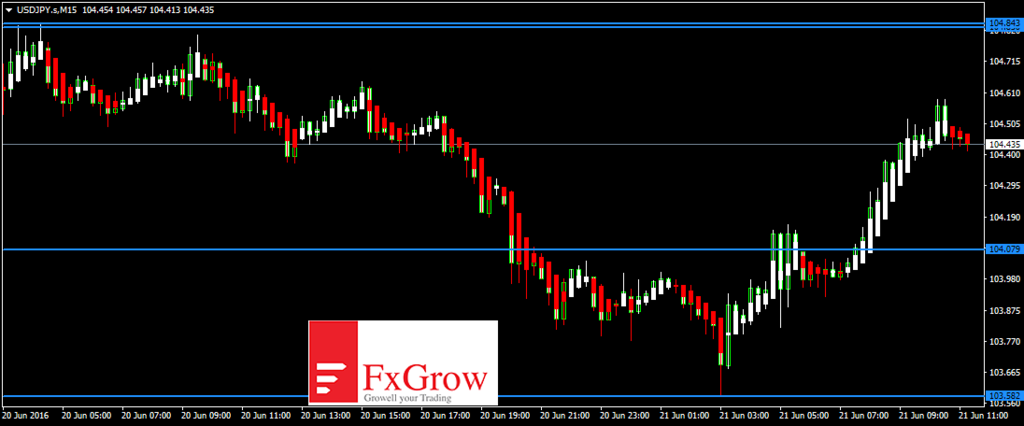
USDJPY
USDJPY_zpsqxj0aduf.png


USDJPY was bearish yesterday as it dropped to lows of 103.80 and is now trading below its 100day SMA of 104.67 in the Asian trading session. The near term bias is Bullish with targets of 105.15

RSI (14), ADX (14), MACD (12, 26), STOCH (9, 6) indicate a BUY; STOCHRSI (14) is Overbought while Average True Range (14) indicates High Volatility.

Support is at 103.58 while Resistance is at 104.84

21st June 2016 – 08:27hrs GMT

For more in depth Research & Analysis please visit FxGrow.http://fxgrow.com/

Note: This analysis is intended to provide general information and does not constitute the provision of INVESTMENT ADVICE. Investors should, before acting on this information, consider the appropriateness of this information having regard to their personal objectives, financial situation or needs. We recommend investors obtain investment advice specific to their situation before making any financial investment decision.
 
FxGrow Daily Technical Analysis – 22nd June, 2016
By FxGrow Research & Analysis Team

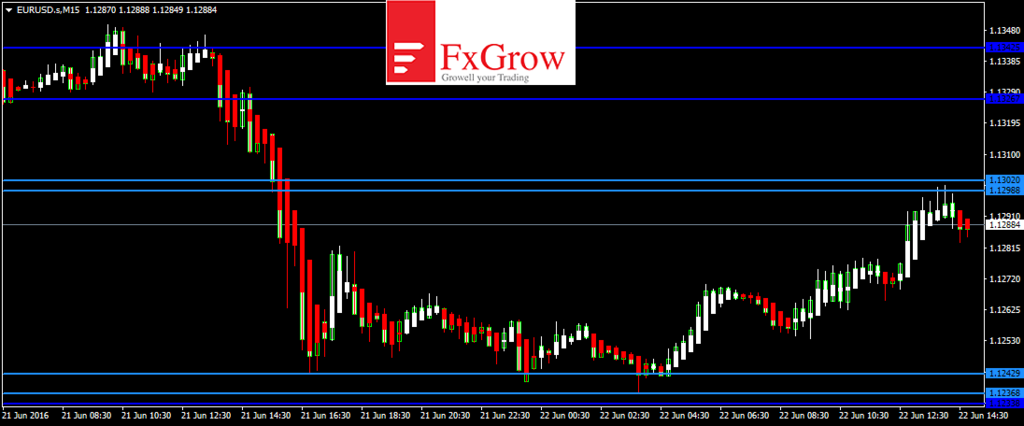
EURUSD
EURUSD_zpsyyijruu2.png


EURUSD had a bearish move yesterday as it touched a low of 1.1238 and is now trading just above its 100day SMA of 1.1282 with a mild recovery in the European trading session today. The near term bias is Bullish with targets of 1.1330

RSI (14), STOCH (9, 6), ADX (14), CCI (14), ROC indicate a BUY; STOCHRSI (14) is Overbought while Average True Range (14) indicates Less Volatility.

Support is at 1.1233 while Resistance is at 1.1326 and 1.1342

22nd June 2016 – 12:05hrs GMT


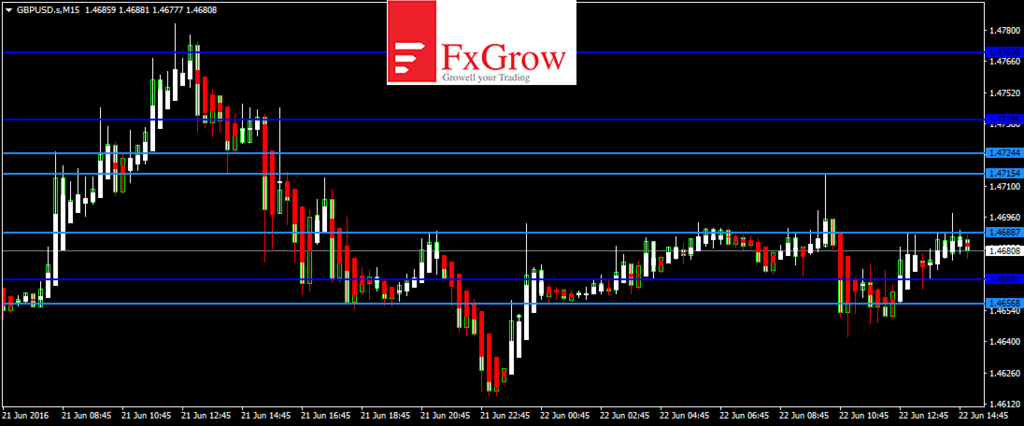
GBPUSD
GBPUSD_zpsm1udofc5.png


GBPUSD continues its bullish trend trading above the 1.4650 handle in the European trading session. The pair is trading above its 100day SMA of 1.4506 and sideways moves are expected. The near term bias is Neutral to Bullish with targets of 1.4700

RSI (14), MACD (12, 26) is Neutral; ADX (14), CCI (14) MA100 indicate a BUY; while Average True Range (14) indicates Less Volatility.

Support is at 1.4656 while Resistance is at 1.4769

22nd June 2016 – 12:10hrs GMT

For more in depth Research & Analysis please visit FxGrow.http://fxgrow.com/

Note: This analysis is intended to provide general information and does not constitute the provision of INVESTMENT ADVICE. Investors should, before acting on this information, consider the appropriateness of this information having regard to their personal objectives, financial situation or needs. We recommend investors obtain investment advice specific to their situation before making any financial investment decision.
 
FxGrow Daily Technical Analysis – 22nd June, 2016
By FxGrow Research & Analysis Team

AUDUSD
AUDUSD_zpsqsvjpa59.png


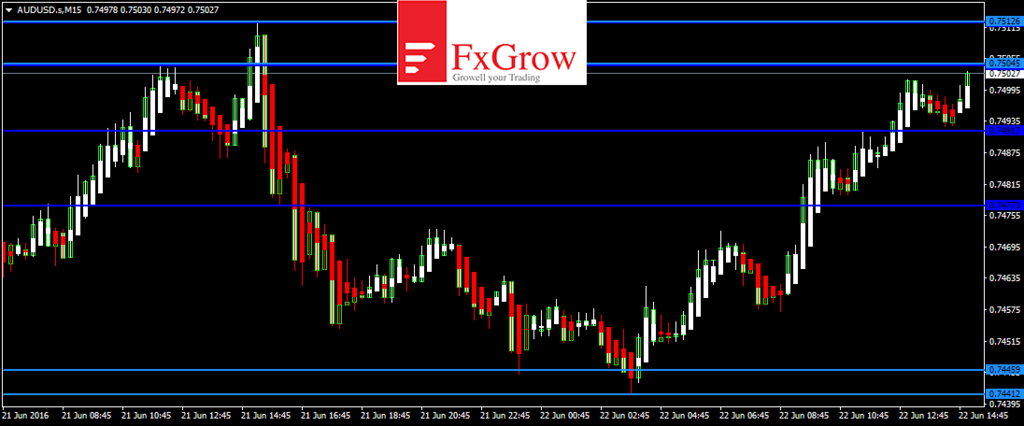
AUDUSD remained indecisive yesterday as it touched a high of 0.7511 and a low of 0.7448 towards the end of the trading session yesterday. Now it is trading above its 100 day SMA of 0.7431 in the European trading session. The near term bias is Bullish with targets of 0.7530 to 0.7550

RSI (14), MACD (12, 26), ADX (14), CCI (14), Ultimate Oscillator indicate a BUY; STOCH (9, 6), STOCHRSI (14) are Overbought; while Average True Range (14) indicates Less Volatility.

Support is at 0.7445 while Resistance is at 0.7512


22nd June 2016 – 12:16hrs GMT

USDJPY
USDJPY_zps0mcyyvte.png


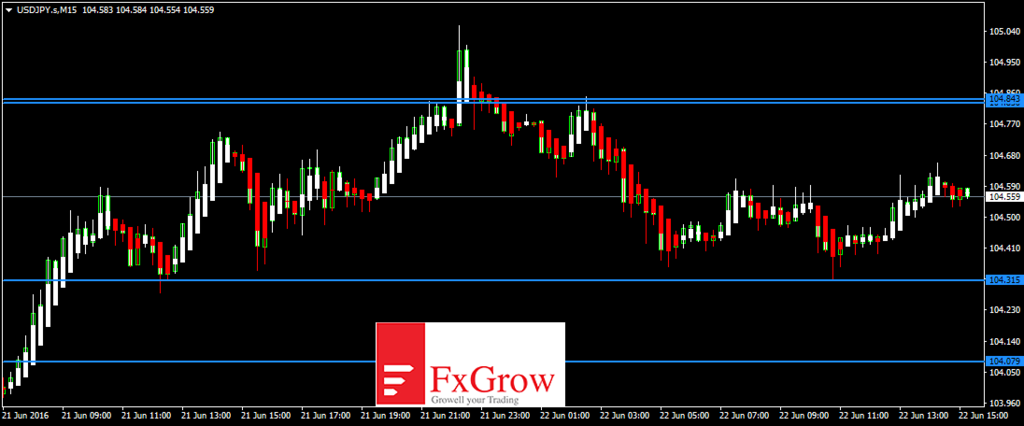
USDJPY was indecisive yesterday as it touched a low of 103.57 and a high of 105.05 towards the end of the trading session. The pair is now trading above its 100day SMA of 104.40 in the European trading session. The near term bias is Neutral to Bullish with targets of 105.00

RSI (14), STOCH (9, 6), CCI (14) are Neutral; STOCHRSI (14), MACD (12, 26), ADX (14) indicate a BUY; while Average True Range (14) indicates Less Volatility.

Support is at 104.07 while Resistance is at 104.84

22nd June 2016 – 12:22hrs GMT

For more in depth Research & Analysis please visit FxGrow.http://fxgrow.com/

Note: This analysis is intended to provide general information and does not constitute the provision of INVESTMENT ADVICE. Investors should, before acting on this information, consider the appropriateness of this information having regard to their personal objectives, financial situation or needs. We recommend investors obtain investment advice specific to their situation before making any financial investment decision.
 
FxGrow Daily Technical Analysis – 23rd June, 2016
By FxGrow Research & Analysis Team

EURUSD
EURUSD_zpstm0rnda4.png


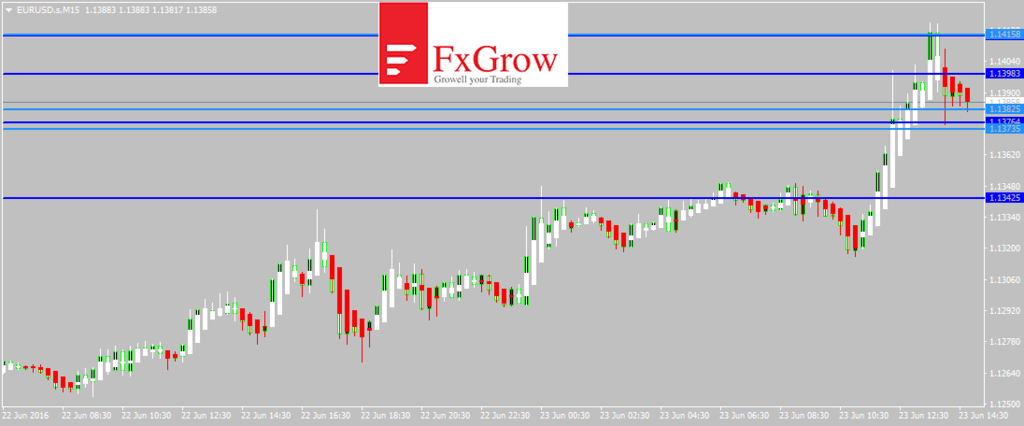
EURUSD continues its strong Bullish tone in the European trading session today and is now trading above its 100day SMA of 1.1305 with an upside focus towards the end of the trading session. The near term bias is Bullish with targets of 1.1440 to 1.1450

RSI (14), MACD (12, 26), Ultimate Oscillator, ROC indicate a BUY; STOCHRSI (14) and CCI (14) are Overbought while Average True Range (14) indicates Less Volatility.

Support is at 1.1354 while Resistance is at 1.1432 and 1.1432 to 1.1464

23rd June 2016 – 11:00hrs GMT

GBPUSD
GBPUSD_zpsqwuqvzfq.png


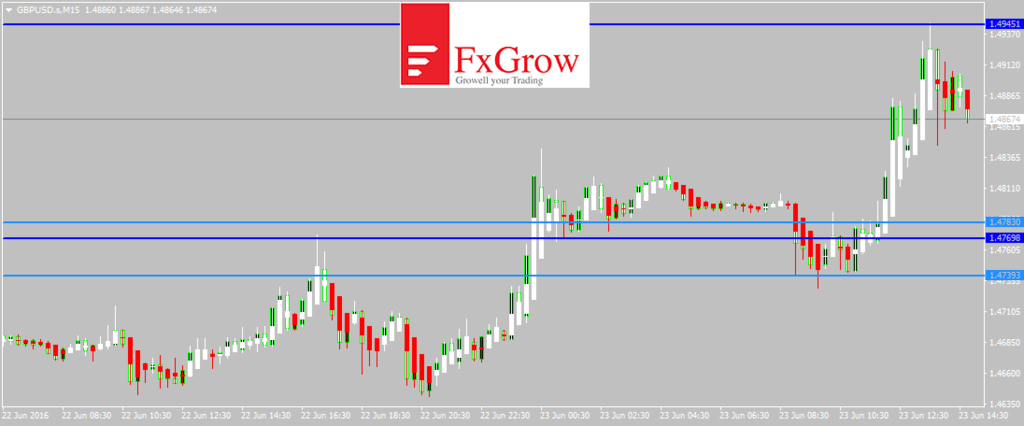
GBPUSD continues its strong bullish trend trading above the 1.4850 handle in the European trading session. The pair is trading above its 10day SMA of 1.4801 and some downside correction is expected. The near term bias is Bullish with targets of 1.4950

RSI (14), MACD (12, 26), ADX (14), ROC indicate a BUY; STOCHRSI (14) is Overbought while Average True Range (14) indicates Less Volatility.

Support is at 1.4739 while Resistance is at 1.4945

23rd June 2016 – 11:17hrs GMT

For more in depth Research & Analysis please visit FxGrow.http://fxgrow.com/

Note: This analysis is intended to provide general information and does not constitute the provision of INVESTMENT ADVICE. Investors should, before acting on this information, consider the appropriateness of this information having regard to their personal objectives, financial situation or needs. We recommend investors obtain investment advice specific to their situation before making any financial investment decision.
 

Live Forex Chart

Currency
Rates
EUR / USD
1.12095
USD / JPY
158.497
GBP / USD
1.33052
USD / CHF
0.82676
USD / CAD
1.40937
EUR / JPY
177.667
AUD / USD
0.69799
Back
Top
Log in Register