FxGrow Daily Technical Analysis – 09th Feb, 2016 By FxGrow Research & Analysis Team
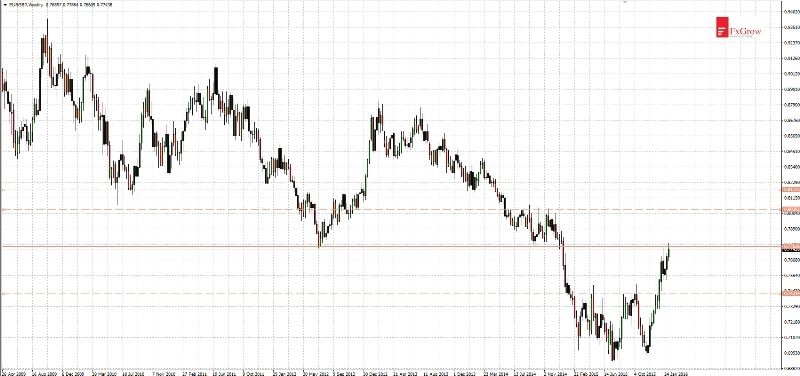
EURGBP - highest since a year and test of important resistance
Since a mid-November EURGBP moved in an uptrend. Currently demand has a tough work to do, which is break above resistance at 0.7760. If it succeeds price should gain 250 pips and reach another resistance 0.8030. However if supply is stronger nearest supports will be located at levels: 0.7540, 0.7420.
Note: This analysis is intended to provide general information and does not constitute the provision of INVESTMENT ADVICE. Investors should, before acting on this information, consider the appropriateness of this information having regard to their personal objectives, financial situation or needs. We recommend investors obtain investment advice specific to their situation before making any financial investment decision.
FxGrow Daily Technical Analysis – 09th Feb, 2016 By FxGrow Research & Analysis Team
USDJPY - new week, new low
There is a black scenario in game at USDJPY and today price reached 14-months low. It have to be noted that such scenario was indicated in the last week's analysis. I wrote: "Currently price should continue previous declines. Nearest support is at 116.70 but even this year's low at 116.10 could be tested".
Note: This analysis is intended to provide general information and does not constitute the provision of INVESTMENT ADVICE. Investors should, before acting on this information, consider the appropriateness of this information having regard to their personal objectives, financial situation or needs. We recommend investors obtain investment advice specific to their situation before making any financial investment decision.
FxGrow Daily Technical Analysis – 10th Feb, 2016 By FxGrow Research & Analysis Team
AUDCAD - rebound from support near 0.9730
Since the beginning of January AUDCAD moved down. In this particular time support at area 0.9820 - 0.9840 stopped declines. Yesterday this support was broken below and price sharply fell 100 pips reaching 0.9730. Support at 0.9730 is very strong, it can be seen at weekly TF. Price rebounded at indicated level and upward movement continues today.
Note: This analysis is intended to provide general information and does not constitute the provision of INVESTMENT ADVICE. Investors should, before acting on this information, consider the appropriateness of this information having regard to their personal objectives, financial situation or needs. We recommend investors obtain investment advice specific to their situation before making any financial investment decision.
FxGrow Daily Technical Analysis – 10th Feb, 2016 By FxGrow Research & Analysis Team
Oil brent at support 30.50
Rebound which lasted 10 days is now only a memory and oil returned to downtrend. So far price stayed above 30.00 level however there isn't any optimistic sign for the bulls. It is likely that side trend between 27.30 and 36.10 will be continued. In this area price moved since a month.
Note: This analysis is intended to provide general information and does not constitute the provision of INVESTMENT ADVICE. Investors should, before acting on this information, consider the appropriateness of this information having regard to their personal objectives, financial situation or needs. We recommend investors obtain investment advice specific to their situation before making any financial investment decision.
FxGrow Daily Technical Analysis – 11th Feb, 2016 By FxGrow Research & Analysis Team
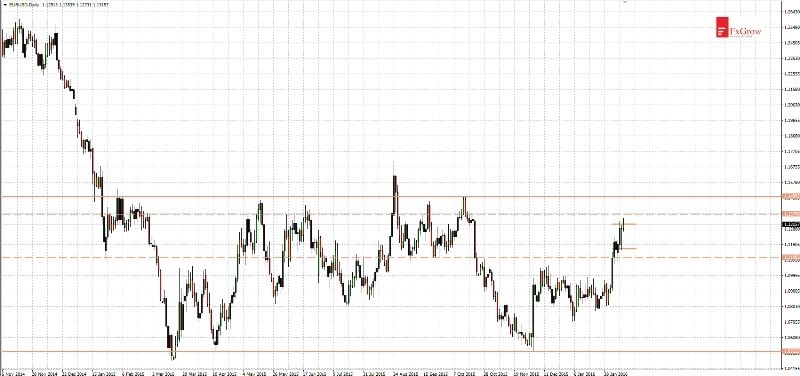
EURUSD - highest since October 2015
During semi-annual congressional testimony Janet Yellen wasn't dovish enough, she said: "The FOMC anticipates that economic conditions will evolve in a manner that will warrant only gradual increases in the federal funds rate".
Note: This analysis is intended to provide general information and does not constitute the provision of INVESTMENT ADVICE. Investors should, before acting on this information, consider the appropriateness of this information having regard to their personal objectives, financial situation or needs. We recommend investors obtain investment advice specific to their situation before making any financial investment decision.
FxGrow Daily Technical Analysis – 11th Feb, 2016 By FxGrow Research & Analysis Team
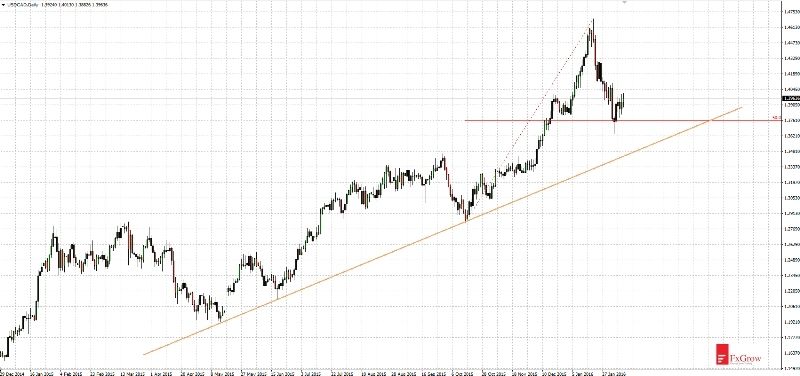
USDCAD - bulls are back, but a flag pattern suggests that the falls are not finished
After correction of 50% previous upward movement, at the chart occurred a candle with long bottom shadow. Such price action candles predict rebound. So it happened and for a week upward movement continues. However there is one concern. At time-frame H4 price formed flag pattern in a direction opposite to the previous movement (blue on the chart).
Note: This analysis is intended to provide general information and does not constitute the provision of INVESTMENT ADVICE. Investors should, before acting on this information, consider the appropriateness of this information having regard to their personal objectives, financial situation or needs. We recommend investors obtain investment advice specific to their situation before making any financial investment decision.
FxGrow Daily Technical Analysis – 12th Feb, 2016 By FxGrow Research & Analysis Team
USDJPY - after 9 days of declines there is a hope for a rebound
Previous AUDJPY analysis was very profitable. I indicated flag pattern and direction of breakout. I wrote: 'Flag is a pattern of trend continuation which means that price should break below lower limit of the flag according to a main downtrend'. As you can see breakout occurred and price sharply moved down. After rebound, since mid-January decline continues and yesterday price tested support at 77.60.
Note: This analysis is intended to provide general information and does not constitute the provision of INVESTMENT ADVICE. Investors should, before acting on this information, consider the appropriateness of this information having regard to their personal objectives, financial situation or needs. We recommend investors obtain investment advice specific to their situation before making any financial investment decision.
FxGrow Daily Technical Analysis – 12th Feb, 2016 By FxGrow Research & Analysis Team
EURCAD - correction should occur
Macroeconomic data from US caused sharp downward movement at EURCAD. Rebound occurred when price moved above 1.5580 area which is nearest support. US retail sales were better than forecasted. Similar price reaction occurred at EURUSD.
Note: This analysis is intended to provide general information and does not constitute the provision of INVESTMENT ADVICE. Investors should, before acting on this information, consider the appropriateness of this information having regard to their personal objectives, financial situation or needs. We recommend investors obtain investment advice specific to their situation before making any financial investment decision.
FxGrow Daily Technical Analysis – 13th Feb, 2016 By FxGrow Research & Analysis Team
EURUSD - movement towards 1.1160 support
Supply at EURUSD took over control after Thursday's test of resistance at 1.1380. First support at 1.1320 wasn't able to stop decline and today for the first minutes of trading downward movement is continuing. Nearest support is at 1.1160 but if it breaks stronger support will be located at 1.1100. One of that levels should make rebound.
Note: This analysis is intended to provide general information and does not constitute the provision of INVESTMENT ADVICE. Investors should, before acting on this information, consider the appropriateness of this information having regard to their personal objectives, financial situation or needs. We recommend investors obtain investment advice specific to their situation before making any financial investment decision.
FxGrow Daily Technical Analysis – 15th Feb, 2016 By FxGrow Research & Analysis Team
USDJPY - sharp return above 114.00
In previous analysis from February 9 I indicated weakness of the bulls at USDJPY and possibility of price movement towards 109.80. I wrote: 'Demand is weak and support at 116.10 wasn't defended. Nearest supports are at 114.00, 112.30. However it is likely that even support at 109.80 may be tested'.
Note: This analysis is intended to provide general information and does not constitute the provision of INVESTMENT ADVICE. Investors should, before acting on this information, consider the appropriateness of this information having regard to their personal objectives, financial situation or needs. We recommend investors obtain investment advice specific to their situation before making any financial investment decision.