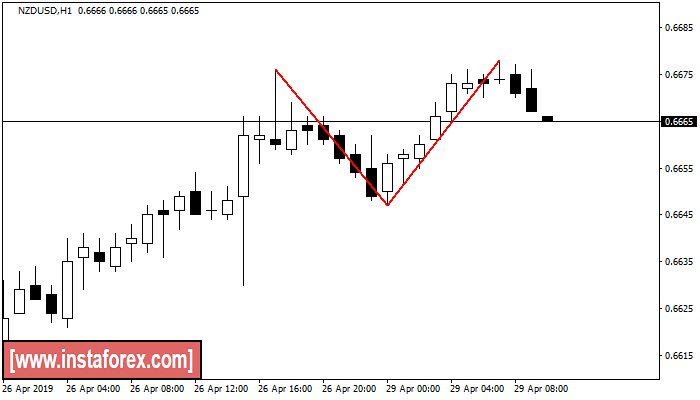
Double Top
was formed on 29.04 at 07:01:16 (UTC+0)
signal strength 4 of 5
On the chart of NZDUSD H1 the Double Top reversal pattern has been formed. Characteristics: the upper boundary 0.6678; the lower boundary 0.6647; the width of the pattern 31 points. The signal: a break of the lower boundary will cause continuation of the downward trend targeting the 0.6607 level.
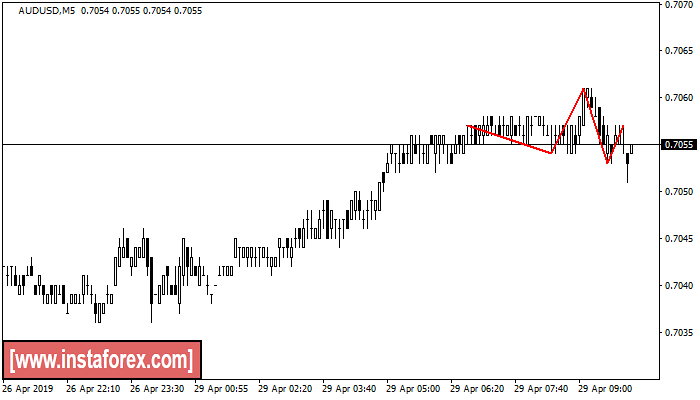
Head and Shoulders
was formed on 29.04 at 07:05:29 (UTC+0)
signal strength 1 of 5
The AUDUSD M5 formed the Head and Shoulders pattern with the following features: The Head’s top is at 0.7061, the Neckline and the upward angle are at 0.7054/0.7053. The formation of this pattern can bring about changes in the current trend from bullish to bearish. In case the pattern triggers the expected changes, the price of AUDUSD will go towards 0.7038.
The M5 and M15 time frames may have more false entry points.
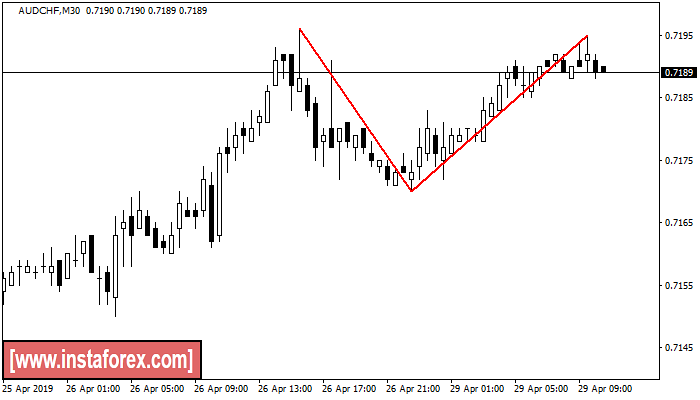
Double Top
was formed on 29.04 at 07:30:17 (UTC+0)
signal strength 3 of 5
The Double Top reversal pattern has been formed on AUDCHF M30. Characteristics: the upper boundary 0.7196; the lower boundary 0.7170; the width of the pattern is 25 points. Sell trades are better to be opened below the lower boundary 0.7170 with a possible movements towards the 0.7140 level.
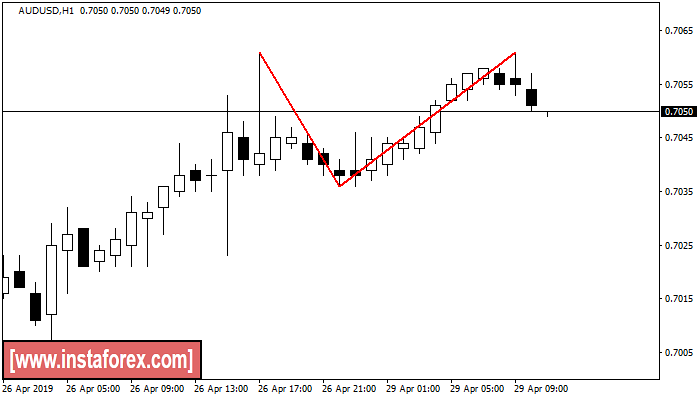
Double Top
was formed on 29.04 at 08:00:52 (UTC+0)
signal strength 4 of 5
On the chart of AUDUSD H1 the Double Top reversal pattern has been formed. Characteristics: the upper boundary 0.7061; the lower boundary 0.7036; the width of the pattern 25 points. The signal: a break of the lower boundary will cause continuation of the downward trend targeting the 0.6996 level.
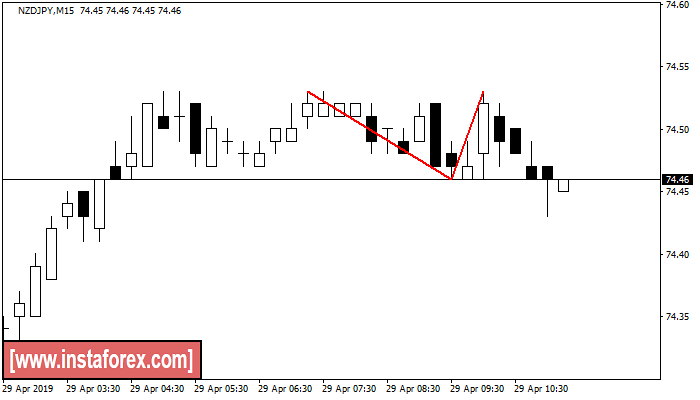
Double Top
was formed on 29.04 at 08:15:16 (UTC+0)
signal strength 2 of 5
The Double Top pattern has been formed on NZDJPY M15. It signals that the trend has been changed from upwards to downwards. Probably, if the base of the pattern 74.46 is broken, the downward movement will continue.
The M5 and M15 time frames may have more false entry points.
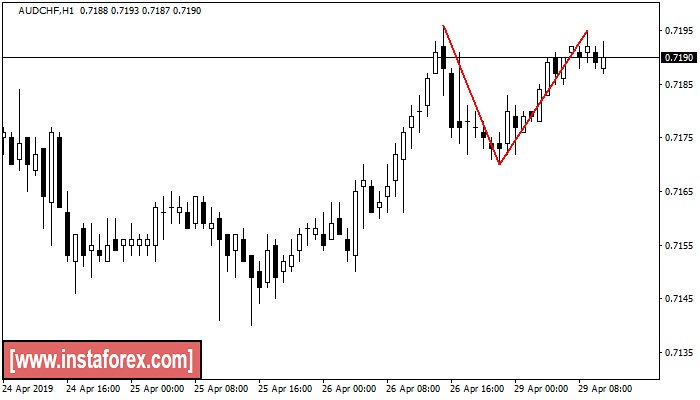
Double Top
was formed on 29.04 at 08:50:31 (UTC+0)
signal strength 4 of 5
On the chart of AUDCHF H1 the Double Top reversal pattern has been formed. Characteristics: the upper boundary 0.7195; the lower boundary 0.7170; the width of the pattern 25 points. The signal: a break of the lower boundary will cause continuation of the downward trend targeting the 0.7130 level.
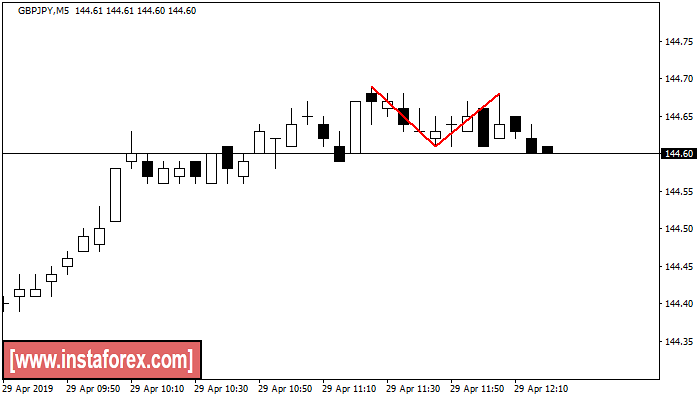
Double Top
was formed on 29.04 at 09:20:39 (UTC+0)
signal strength 1 of 5
On the chart of GBPJPY M5 the Double Top reversal pattern has been formed. Characteristics: the upper boundary 144.68; the lower boundary 144.61; the width of the pattern 7 points. The signal: a break of the lower boundary will cause continuation of the downward trend targeting the 144.46 level.
The M5 and M15 time frames may have more false entry points.
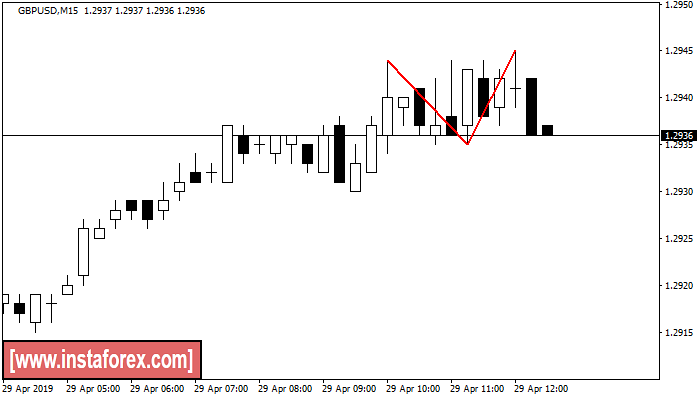
Double Top
was formed on 29.04 at 09:30:33 (UTC+0)
signal strength 2 of 5
The Double Top reversal pattern has been formed on GBPUSD M15. Characteristics: the upper boundary 1.2944; the lower boundary 1.2935; the width of the pattern is 10 points. Sell trades are better to be opened below the lower boundary 1.2935 with a possible movements towards the 1.2912 level.
The M5 and M15 time frames may have more false entry points.
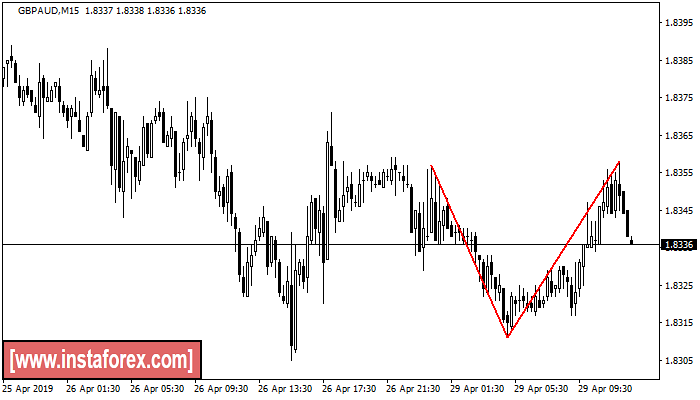
Double Top
was formed on 29.04 at 09:45:34 (UTC+0)
signal strength 2 of 5
The Double Top reversal pattern has been formed on GBPAUD M15. Characteristics: the upper boundary 1.8357; the lower boundary 1.8311; the width of the pattern is 47 points. Sell trades are better to be opened below the lower boundary 1.8311 with a possible movements towards the 1.8289 level.
The M5 and M15 time frames may have more false entry points.
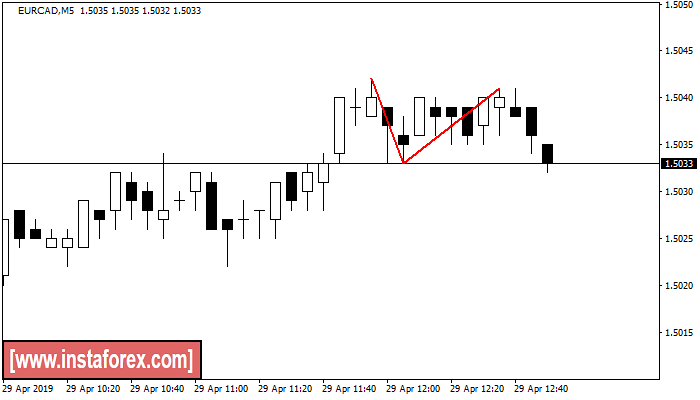
Double Top
was formed on 29.04 at 09:50:48 (UTC+0)
signal strength 1 of 5
The Double Top pattern has been formed on EURCAD M5. It signals that the trend has been changed from upwards to downwards. Probably, if the base of the pattern 1.5033 is broken, the downward movement will continue.
The M5 and M15 time frames may have more false entry points.