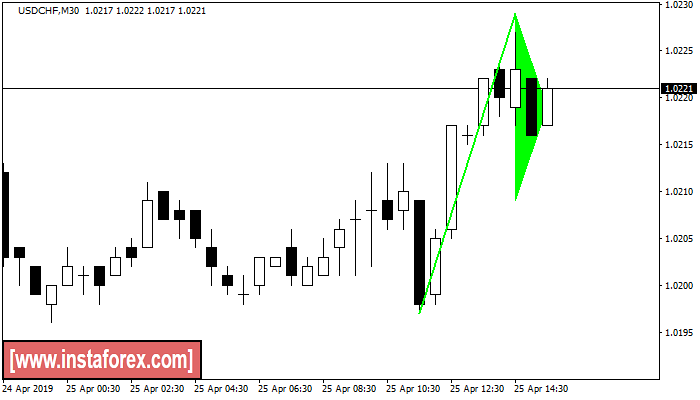
Bullish pennant
was formed on 25.04 at 12:30:30 (UTC+0)
signal strength 3 of 5
The Bullish pennant signal – Trading instrument USDCHF M30, continuation pattern. Forecast: it is possible to set up a buy position above the pattern’s high of 1.0229, with the prospect of the next move being a projection of the flagpole height.
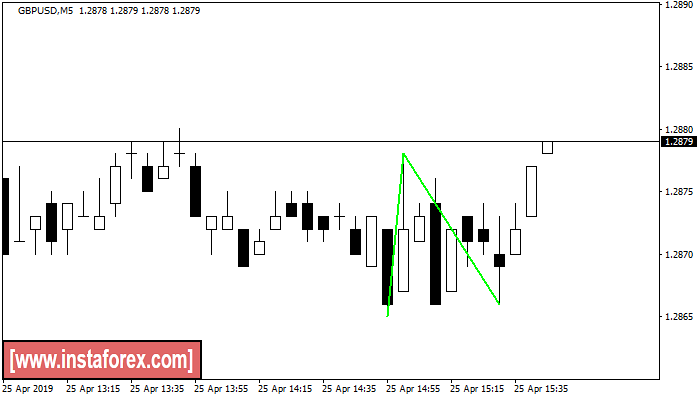
Double Bottom
was formed on 25.04 at 12:45:52 (UTC+0)
signal strength 1 of 5
The Double Bottom pattern has been formed on GBPUSD M5. Characteristics: the support level 1.2865; the resistance level 1.2878; the width of the pattern 13 points. If the resistance level is broken, a change in the trend can be predicted with the first target point lying at the distance of 12 points.
The M5 and M15 time frames may have more false entry points.
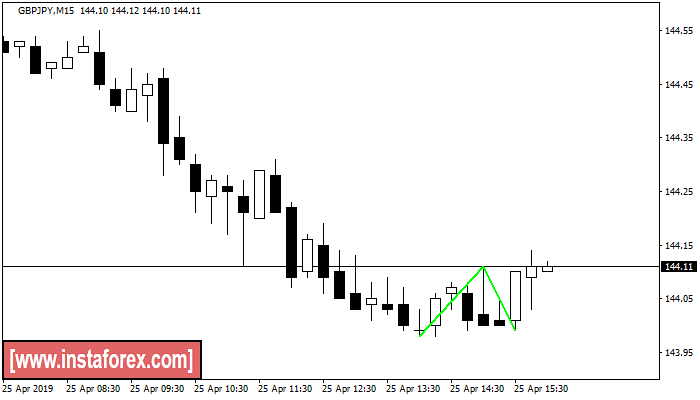
Double Bottom
was formed on 25.04 at 13:00:24 (UTC+0)
signal strength 2 of 5
The Double Bottom pattern has been formed on GBPJPY M15. This formation signals a reversal of the trend from downwards to upwards. The signal is that a buy trade should be opened after the upper boundary of the pattern 144.11 is broken. The further movements will rely on the width of the current pattern 13 points.
The M5 and M15 time frames may have more false entry points.
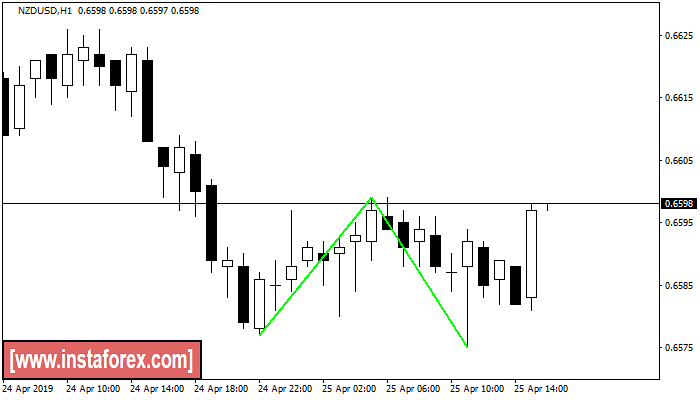
Double Bottom
was formed on 25.04 at 13:00:51 (UTC+0)
signal strength 4 of 5
The Double Bottom pattern has been formed on NZDUSD H1. This formation signals a reversal of the trend from downwards to upwards. The signal is that a buy trade should be opened after the upper boundary of the pattern 0.6599 is broken. The further movements will rely on the width of the current pattern 22 points.
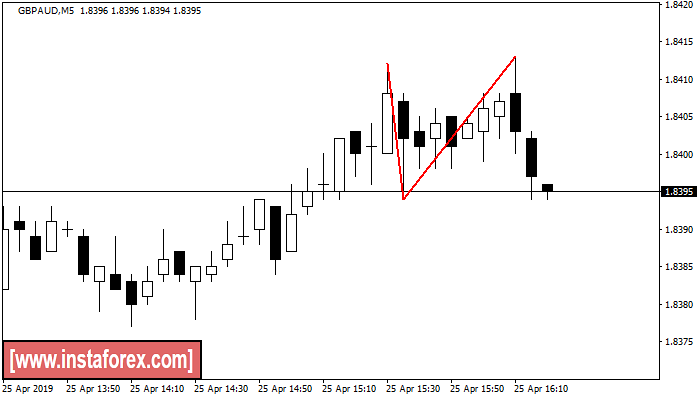
Double Top
was formed on 25.04 at 13:20:25 (UTC+0)
signal strength 1 of 5
The Double Top reversal pattern has been formed on GBPAUD M5. Characteristics: the upper boundary 1.8412; the lower boundary 1.8394; the width of the pattern is 19 points. Sell trades are better to be opened below the lower boundary 1.8394 with a possible movements towards the 1.8379 level.
The M5 and M15 time frames may have more false entry points.
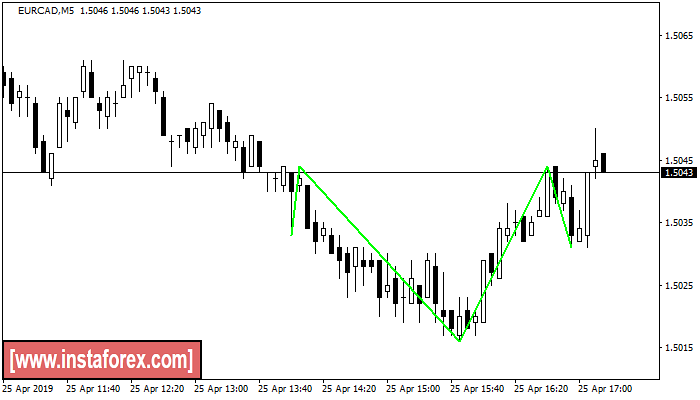
Inverse Head and Shoulder
was formed on 25.04 at 14:15:16 (UTC+0)
signal strength 1 of 5
According to M5, EURCAD is shaping the technical pattern – the Inverse Head and Shoulder. In case the Neckline 1.5044/1.5044 is broken out, the instrument is likely to move toward 1.5059.
The M5 and M15 time frames may have more false entry points.
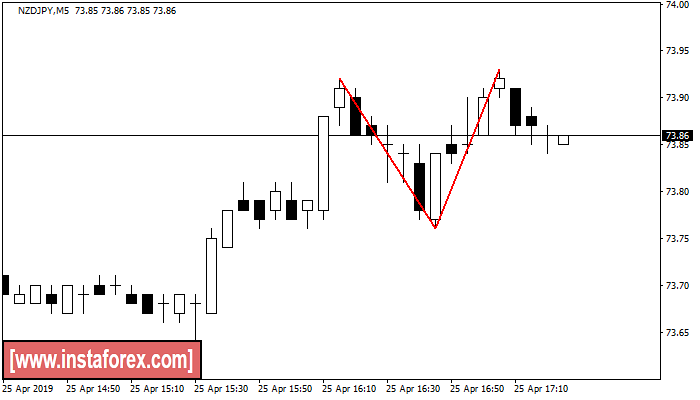
Double Top
was formed on 25.04 at 14:25:23 (UTC+0)
signal strength 1 of 5
On the chart of NZDJPY M5 the Double Top reversal pattern has been formed. Characteristics: the upper boundary 73.93; the lower boundary 73.76; the width of the pattern 17 points. The signal: a break of the lower boundary will cause continuation of the downward trend targeting the 73.61 level.
The M5 and M15 time frames may have more false entry points.
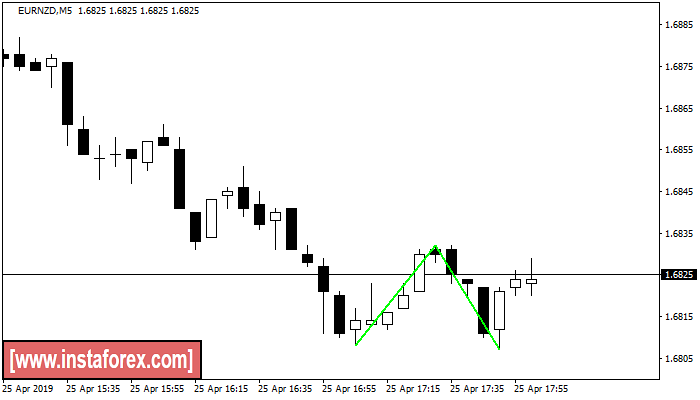
Double Bottom
was formed on 25.04 at 15:05:55 (UTC+0)
signal strength 1 of 5
The Double Bottom pattern has been formed on EURNZD M5. Characteristics: the support level 1.6808; the resistance level 1.6832; the width of the pattern 24 points. If the resistance level is broken, a change in the trend can be predicted with the first target point lying at the distance of 25 points.
The M5 and M15 time frames may have more false entry points.
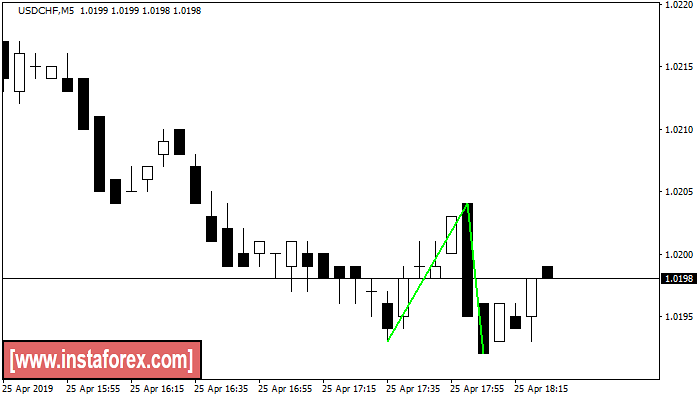
Double Bottom
was formed on 25.04 at 15:25:45 (UTC+0)
signal strength 1 of 5
The Double Bottom pattern has been formed on USDCHF M5. Characteristics: the support level 1.0193; the resistance level 1.0204; the width of the pattern 11 points. If the resistance level is broken, a change in the trend can be predicted with the first target point lying at the distance of 12 points.
The M5 and M15 time frames may have more false entry points.
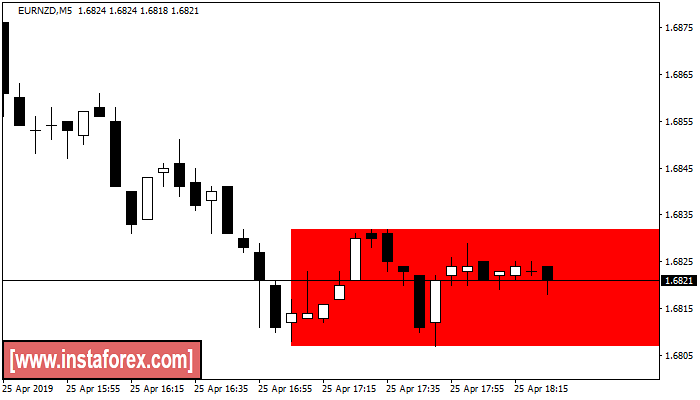
Bullish Rectangle
was formed on 25.04 at 15:28:26 (UTC+0)
signal strength 1 of 5
According to the chart of M5, EURNZD formed the Bullish Rectangle. This type of a pattern indicates a trend continuation. It consists of two levels: resistance 1.6832 - 0.0000 and support 1.6807 – 1.6807. In case the resistance level 1.6807 - 1.6807 is broken, the instrument is likely to follow the bearish trend.
The M5 and M15 time frames may have more false entry points.