akuno1
Fun Poster
- Messages
- 605
- Joined
- Oct 1, 2009
- Messages
- 605
- Reaction score
- 7
- Points
- 20
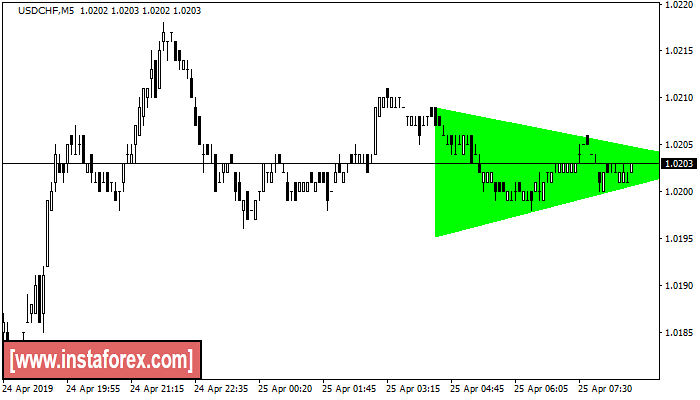
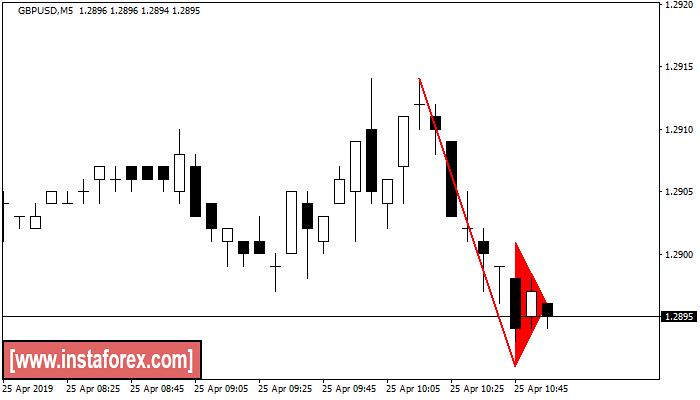
Bullish symmetrical triangle
was formed on 25.04 at 04:44:13 (UTC+0)
signal strength 3 of 5
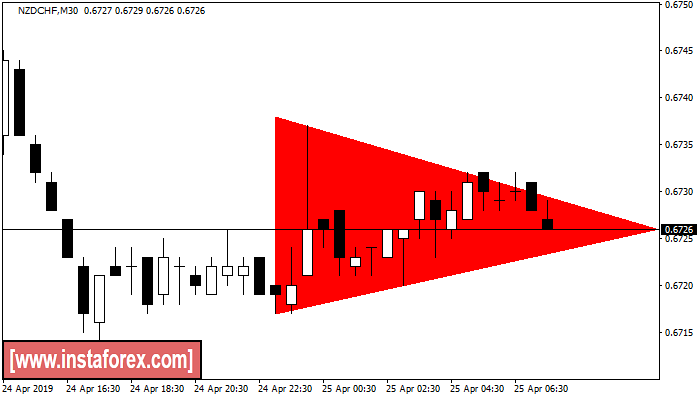
According to the chart of M30, NZDCHF formed the Bullish symmetrical triangle pattern, which signals the trend will continue. Description. The upper border of the pattern touches the coordinates 0.6717/0.6726 whereas the lower border goes across 0.6738/0.6726. The pattern width is measured on the chart at -21 pips. If the Bullish symmetrical triangle pattern is in progress during the upward trend, this indicates the current trend will go on. In case 0.6726 is broken, the price could continue its move toward 0.
was formed on 25.04 at 04:44:13 (UTC+0)
signal strength 3 of 5
According to the chart of M30, NZDCHF formed the Bullish symmetrical triangle pattern, which signals the trend will continue. Description. The upper border of the pattern touches the coordinates 0.6717/0.6726 whereas the lower border goes across 0.6738/0.6726. The pattern width is measured on the chart at -21 pips. If the Bullish symmetrical triangle pattern is in progress during the upward trend, this indicates the current trend will go on. In case 0.6726 is broken, the price could continue its move toward 0.