akuno1
Fun Poster
- Messages
- 605
- Joined
- Oct 1, 2009
- Messages
- 605
- Reaction score
- 7
- Points
- 20
Bullish Rectangle
was formed on 31.07 at 09:31:28 (UTC+0)
signal strength 2 of 5
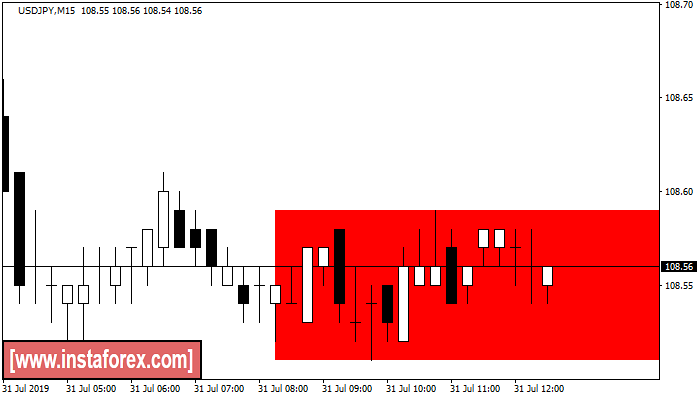
According to the chart of M15, USDJPY formed the Bullish Rectangle. This type of a pattern indicates a trend continuation. It consists of two levels: resistance 108.59 - 0.00 and support 108.51 – 108.51. In case the resistance level 108.51 - 108.51 is broken, the instrument is likely to follow the bearish trend.
The M5 and M15 time frames may have more false entry points.
was formed on 31.07 at 09:31:28 (UTC+0)
signal strength 2 of 5
According to the chart of M15, USDJPY formed the Bullish Rectangle. This type of a pattern indicates a trend continuation. It consists of two levels: resistance 108.59 - 0.00 and support 108.51 – 108.51. In case the resistance level 108.51 - 108.51 is broken, the instrument is likely to follow the bearish trend.
The M5 and M15 time frames may have more false entry points.