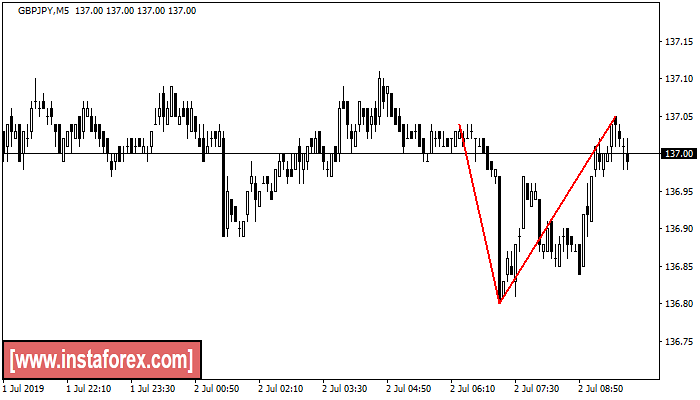
Double Top
was formed on 02.07 at 06:55:15 (UTC+0)
signal strength 1 of 5
The Double Top pattern has been formed on GBPJPY M5. It signals that the trend has been changed from upwards to downwards. Probably, if the base of the pattern 136.80 is broken, the downward movement will continue.
The M5 and M15 time frames may have more false entry points.
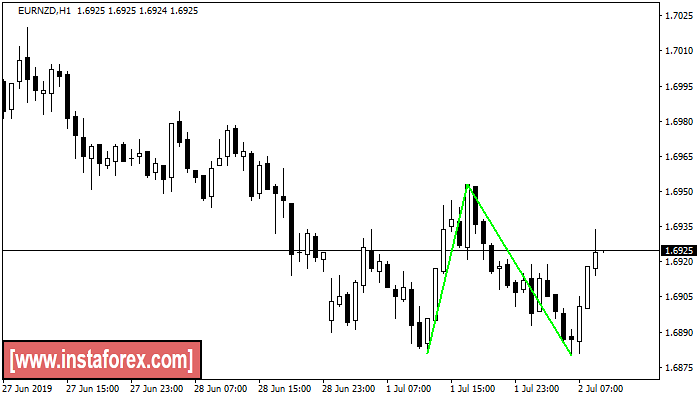
Double Bottom
was formed on 02.07 at 07:00:26 (UTC+0)
signal strength 4 of 5
The Double Bottom pattern has been formed on EURNZD H1. Characteristics: the support level 1.6881; the resistance level 1.6953; the width of the pattern 72 points. If the resistance level is broken, a change in the trend can be predicted with the first target point lying at the distance of 73 points.
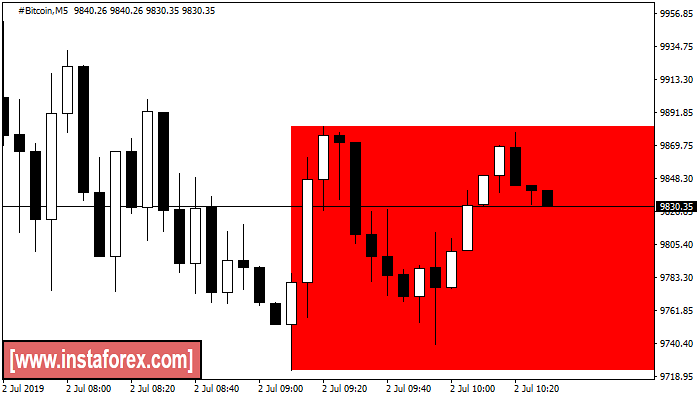
Bullish Rectangle
was formed on 02.07 at 07:32:43 (UTC+0)
signal strength 1 of 5
According to the chart of M5, #Bitcoin formed the Bullish Rectangle which is a pattern of a trend continuation. The pattern is contained within the following borders: lower border 9722.75 – 9722.75 and upper border 9882.50 – 9882.50. In case the lower border is broken, the instrument is likely to follow the downward trend.
The M5 and M15 time frames may have more false entry points.
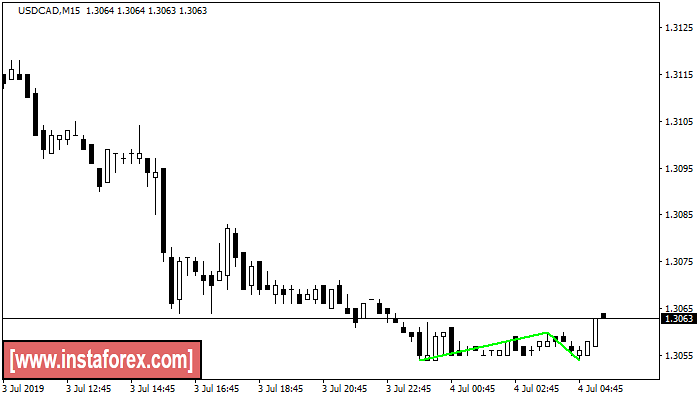
Double Bottom
was formed on 04.07 at 02:31:07 (UTC+0)
signal strength 2 of 5
The Double Bottom pattern has been formed on USDCAD M15; the upper boundary is 1.3060; the lower boundary is 1.3054. The width of the pattern is 6 points. In case of a break of the upper boundary 1.3060, a change in the trend can be predicted where the width of the pattern will coincide with the distance to a possible take profit level.
The M5 and M15 time frames may have more false entry points.
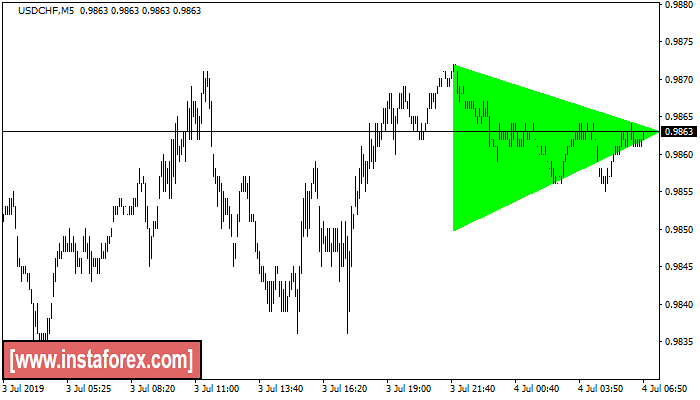
Bearish Symmetrical Triangle
was formed on 04.07 at 03:55:39 (UTC+0)
signal strength 1 of 5
According to the chart of M5, USDCHF formed the Bearish Symmetrical Triangle pattern. Description: The lower border is 0.9872/0.9863 and upper border is 0.9850/0.9863. The pattern width is measured on the chart at 22 pips. The formation of the Bearish Symmetrical Triangle pattern evidently signals a continuation of the downward trend. In other words, if the scenario comes true and USDCHF breaches the lower border, the price could continue its move toward 0.
The M5 and M15 time frames may have more false entry points.
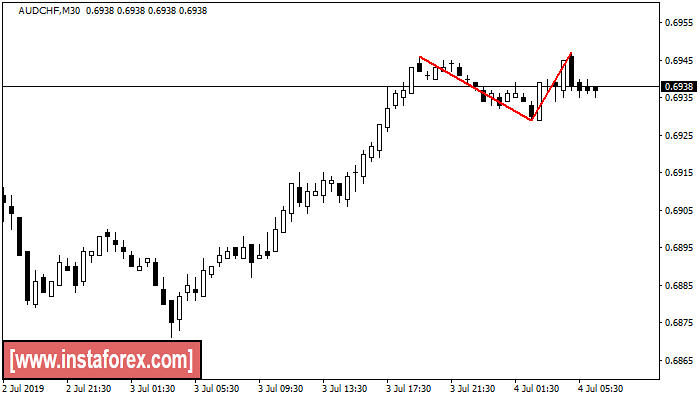
Double Top
was formed on 04.07 at 04:00:30 (UTC+0)
signal strength 3 of 5
The Double Top reversal pattern has been formed on AUDCHF M30. Characteristics: the upper boundary 0.6946; the lower boundary 0.6929; the width of the pattern is 18 points. Sell trades are better to be opened below the lower boundary 0.6929 with a possible movements towards the 0.6899 level.
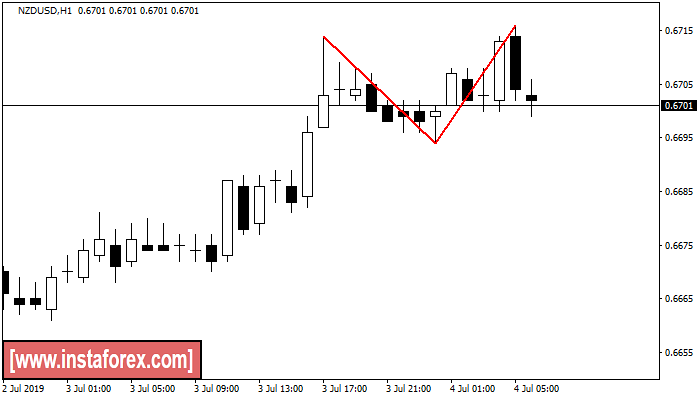
Double Top
was formed on 04.07 at 04:01:11 (UTC+0)
signal strength 4 of 5
On the chart of NZDUSD H1 the Double Top reversal pattern has been formed. Characteristics: the upper boundary 0.6716; the lower boundary 0.6694; the width of the pattern 22 points. The signal: a break of the lower boundary will cause continuation of the downward trend targeting the 0.6654 level.
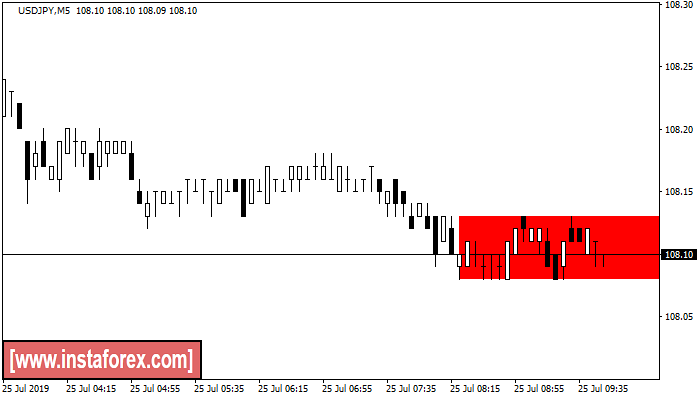
Bullish Rectangle
was formed on 25.07 at 06:51:07 (UTC+0)
signal strength 1 of 5
According to the chart of M5, USDJPY formed the Bullish Rectangle. This type of a pattern indicates a trend continuation. It consists of two levels: resistance 108.13 - 0.00 and support 108.08 – 108.08. In case the resistance level 108.08 - 108.08 is broken, the instrument is likely to follow the bearish trend.
The M5 and M15 time frames may have more false entry points.
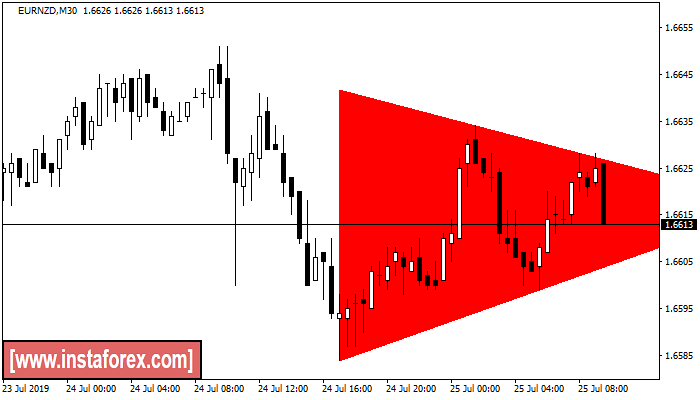
Bullish symmetrical triangle
was formed on 25.07 at 06:52:53 (UTC+0)
signal strength 3 of 5
According to the chart of M30, EURNZD formed the Bullish symmetrical triangle pattern. Description: This is the pattern of a trend continuation. 1.6584 and 1.6642 are the coordinates of the upper and lower borders respectively. The pattern width is measured on the chart at -58 pips. Outlook: If the upper border 1.6584 is broken, the price is likely to continue its move by 1.6587 pips.
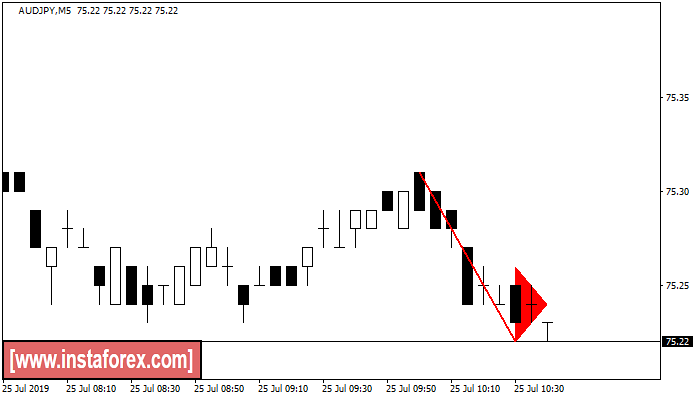
Bearish pennant
was formed on 25.07 at 07:45:29 (UTC+0)
signal strength 1 of 5
The Bearish pennant pattern has formed on the AUDJPY M5 chart. This pattern type is characterized by a slight slowdown after which the price will move in the direction of the original trend. In case the price fixes below the pattern’s low of 75.22, a trader will be able to successfully enter the sell position.
The M5 and M15 time frames may have more false entry points.