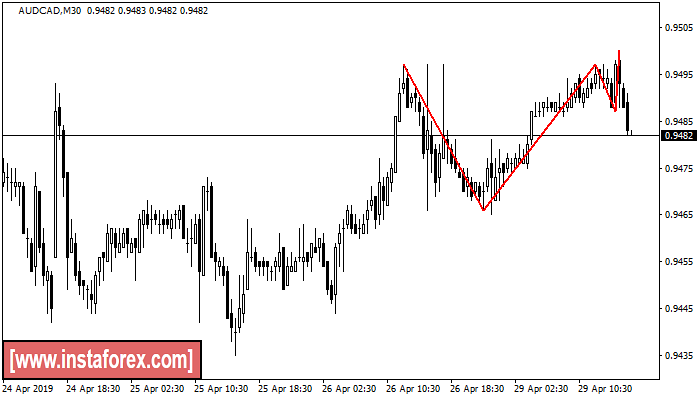
riple Top
was formed on 29.04 at 14:00:30 (UTC+0)
signal strength 3 of 5
The Triple Top pattern has formed on the chart of the AUDCAD M30. Features of the pattern: borders have an ascending angle; the lower line of the pattern has the coordinates 0.9466/0.9487 with the upper limit 0.9497/0.9500; the projection of the width is 31 points. The formation of the Triple Top figure most likely indicates a change in the trend from upward to downward. This means that in the event of a breakdown of the support level of 0.9466, the price is most likely to continue the downward movement.
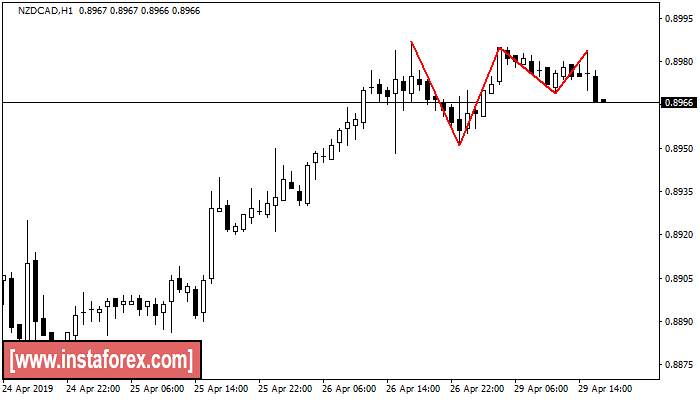
Triple Top
was formed on 29.04 at 14:00:39 (UTC+0)
signal strength 4 of 5
The Triple Top pattern has formed on the chart of the NZDCAD H1 trading instrument. It is a reversal pattern featuring the following characteristics: resistance level 3, support level -18, and pattern’s width 36. Forecast If the price breaks through the support level 0.8951, it is likely to move further down to 0.8945.
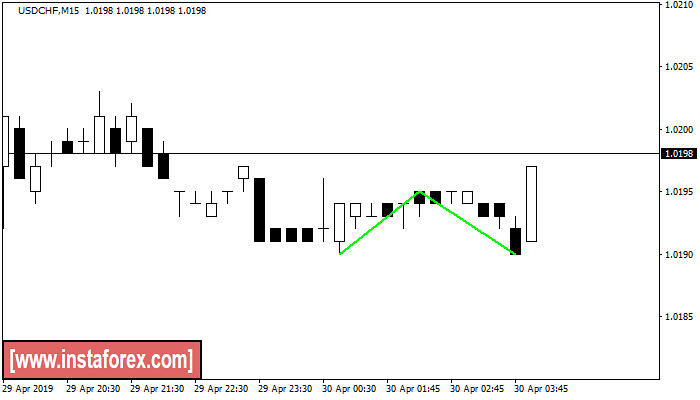
Double Bottom
was formed on 30.04 at 01:15:24 (UTC+0)
signal strength 2 of 5
The Double Bottom pattern has been formed on USDCHF M15. This formation signals a reversal of the trend from downwards to upwards. The signal is that a buy trade should be opened after the upper boundary of the pattern 1.0195 is broken. The further movements will rely on the width of the current pattern 5 points.
The M5 and M15 time frames may have more false entry points.
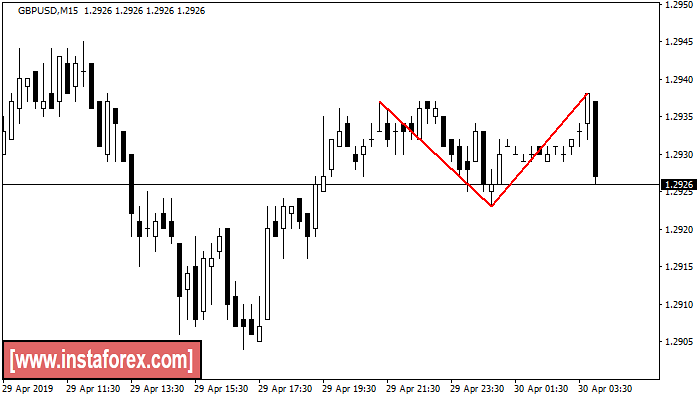
Double Top
was formed on 30.04 at 01:15:25 (UTC+0)
signal strength 2 of 5
The Double Top pattern has been formed on GBPUSD M15. It signals that the trend has been changed from upwards to downwards. Probably, if the base of the pattern 1.2923 is broken, the downward movement will continue.
The M5 and M15 time frames may have more false entry points.
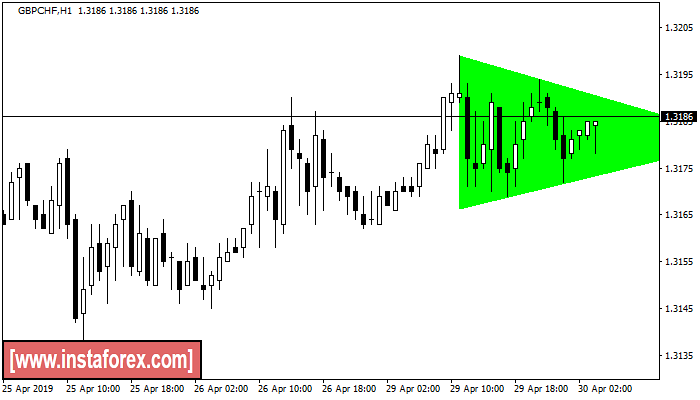
Bearish Symmetrical Triangle
was formed on 30.04 at 02:00:39 (UTC+0)
signal strength 4 of 5
According to the chart of H1, GBPCHF formed the Bearish Symmetrical Triangle pattern. Trading recommendations: A breach of the lower border 1.3199 is likely to encourage a continuation of the downward trend.
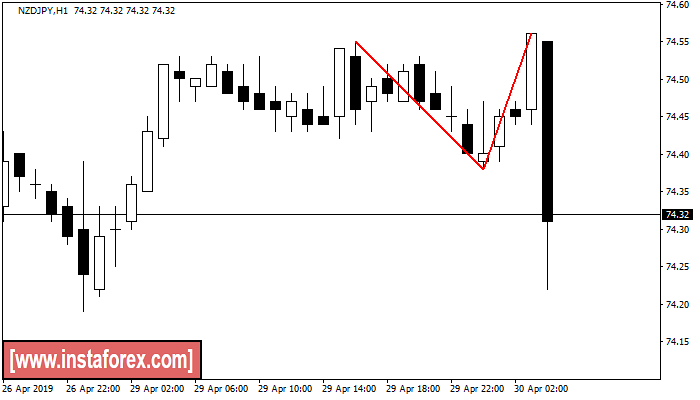
Double Top
was formed on 30.04 at 02:00:44 (UTC+0)
signal strength 4 of 5
The Double Top pattern has been formed on NZDJPY H1. It signals that the trend has been changed from upwards to downwards. Probably, if the base of the pattern 74.38 is broken, the downward movement will continue.
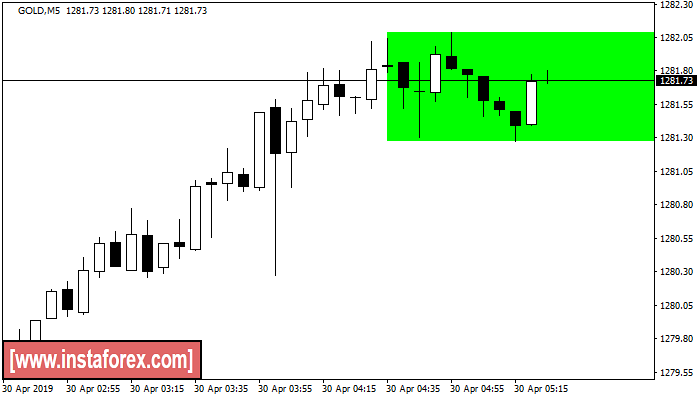
Bearish Rectangle
was formed on 30.04 at 02:27:05 (UTC+0)
signal strength 1 of 5
According to the chart of M5, GOLD formed the Bearish Rectangle which is a pattern of a trend continuation. The pattern is contained within the following borders: the lower border 1281.27 – 1281.27 and upper border 1282.09 – 1282.09. In case the upper border is broken, the instrument is likely to follow the upward trend.
The M5 and M15 time frames may have more false entry points.
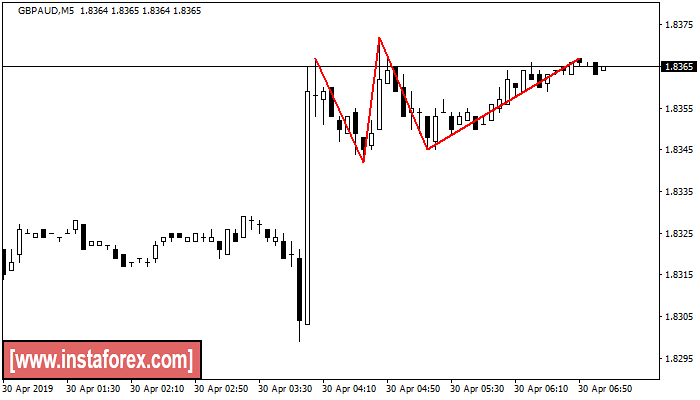
Triple Top
was formed on 30.04 at 04:08:01 (UTC+0)
signal strength 1 of 5
On the chart of the GBPAUD M5 trading instrument, the Triple Top pattern that signals a trend change has formed. It is possible that after formation of the third peak, the price will try to break through the resistance level 1.8342, where we advise to open a trading position for sale. Take profit is the projection of the pattern’s width, which is 25 points.
The M5 and M15 time frames may have more false entry points.
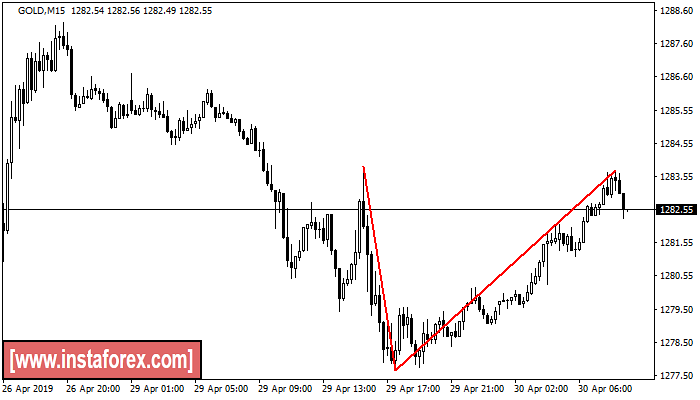
Double Top
was formed on 30.04 at 06:00:19 (UTC+0)
signal strength 2 of 5
On the chart of GOLD M15 the Double Top reversal pattern has been formed. Characteristics: the upper boundary 1283.74; the lower boundary 1277.67; the width of the pattern 607 points. The signal: a break of the lower boundary will cause continuation of the downward trend targeting the 1277.44 level.
The M5 and M15 time frames may have more false entry points.
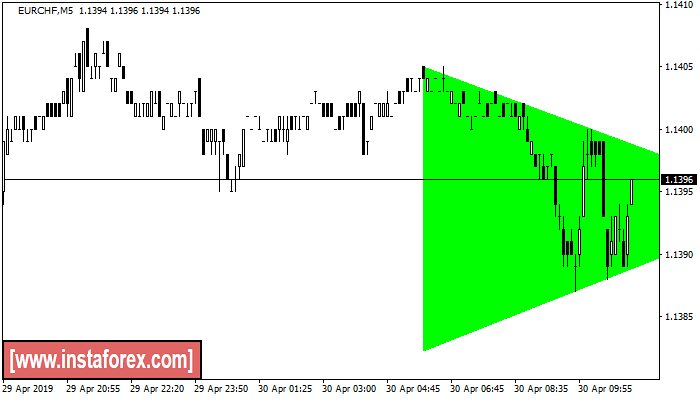
was formed on 30.04 at 08:00:23 (UTC+0)
signal strength 1 of 5
According to the chart of M5, EURCHF formed the Bearish Symmetrical Triangle pattern. Trading recommendations: A breach of the lower border 1.1405 is likely to encourage a continuation of the downward trend.
The M5 and M15 time frames may have more false entry points.