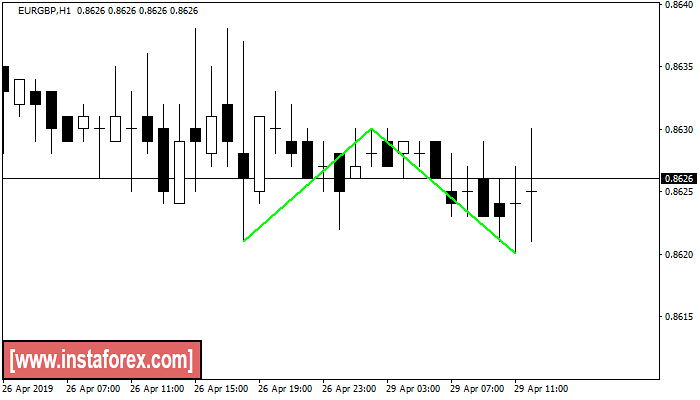
Double Bottom
was formed on 29.04 at 10:00:27 (UTC+0)
signal strength 4 of 5
The Double Bottom pattern has been formed on EURGBP H1. Characteristics: the support level 0.8621; the resistance level 0.8630; the width of the pattern 9 points. If the resistance level is broken, a change in the trend can be predicted with the first target point lying at the distance of 10 points.
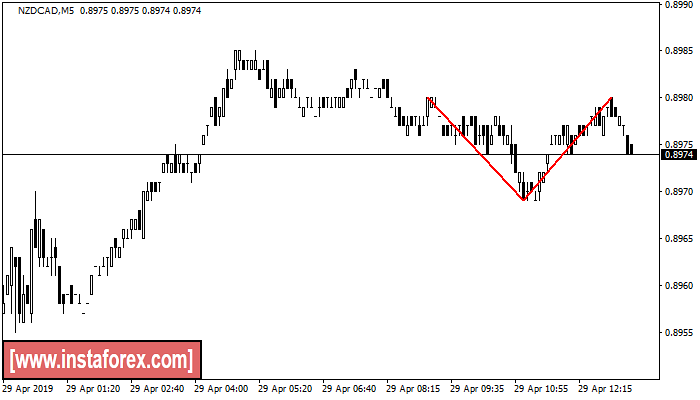
Double Top
was formed on 29.04 at 10:20:38 (UTC+0)
signal strength 1 of 5
On the chart of NZDCAD M5 the Double Top reversal pattern has been formed. Characteristics: the upper boundary 0.8980; the lower boundary 0.8969; the width of the pattern 11 points. The signal: a break of the lower boundary will cause continuation of the downward trend targeting the 0.8954 level.
The M5 and M15 time frames may have more false entry points.
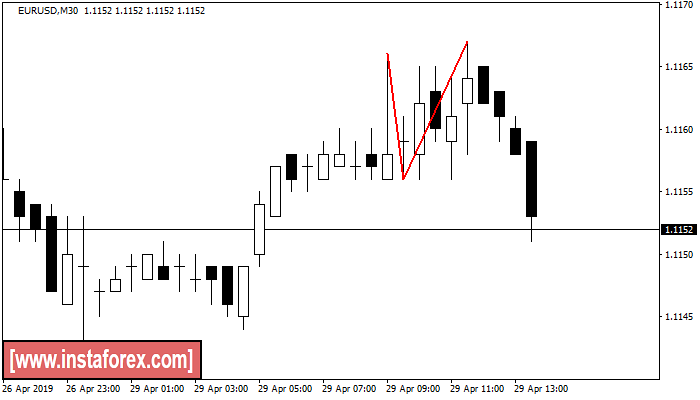
Double Top
was formed on 29.04 at 11:00:21 (UTC+0)
signal strength 3 of 5
The Double Top reversal pattern has been formed on EURUSD M30. Characteristics: the upper boundary 1.1166; the lower boundary 1.1156; the width of the pattern is 11 points. Sell trades are better to be opened below the lower boundary 1.1156 with a possible movements towards the 1.1126 level.
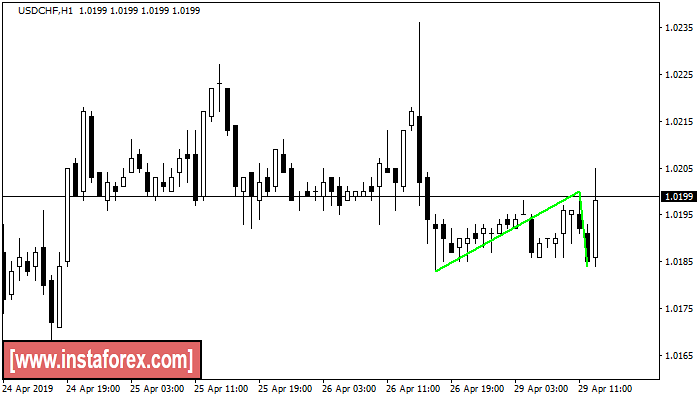
Double Bottom
was formed on 29.04 at 11:00:52 (UTC+0)
signal strength 4 of 5
The Double Bottom pattern has been formed on USDCHF H1. Characteristics: the support level 1.0183; the resistance level 1.0200; the width of the pattern 17 points. If the resistance level is broken, a change in the trend can be predicted with the first target point lying at the distance of 16 points.
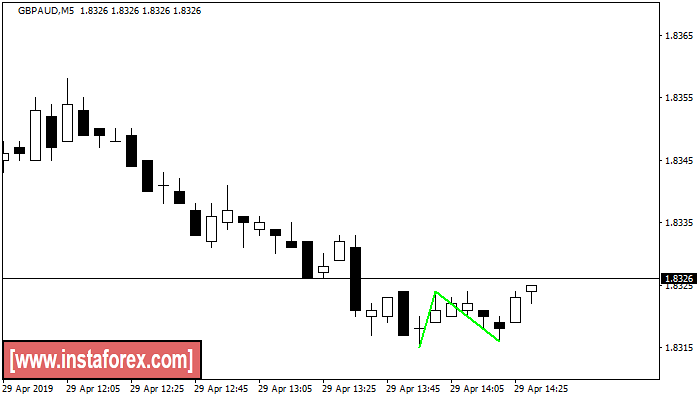
Double Bottom
was formed on 29.04 at 11:35:08 (UTC+0)
signal strength 1 of 5
The Double Bottom pattern has been formed on GBPAUD M5; the upper boundary is 1.8324; the lower boundary is 1.8316. The width of the pattern is 9 points. In case of a break of the upper boundary 1.8324, a change in the trend can be predicted where the width of the pattern will coincide with the distance to a possible take profit level.
The M5 and M15 time frames may have more false entry points.
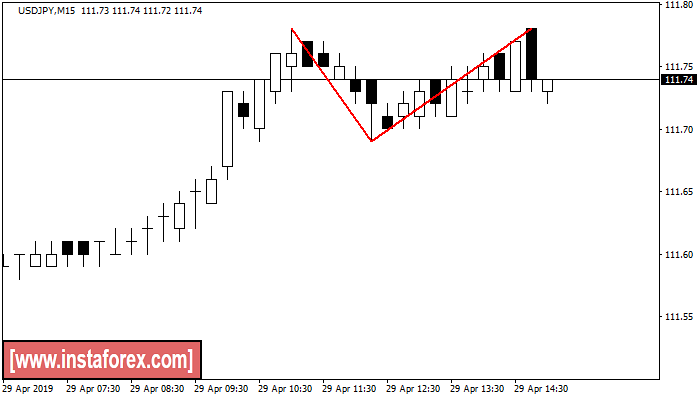
Double Top
was formed on 29.04 at 12:00:40 (UTC+0)
signal strength 2 of 5
On the chart of USDJPY M15 the Double Top reversal pattern has been formed. Characteristics: the upper boundary 111.78; the lower boundary 111.69; the width of the pattern 9 points. The signal: a break of the lower boundary will cause continuation of the downward trend targeting the 111.46 level.
The M5 and M15 time frames may have more false entry points.
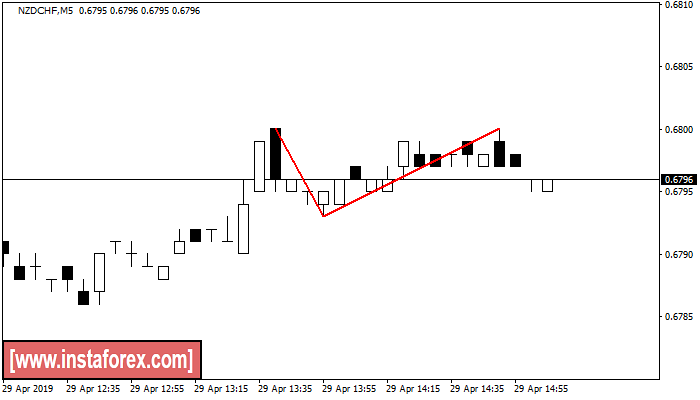
Double Top
was formed on 29.04 at 12:05:54 (UTC+0)
signal strength 1 of 5
The Double Top pattern has been formed on NZDCHF M5. It signals that the trend has been changed from upwards to downwards. Probably, if the base of the pattern 0.6793 is broken, the downward movement will continue.
The M5 and M15 time frames may have more false entry points.
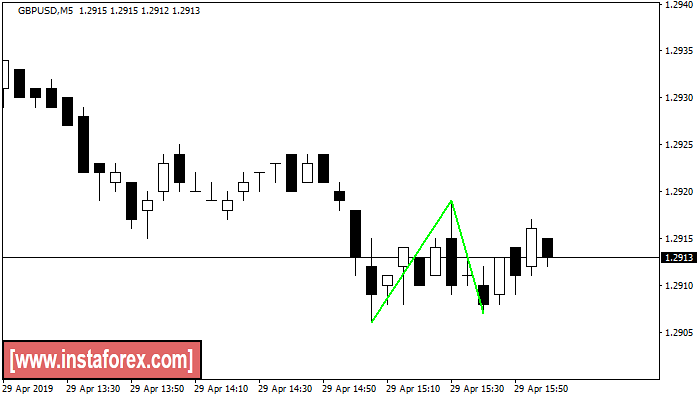
Double Bottom
was formed on 29.04 at 13:00:43 (UTC+0)
signal strength 1 of 5
The Double Bottom pattern has been formed on GBPUSD M5. Characteristics: the support level 1.2906; the resistance level 1.2919; the width of the pattern 13 points. If the resistance level is broken, a change in the trend can be predicted with the first target point lying at the distance of 12 points.
The M5 and M15 time frames may have more false entry points.
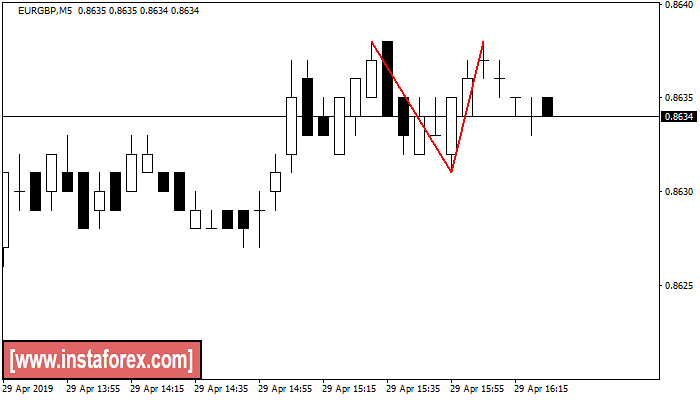
Double Top
was formed on 29.04 at 13:25:44 (UTC+0)
signal strength 1 of 5
The Double Top pattern has been formed on EURGBP M5. It signals that the trend has been changed from upwards to downwards. Probably, if the base of the pattern 0.8631 is broken, the downward movement will continue.
The M5 and M15 time frames may have more false entry points.
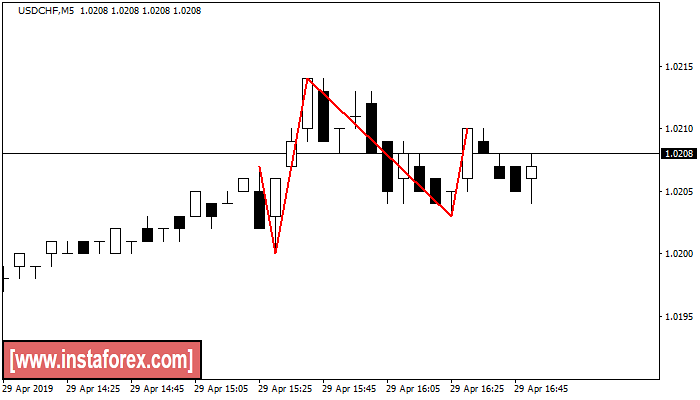
Head and Shoulders
was formed on 29.04 at 13:55:44 (UTC+0)
signal strength 1 of 5
According to the chart of M5, USDCHF formed the Head and Shoulders pattern. The Head’s top is set at 1.0214 while the median line of the Neck is found at 1.0200/1.0203. The formation of the Head and Shoulders pattern evidently signals a reversal of the upward trend. In other words, in case the scenario comes true, the price of USDCHF will go towards 1.0188.
The M5 and M15 time frames may have more false entry points.