BTC USD 75,957.0 Gold USD 4,272.19
Time now: Jun 1, 12:00 AM

⭐ The Weekly Market Matrix: Stocks, Crypto, Geopolitics & Key Events with PlexyTrade

Wednesday 3 June 2026


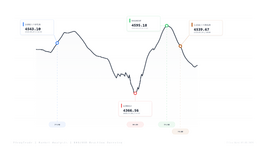
XAU/USD Weekly Analysis — 25 May 2026 to 29 May 2026Timeframe: H1 | Net Move: -0.08% | Range: +5.24% | Bias & Key Risk: Cautiously Bullish


During the week of May 25 to May 29, 2026, spot gold (XAU/USD) executed a dramatic round-trip, ultimately closing virtually flat at $4,539.67 (-0.08%) after testing a key support level at $4,366.56. This high-volatility price action was primarily driven by sharp swings in U.S. Treasury yields, shifting Federal Reserve rate expectations, U.S. dollar movement, and a major geopolitical breakthrough as reports of a possible 60-day U.S.–Iran ceasefire MOU temporarily eased energy-inflation concerns. Although gold staged a powerful 5.24% relief rally from its weekly low, the move failed to fully hold into the close, showing that traders remained cautious despite the improvement in geopolitical sentiment. Looking ahead, the critical question is whether gold can sustain its recovery if yields remain capped, or whether renewed inflation and rate pressure will reassert downward pressure.

As a post-period update, the 3 June 2026 08:00 AM GMT candlestick opened at 4,453.23, which was 1.90% below the 29 May close of 4,539.67, showing that XAU/USD remained under pressure after the weekly rebound.


PRICE ACTION SUMMARY

MetricValue
Period Open4,543.10
Period High4,595.18
Period Low4,366.56
Period Close4,539.67
Net Move (Open → Close)-0.08%
Range Move (Low → High)+5.24%

🔴 RESISTANCE said:
4543.10
🟢 SUPPORT said:
4366.56


FUNDAMENTAL DRIVERS

DXY & REAL YIELDS
The U.S. Dollar Index (DXY) exhibited strong performance early on, climbing to a high of 99.54 on May 28, driven by hawkish Federal Reserve rate expectations and resilient U.S. PMI figures. However, the DXY and U.S. 10-year Treasury yields pulled back later in the week, with the nominal 10-year yield falling from 4.50% on May 26 to close at 4.45% on May 29, following cooler-than-expected monthly PCE inflation data and optimism surrounding a preliminary U.S.-Iran deal. This pullback in yields and the greenback helped spark the sharp late-week recovery in non-yielding spot gold.

CENTRAL BANK ACTIVITYAt the UBS Asian Investment Conference in Hong Kong on May 29, 2026, the World Gold Council's senior market strategist, Joe Cavatoni, confirmed that global central banks continue a robust diversification strategy rather than an explicit de-dollarization play. World Gold Council data showed that the People's Bank of China (PBoC) added 8 metric tons of gold to its official reserves in April, marking its 18th consecutive monthly purchase and lifting its total holdings to 2,322 metric tons, while the National Bank of Kazakhstan and the Czech National Bank added 12 tons and 5 tons respectively, creating a persistent structural floor for gold prices.

GEOPOLITICAL & SAFE HAVENTensions in the Middle East remained high as the 2026 Strait of Hormuz crisis and the broader U.S.-Iran war, which began on February 28, continued to choke maritime energy trade. On May 28, 2026, Axios reported that U.S. and Iranian negotiators had reached a preliminary agreement on a 60-day memorandum of understanding (MOU) to extend the ceasefire and begin nuclear talks. This critical geopolitical breakthrough led to a sharp drop in international oil prices, reducing the safe-haven risk premium but simultaneously easing global inflation concerns and yield pressure.

COT POSITIONINGThe CFTC Commitments of Traders (COT) report for the week ending May 26, 2026, showed large speculators reducing their net long positions in gold futures by 5.6k contracts to 154.3k. Non-commercial large speculators held 200,704 long contracts and 46,444 short contracts, showing a temporary moderation in speculative optimism during the mid-week pullback, while commercial hedgers maintained 74,641 long contracts and 260,407 short contracts as spot gold successfully tested horizontal support near its 200-day moving average.


WHAT TO WATCH NEXT

June 5, 2026
— U.S. Non-Farm Payrolls (NFP) Release
Key labor market data will steer Fed rate expectations and subsequent gold pricing.

June 17, 2026 — FOMC Interest Rate DecisionFederal Reserve policy guidance will directly influence U.S. real yields and the DXY.


BIAS & KEY RISK said:
CAUTIOUSLY BULLISH

While the temporary de-escalation in the Middle East removes immediate safe-haven bid energy, the subsequent retreat in U.S. Treasury yields and resilient central bank purchasing should continue to support gold. Holding the 200-day moving average on the weekly dip signals strong institutional buying interest near structural support. We expect gold to consolidate with an upward bias as long as yields remain capped below 4.50%.

CRITICAL RISK: The primary risk is a formal collapse of the temporary U.S.-Iran ceasefire negotiations, which would reignite energy inflation fears and force yields higher.


The chart below illustrates the movement of XAU/USD from 25 May to 29 May 2026, based on the 1-hour candlestick timeframe.


Profit Study:

Imagine entering XAU/USD near the period open at 4,543.10 before the sharp decline toward the weekly low.

On a 1 standard lot position, this move from 4,543.10 to 4,366.56 represented a market range of 176.54 points, equal to a potential gross movement of $17,654. Based on the opening price, the required margin would have been approximately $908.62 with 1:500 leverage or $227.16 with 1:2000 leverage.

Alternatively, traders who missed the downside move could have focused on the rebound from the weekly low of 4,366.56 to the weekly high of 4,595.18. This recovery covered 228.62 points, equal to a potential gross movement of $22,862 on a 1 standard lot position. Based on the weekly low price, the required margin would have been approximately $873.31 with 1:500 leverage or $218.33 with 1:2000 leverage.

This was the power of volatility. Traders did not need to capture the full move perfectly — even a partial position within that range could have created a significant opportunity for those who were prepared, disciplined, and aware of the risks.
 

Attachments

  • 150.3 KB Views: 18
Thursday 4 June 2026

Brent Crude Oil Turned Volatile as Hormuz Risk Clashed With Ceasefire Hopes

Analysis | 1–4 June 2026 | Brent Crude Oil (1-Hour Chart)

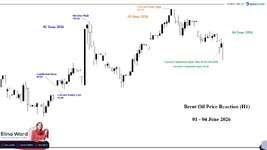
Brent Crude Oil Price Reaction: 1–4 June 2026

The chart shows Brent Crude Oil moving through a highly volatile structure between 1 June and 4 June 2026.
According to the provided 1-hour chart, Brent opened at 95.20 on 1 June, briefly slipped to 94.86, then rallied sharply to an intraday high of 100.06 later that day. The bullish momentum extended into 3 June, when Brent reached a higher peak of 101.07, before pulling back toward the 98.40 area by 4 June.
From the 1 June open at 95.20 to the 3 June high at 101.07, Brent gained approximately 6.17%. From the 3 June high at 101.07 to the 4 June level of 98.40, it declined around 2.64%. Measured from the 1 June open to the 4 June level, Brent remained higher by approximately 3.36%.

What Caused the Move?

The first major driver was renewed geopolitical risk around Iran, the United States, Israel, Lebanon, and the Strait of Hormuz.
On 1 June, oil prices rose sharply after reports that Iran had halted indirect message exchanges with the United States. This damaged confidence that a quick diplomatic agreement could reopen or normalize flows through the Strait of Hormuz. The market had already been pricing severe supply disruption risk, but the breakdown in communication reduced hopes that a near-term deal was close.

Reports indicated that Brent settled more than 4% higher on 1 June, at 94.98, after Iran’s Tasnim news agency said Tehran had stopped indirect negotiations with Washington and that plans were being discussed to block the Strait of Hormuz and disrupt other shipping routes. That official futures settlement level is separate from the higher intraday level shown on the provided chart.

The second driver was renewed military escalation. On 3 June, Middle East hostilities flared again, with reports of Iranian missile activity toward Kuwait and Bahrain and U.S. strikes near Iran’s Qeshm Island. This added another layer of supply-risk buying because the market was already sensitive to any headline involving Hormuz, Gulf shipping lanes, or direct U.S.-Iran escalation.

The third driver was tightening U.S. crude supply. The EIA reported that U.S. commercial crude inventories fell by 8.0 million barrels in the week ending 29 May, leaving stockpiles at 433.7 million barrels, about 3% below the five-year average for this time of year. This crude draw was larger than analysts had expected and supported the bullish move. However, the inventory report was not entirely bullish across all petroleum products, because gasoline inventories rose by 3.4 million barrels and distillate inventories rose by 1.5 million barrels.

Why Brent Pulled Back on 4 June

The pullback on 4 June was mainly caused by partial risk-premium unwinding after Israel and Lebanon agreed to implement a ceasefire. That headline raised hopes that broader regional tensions could ease and that diplomacy involving Iran and the United States could regain momentum.

Brent therefore moved lower from the 3 June high, but the decline was limited rather than a full reversal. The market still faced unresolved supply concerns, including restricted Hormuz flows, fragile diplomatic conditions, and the recent large U.S. crude inventory draw.

Weak Chinese demand also helped cap the rally. Reports indicated that Iranian oil was being offered at discounts and Russian crude premiums were easing as sellers competed for Chinese buyers. This suggested that demand-side support was not strong enough to keep Brent firmly above the 101 area shown on the chart.

Final Takeaway

Brent’s move from 95.20 to above 101.00 on the provided 1-hour chart was mainly driven by the re-pricing of geopolitical risk after Iran-U.S. talks stalled, Hormuz reopening hopes weakened, and fresh regional hostilities revived supply-disruption concerns.

The large U.S. crude inventory draw added fundamental support, while the 4 June pullback toward 98.40 reflected partial risk-premium deflation after the Israel-Lebanon ceasefire headline. Overall, Brent’s movement was not caused by one single factor. It was driven by a clash between supply-risk buying and ceasefire-related selling pressure.

Price Action Summary


MovementFromToPoint Move% MoveVisual Move
Open to 4 June Price95.2098.40+3.20+3.36%🟢 +3.20 ↗ / +3.36% ↗
Period Low to Period High94.86101.07+6.21+6.55%🟢 +6.21 ↗ / +6.55% ↗
Period High to 4 June Price101.0798.40-2.67-2.64%🔴 -2.67 ↘ / -2.64% ↘


The chart below illustrates the movement of Brent Crude Oil on a 1-hour timeframe from 1 June to 4 June 2026.
 

Attachments

High-Impact Economic Calendar – 8–12 June 2026

Week Overview

This week focused on inflation data, trade balances, central bank decisions, production figures, and consumer sentiment, with major attention on U.S. CPI, U.S. PPI, the ECB Interest Rate Decision, China trade data, and UK GDP releases.
Times in GMT
All events are 🔴 HIGH IMPACT for traders


Monday, 8 Jun 2026

Time

Country

Event

Forecast

Previous

Impact

06:00

🇩🇪 DE

Factory Orders MoM (APR)

1.0%

5.0%

🔴 High


Tuesday, 9 Jun 2026

Time
Country
Event
Forecast
Previous
Impact
00:30
🇦🇺 AU

Westpac Consumer Confidence Change (JUN)

-1.2%

3.5%

🔴 High

01:30

🇦🇺 AU

NAB Business Confidence (MAY)

-22

-24

🔴 High

03:00

🇨🇳 CN

Imports YoY (MAY)


25.3%

🔴 High

03:00

🇨🇳 CN

Balance of Trade (MAY)

$89B

$84.82B

🔴 High

03:00

🇨🇳 CN

Exports YoY (MAY)


14.1%

🔴 High

06:00

🇩🇪 DE

Industrial Production MoM (APR)

0.5%

-0.7%

🔴 High

06:00

🇩🇪 DE

Balance of Trade (APR)

€13.6B

€14.3B

🔴 High

12:30

🇺🇸 US

Balance of Trade (APR)

-$57.9B

-$60.3B

🔴 High

12:30

🇨🇦 CA

Balance of Trade (APR)

C$1.5B

C$1.78B

🔴 High

14:00

🇺🇸 US

Existing Home Sales (MAY)

3.9M

4.02M

🔴 High

14:00

🇺🇸 US

Existing Home Sales MoM (MAY)

-3.0%

0.2%

🔴 High

23:50

🇯🇵 JP

PPI YoY (MAY)

5.5%

4.9%

🔴 High

23:50

🇯🇵 JP

PPI MoM (MAY)

0.5%

2.3%

🔴 High


Wednesday, 10 Jun 2026


Time
Country
Event
Forecast
Previous
Impact
01:30
🇨🇳 CN

Inflation Rate YoY (MAY)

1.4%

1.2%

🔴 High

01:30

🇨🇳 CN

PPI YoY (MAY)

3.1%

2.8%

🔴 High

12:30

🇺🇸 US

Inflation Rate YoY (MAY)

3.9%

3.8%

🔴 High

12:30

🇺🇸 US

Core Inflation Rate YoY (MAY)

2.8%

2.8%

🔴 High

12:30

🇺🇸 US

Core Inflation Rate MoM (MAY)

0.3%

0.4%

🔴 High

13:45

🇨🇦 CA

BoC Interest Rate Decision

2.25%

2.25%

🔴 High

23:01

🇬🇧 GB

RICS House Price Balance (MAY)

-15%

-34%

🔴 High


Thursday, 11 Jun 2026


Time
Country
Event
Forecast
Previous
Impact
12:15
🇪🇺 EA

Deposit Facility Rate

2.25%

2.0%

🔴 High

12:15

🇪🇺 EA

ECB Interest Rate Decision

2.4%

2.15%

🔴 High

12:30

🇺🇸 US

PPI MoM (MAY)

0.3%

1.4%

🔴 High

12:30

🇺🇸 US

PPI YoY (MAY)

6.8%

6.0%

🔴 High

12:30

🇺🇸 US

Initial Jobless Claims (Jun/06)


225K

🔴 High

12:30

🇨🇦 CA

Building Permits MoM (APR)

-5.0%

10.3%

🔴 High

12:45

🇪🇺 EA

ECB Press Conference


🔴 High


Friday, 12 Jun 2026

Time
Country
Event
Forecast
Previous
Impact
06:00
🇬🇧 GB

GDP MoM (APR)

0.1%

0.3%

🔴 High

06:00

🇬🇧 GB

Industrial Production MoM (APR)

0.3%

-0.2%

🔴 High

06:00

🇬🇧 GB

Balance of Trade (APR)

-£4.1B

-£9.658B

🔴 High

14:00

🇺🇸 US

Michigan Consumer Sentiment Prel (JUN)

46.0

44.8

🔴 High


Week Summary
This week’s focus centered on U.S. inflation data, ECB policy, China trade figures, and UK growth releases, with Wednesday’s U.S. CPI report and Thursday’s ECB Interest Rate Decision, ECB Press Conference, and U.S. PPI data expected to be the key volatility drivers. Planning ahead for these high-impact releases can help prepare for major market-moving moments across currencies, commodities, stocks, and indices before the week unfolds.
 

Monday 08 June 2026

S&P 500 Fell Sharply as AI Momentum Reversed Into Jobs, Rates, and Semiconductor Pressure

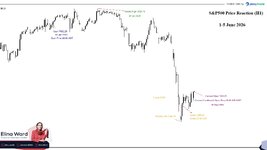
S&P 500 Price Reaction: 1–5 June 2026


The S&P 500 opened the week at 7,582.25 on 1 June 2026 at 22:00 GMT. At the start of the period, buyers remained active as the market continued to build on strong technology and AI-related momentum. Large-cap technology and semiconductor names remained key drivers of sentiment, helping the index push higher early in the week.

The strongest point of the week came on 2 June, when the S&P 500 reached a weekly high of 7,620.75. This move reflected continued optimism around the AI trade, with investors still favoring chipmakers and technology companies that had led the broader market rally.

However, after reaching the weekly high, the index began to lose strength. The bullish structure became more fragile as investors reacted to higher Treasury yields, stronger labor-market expectations, and renewed geopolitical tension linked to the Iran conflict and Strait of Hormuz supply risk. These factors made traders more cautious, especially while the index was already trading near elevated levels.

Selling pressure increased sharply on 5 June. A stronger-than-expected U.S. jobs report reduced expectations for easier Federal Reserve policy and raised concerns that interest rates could stay higher for longer. This pressured growth and technology stocks, which are more sensitive to rising yields.

The decline was especially visible across semiconductor and AI-linked stocks. The same names that had supported the S&P 500’s earlier rally became the main source of weakness as traders took profit from crowded positions. Because large-cap technology carries a heavy weight inside the index, the selloff in this group pulled the broader S&P 500 lower.

According to the chart, the S&P 500 reached its weekly low at 7,344.25 on 5 June before recovering slightly into the close. The index ended the period at 7,389.25 on 5 June at 23:00 GMT.

Price Action Summary

MovementFromToPoint Move% MoveVisual Move
Open to Weekly Close7,582.257,389.25-193.00-2.55%🔴 -193.00 ↘ / -2.55% ↘
Weekly High to Weekly Low7,620.757,344.25-276.50-3.63%🔴 -276.50 ↘ / -3.63% ↘
Weekly Low to Current Open Price7,344.257,416.25+72.00+0.98%🟢 +72.00 ↗ / +0.98% ↗

Overall, the S&P 500 fell 193.00 points, or 2.55%, from its weekly open to weekly close. From the weekly high to the weekly low, the index dropped 276.50 points, or 3.63%, showing a deeper intraperiod reversal. After touching the weekly low, the index recovered 72.00 points, or 0.98%, toward the current open price of 7,416.25.


The move showed a clear shift in sentiment. Early in the week, the S&P 500 was supported by AI optimism, strong technology leadership, and record-level momentum. By the end of the week, stronger jobs data, higher rate expectations, geopolitical risk, and profit-taking in semiconductor stocks had turned that momentum into a sharp bearish reversal.

The chart below illustrates the movement of the S&P 500 from 1–5 June 2026, based on a 1-hour candlestick timeframe.


Attachments

Tuesday 09 June 2026

BTCUSD Fell Sharply as ETF Outflows, Jobs Data, and Middle East Risk Hit Sentiment​

BTCUSD Weekly Review: 1–7 June 2026​

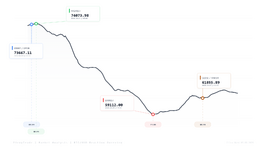
The chart below illustrates the movement of BTCUSD on an intraday candlestick timeframe from 1 June to 7 June 2026, with the 9 June opening price also shown for context.

BTCUSD moved through a sharply bearish trading week as Bitcoin came under pressure from weakening ETF demand, stronger U.S. labor data, rising Treasury yields, a stronger U.S. dollar, and renewed geopolitical risk in the Middle East.

According to the chart, Bitcoin opened the week at 73,667.11 on 1 June and reached a weekly high of 74,073.98 early in the period. From that point, sellers took control. BTCUSD failed to hold the 70,000 zone, continued lower through the mid-60,000 area, and eventually reached a weekly low of 59,112.00 on 5 June.

Price Action Summary​

MovementFromToPoint Move% MoveVisual Move
Weekly Open to Weekly Close73,667.1161,855.89-11,811.22-16.03%🔴 -11,811.22 / -16.03%
Weekly High to Weekly Low74,073.9859,112.00-14,961.98-20.20%🔴 -14,961.98 / -20.20%
Weekly Close to Current Open (9 June 2026 08:00 AM GMT)61,855.8963,179.50+1,323.61+2.14%🟢 +1,323.61 / +2.14%

BTCUSD closed the week at 61,855.89 on 7 June, marking a 16.03% decline from weekly open to weekly close. From the weekly high to the weekly low, Bitcoin fell 20.20%, showing that the move was not a minor pullback but a sharp repricing of risk. After the weekly close, the 9 June current open at 63,179.50 showed a modest 2.14% rebound from the 7 June close, but the broader weekly structure remained bearish.
The first major trigger was the reversal in spot Bitcoin ETF flows. U.S. spot Bitcoin ETFs had been one of the strongest sources of institutional demand during Bitcoin’s earlier rally, but the redemption wave in late May and early June weakened that support. As ETF outflows increased, Bitcoin lost an important demand pillar, and traders began reducing risk exposure.

The second trigger was the technical break below the 70,000 area. Once BTCUSD failed to hold that zone, selling pressure accelerated. The chart showed a clean sequence of lower highs and lower lows, confirming that the market had shifted from consolidation into downside momentum. The move toward 59,112.00 showed that sellers were in control going into the 5 June session.

The strongest macro trigger came from the U.S. May jobs report on 5 June. The report showed that nonfarm payrolls increased by 172,000, while unemployment remained unchanged at 4.3%. This stronger labor-market reading pushed back against expectations for easier monetary policy and strengthened the higher-for-longer interest-rate narrative. For Bitcoin, that was negative because higher yields and a stronger dollar usually reduce appetite for speculative and non-yielding assets.

Geopolitical risk added another layer of pressure. Renewed Middle East tensions pushed oil-risk back into focus, raising concerns that higher energy prices could keep inflation pressure elevated. That made the macro backdrop more difficult for Bitcoin, especially as traders were already dealing with ETF outflows, rising yields, and weakening technical momentum.

The weekly low at 59,112.00 was the key stress point. Bitcoin briefly broke below the psychological 60,000 level, but it did not fully collapse from there. Buyers returned near the lows and pushed BTCUSD back above 61,000 into the weekly close. This recovery showed that the low-60,000 region still attracted demand, even though the overall weekly move remained strongly negative.

Strategy’s 1,550 BTC purchase for about $101.3 million between 1 June and 7 June provided a small confidence signal after the selloff. However, the buy was not enough to reverse the broader market pressure. ETF outflows, macro repricing, higher yields, dollar strength, and geopolitical uncertainty remained the dominant forces behind the weekly decline.

Overall, BTCUSD fell because several bearish forces arrived at the same time. ETF outflows weakened institutional demand, the break below 70,000 damaged technical sentiment, the stronger U.S. jobs report reduced rate-cut expectations, Treasury yields stayed elevated, and Middle East oil-risk added another inflation concern.

The key takeaway from the week was that Bitcoin was not moving only on crypto-specific news. The 1–7 June decline showed that BTCUSD was being driven by the full macro environment: labor data, yields, dollar strength, ETF flows, geopolitical risk, and technical support levels all worked together to push the market lower.

Profit Study:

Imagine catching BTCUSD near the weekly high at 74,073.98 before the drop.

With approximately $740.74 margin on 1:100 leverage, a 1 standard lot BTCUSD position could have given traders exposure to the full movement of 1 BTC.

As BTCUSD moved from the weekly high of 74,073.98 to the weekly low of 59,112.00, the market covered a powerful 14,961.98-point range. For a short position held across that full move, this could have produced approximately $14,961.98 in theoretical gross profit, before spreads, commissions, swaps, slippage, and execution costs.

That is the power — and the risk — of volatility. Traders did not need to catch the full move perfectly; even a partial position inside that range could have created serious opportunity for those who were prepared, disciplined, and managing risk properly.

ETF outflows, stronger U.S. jobs data, higher yields, and geopolitical tension all worked together to pressure BTCUSD lower. The question is: was this only a sharp correction, or the start of a deeper Bitcoin repricing?
 

Attachments

Wednesday 10 June 2026

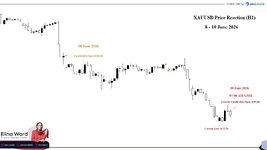
XAU/USD Analysis — 08 June 2026 to 10 June 2026
Timeframe: H1 | Net Move: -3.11% | Range: -4.45% | Bias & Key Risk: Bearish with Event Risk


From 08 June to 10 June 2026, spot gold (XAU/USD) remained under strong pressure, falling from an opening level of 4,328.94 to a current low of 4,172.54, before stabilising around the 4,194 area. The move showed that gold was unable to hold a strong safe-haven bid despite rising geopolitical tension across the Middle East. Instead, traders focused more heavily on the inflation impact of higher oil prices, stronger U.S. labour-market data, rising Treasury-yield pressure, and the possibility that the Federal Reserve may keep policy tighter for longer.

The market reaction was important because geopolitical risk usually supports gold. However, in this case, renewed U.S.–Iran hostilities, Israel-Iran tension, and the wider Israel-Lebanon/Hezbollah risk fed directly into oil-market concerns. Higher oil prices increased inflation worries, and those inflation worries strengthened expectations that the Fed may delay rate cuts or even remain more hawkish. Since gold does not pay interest, higher rate expectations reduced demand for XAU/USD and pushed the metal lower through the period.


PRICE ACTION SUMMARY

MetricValue
Period Open4,328.94
Period High4,358.35
Period Low4,172.54
Latest Visible Price4,194.43
Net Move (Open → Latest Price)-3.11%
Open → Low Move-3.61%
Range Move (Low → High)-4.45%

🔴 RESISTANCE said:
4,328.94 / 4,358.35 — XAU/USD failed to sustain recovery above the Monday opening zone and later rejected the higher consolidation area near 4,358.

🟢 SUPPORT said:
4,172.54 — Current period low and the key level reached during the sharp decline into 10 June.


FUNDAMENTAL DRIVERS

U.S. JOBS DATA, YIELDS & FED EXPECTATIONS

The pressure on gold began before the new week after stronger-than-expected U.S. payrolls reinforced the idea that the Federal Reserve may not need to support the economy with near-term rate cuts. A resilient labour market made traders more sensitive to inflation risk and pushed attention back toward U.S. Treasury yields. This weighed on non-yielding gold because higher yields increase the opportunity cost of holding XAU/USD.

U.S. INFLATION DATA
The upcoming May U.S. CPI release became one of the main risk events for gold during the 08–10 June period. Traders were watching whether higher oil prices and wider cost pressures were feeding into consumer inflation. A stronger inflation reading would support the view that the Fed could stay hawkish for longer, which kept gold under selling pressure ahead of the data.

FED INTEREST RATE DECISION
The next FOMC decision on 16–17 June also played a major role in the move. The market was already reducing expectations for near-term easing, while stronger jobs data and higher energy prices made the rate outlook more restrictive. This kept XAU/USD vulnerable, as gold tends to struggle when markets price in higher real yields and a firmer U.S. dollar.

GEOPOLITICAL & SAFE HAVEN
Geopolitical risk was clearly present, but it did not support gold in the normal way. Renewed U.S.–Iran hostilities, Israel-Iran tension, and the wider Israel-Lebanon/Hezbollah risk added uncertainty to global markets. However, the key transmission channel was oil. As conflict risk lifted energy prices, traders focused on the inflation consequences rather than only buying gold as a safe haven. This turned geopolitical risk into an inflation-and-Fed-pressure story, which worked against XAU/USD.

OIL, INFLATION & GOLD
The rise in oil prices created the most important macro link for gold. Higher oil prices can feed into transport, production, and consumer costs, keeping inflation elevated. If inflation stays high, the Fed has less room to cut rates. That is why gold fell even while geopolitical risk remained high: the market treated the conflict as a reason for higher inflation and tighter policy, not just as a reason to seek safety.


INTERMARKET CORRELATIONS

AssetMove / BiasContext
Gold (XAU/USD)-3.11%Gold fell from 4,328.94 to the 4,194 area as rate pressure outweighed safe-haven demand.
OilHigher / VolatileMiddle East escalation supported oil prices and raised inflation concerns.
U.S. Treasury YieldsHawkish PressureStronger jobs data and inflation risk kept the market focused on higher-for-longer Fed policy.
U.S. DollarFirm BiasA stronger rate outlook supported the dollar backdrop and added pressure on gold.


WHAT TO WATCH NEXT

June 10, 2026
— U.S. CPI Inflation Release

The inflation reading is the key short-term event for XAU/USD. A stronger reading would reinforce higher-for-longer Fed expectations, while softer inflation would reduce some of the pressure on gold.

June 16–17, 2026 — FOMC Interest Rate Decision
The Fed’s policy statement and guidance will be critical for gold because the market is focused on whether inflation and energy risks will keep policy restrictive.

Middle East Developments — U.S.–Iran, Israel-Iran, and Israel-Lebanon Risk
Any further escalation could keep oil prices elevated and maintain inflation pressure. Any de-escalation could reduce the energy-risk premium, but the effect on gold will depend on how yields and the dollar react.


BIAS & KEY RISK said:
BEARISH WITH EVENT RISK

XAU/USD remained under bearish pressure from 08 June to 10 June as the market focused on U.S. rate expectations, inflation risk, higher oil prices, and renewed Middle East tensions. The key point is that geopolitical risk did not create a strong gold rally because the conflict increased inflation fears and reinforced the possibility of a more hawkish Federal Reserve.

CRITICAL RISK: The main risk for gold is a sharp change in the inflation or Fed outlook. A stronger U.S. CPI reading or more hawkish Fed guidance could keep pressure on XAU/USD, while softer inflation or a cooling in oil-driven risk could allow gold to stabilise after the sharp decline.


Profit Study:​

Imagine entering XAU/USD near the period open at 4,328.94 before the sharp decline toward the current low.

On a 1 standard lot XAU/USD position, assuming 1 standard lot equals 100 ounces, this move from 4,328.94 to 4,172.54 represented a market range of 156.40 points, equal to a potential gross movement of $15,640. Based on the opening price, the required margin would have been approximately $865.79 with 1:500 leverage or $216.45 with 1:2000 leverage.

This was the power of volatility. Traders did not need to capture the full move perfectly — even a partial position within that range could have created a significant opportunity for those who were prepared, disciplined, and aware of the risks. However, the same volatility could also create significant losses if the market moved against the position, especially when using high leverage.
 

Attachments

Thursday 11 June 2026

Brent Crude Oil Turned Volatile as Middle East Risk Drove Sharp Price Swings

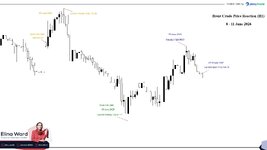
Brent Crude Oil Price Reaction: 8–11 June 2026


Brent Crude Oil moved through a highly volatile trading structure during this period, as traders reacted to shifting Middle East headlines, renewed U.S.–Iran tensions, and uncertainty around the Strait of Hormuz.

According to the chart, Brent opened at 97.07 at 00:00 GMT on 8 June and initially rallied sharply, reaching a weekly high of 99.68. This early rise reflected strong geopolitical risk pricing, as renewed tensions involving Iran, Israel, and Lebanon increased concerns over wider instability in the Middle East. The market was especially sensitive because any escalation involving Iran raised fears over Gulf supply routes and the security of energy flows through the region.

However, the rally did not hold. After reaching the weekly high, Brent reversed aggressively and moved lower throughout 8 June and 9 June. The sell-off reached a weekly low of 91.11 at 16:00 GMT on 9 June. From the weekly high to the weekly low, Brent fell by around 8.60%, showing how quickly the initial risk premium faded once traders reassessed whether the geopolitical tensions would lead to an immediate disruption in physical oil supply.

The market then began to recover from the 9 June low. Brent rebounded into 10 June and 11 June as attention shifted back toward direct U.S.–Iran escalation and the potential threat to the Strait of Hormuz. Renewed military tensions, Iranian retaliation risks, and uncertainty over whether vessels could safely move through the region helped rebuild the supply-risk premium. On 11 June, Brent climbed to an intraday high of 96.81 before easing back toward the current open price of 94.73.

Despite the rebound, Brent failed to return to the 8 June weekly high. This showed that the market remained nervous, but not fully convinced that the worst-case supply disruption scenario had materialized. From the 8 June open of 97.07 to the current open price of 94.73, Brent was still down around 2.41%.

Price Action Summary

MovementFromToPoint Move% Move
Open to Current Open Price97.0794.73-2.34-2.41%
Weekly High to Weekly Low99.6891.11-8.57-8.60%
Current Weekly Low to Current Open Price91.1194.73+3.62+3.97%

What Was Behind the Movement?

The first major driver was geopolitical risk. Brent initially moved higher because traders priced in renewed Middle East instability. Reports of renewed Israel–Iran tension, alongside Lebanon-related risks involving Hezbollah, increased fears that the wider conflict could remain active. This supported the early move toward 99.68.

The second driver was de-escalation pricing and profit-taking. After the early rally, Brent dropped sharply as traders reassessed the immediate supply threat. When geopolitical headlines do not quickly translate into confirmed physical supply disruptions, oil prices often give back part of the risk premium. This appears to be what happened during the sharp fall from 99.68 to 91.11.

The third and most important driver was U.S.–Iran escalation. By 10–11 June, the focus had shifted away from Israel–Lebanon alone and toward direct U.S.–Iran confrontation. This mattered more for Brent because Iran is directly connected to Gulf shipping risk, while the Strait of Hormuz remains one of the world’s most important oil chokepoints. Any threat to that route can immediately affect expectations for crude supply, tanker traffic, shipping insurance, and energy prices.

Was Israel–Lebanon Responsible, or Was It Mainly Iran and the U.S.?

Israel–Lebanon did play a role, but it was not the main driver of Brent’s larger move.

The Lebanon angle mattered because Israeli action involving Hezbollah risked complicating Iran’s position in the wider conflict. This helped fuel the first wave of geopolitical concern on 8 June. In that sense, Israel–Lebanon acted as a secondary trigger that added pressure to an already fragile Middle East situation.

However, the stronger and more direct oil-market driver was U.S.–Iran escalation and the risk around the Strait of Hormuz. The rebound into 10–11 June was more clearly linked to fears of direct confrontation between Washington and Tehran, possible retaliation, and disruption to Gulf energy flows. For Brent traders, this was a more powerful catalyst than Lebanon alone because it carried a direct risk to global crude supply routes.

Conclusion

Between 8 June and 11 June, Brent Crude Oil did not move in one clear direction. It first rallied from 97.07 to 99.68 as Middle East risk increased, then dropped sharply to 91.11 as the initial risk premium faded. After that, Brent recovered toward 94.73 as renewed U.S.–Iran escalation and Hormuz supply concerns returned to focus.

Overall, the chart shows a market caught between geopolitical fear and de-escalation hopes. Israel–Lebanon tensions helped trigger the first wave of risk pricing, but the main driver behind the strongest rebound was direct U.S.–Iran conflict and the possibility of disruption around the Strait of Hormuz.

From the weekly high to the weekly low, Brent fell around 8.60%. From the current weekly low to the current open price, Brent recovered around 3.97%. However, from the 8 June open to the current open price, Brent remained around 2.41% lower, showing that despite the rebound attempts, the market was still under pressure after the early-week spike faded.

Profit Study:


With 1:200 leverage, opening one standard lot at 99.68 required only about $498.40 in margin. But the move from 99.68 down to 91.11 created an $8,570 price opportunity on that same standard lot.

This is where volatility becomes opportunity. The full move was not easy to catch, but even a controlled entry inside that range could have delivered a meaningful result for traders who understood the risk and reacted fast.

When fear cools, oil can fall. When tensions return, oil can climb. The question is simple — are you watching the headlines, or are you ready for the move?

The chart below illustrates the movement of Brent Crude Oil on a 1-hour candlestick timeframe from 8 June to 11 June 2026.
 

Attachments

Friday 12 June 2026

📊 High-Impact Economic Calendar – 15–19 June 2026

🌍 Week Overview

This week focused heavily on central bank decisions, inflation data, retail sales, industrial production, and labor market releases, with major attention on the BoJ, RBA, Fed, SNB, and BoE interest rate decisions. The strongest volatility windows were expected around the Fed decision, Fed press conference, BoJ rate decision, and UK inflation data.

Times in GMT

All events are 🔴 HIGH IMPACT for traders


🗓️ Monday, 15 Jun 2026

TimeCountryEventForecastPreviousImpact
09:00🇪🇺 EAIndustrial Production MoM (APR)0.5%0.2%🔴 High
09:00🇪🇺 EABalance of Trade (APR)€12.5B€7.8B🔴 High
12:30🇺🇸 USNY Empire State Manufacturing Index (JUN)919.6🔴 High
13:15🇺🇸 USIndustrial Production MoM (MAY)0.5%0.7%🔴 High

🗓️ Tuesday, 16 Jun 2026

TimeCountryEventForecastPreviousImpact
02:00🇨🇳 CNIndustrial Production YoY (MAY)4.7%4.1%🔴 High
02:00🇨🇳 CNUnemployment Rate (MAY)5.2%5.2%🔴 High
03:00🇯🇵 JPBoJ Interest Rate Decision1.0%0.75%🔴 High
04:30🇦🇺 AURBA Interest Rate Decision4.35%4.35%🔴 High
09:00🇩🇪 DEZEW Economic Sentiment Index (JUN)-16-10.2🔴 High
12:30🇺🇸 USHousing Starts MoM (MAY)-0.3%-2.8%🔴 High
12:30🇺🇸 USBuilding Permits MoM Prel (MAY)-0.9%4.4%🔴 High
23:50🇯🇵 JPImports YoY (MAY)9.7%🔴 High
23:50🇯🇵 JPMachinery Orders MoM (APR)7.0%-9.4%🔴 High
23:50🇯🇵 JPExports YoY (MAY)14.8%🔴 High
23:50🇯🇵 JPBalance of Trade (MAY)-¥200B¥301.9B🔴 High
23:50🇯🇵 JPMachinery Orders YoY (APR)6.6%5.9%🔴 High

🗓️ Wednesday, 17 Jun 2026

TimeCountryEventForecastPreviousImpact
06:00🇬🇧 GBInflation Rate YoY (MAY)3.1%2.8%🔴 High
06:00🇬🇧 GBCore Inflation Rate MoM (MAY)0.3%0.7%🔴 High
06:00🇬🇧 GBCore Inflation Rate YoY (MAY)2.6%2.5%🔴 High
12:30🇺🇸 USRetail Sales MoM (MAY)0.6%0.5%🔴 High
18:00🇺🇸 USFed Interest Rate Decision3.75%3.75%🔴 High
18:30🇺🇸 USFed Press Conference🔴 High
22:45🇳🇿 NZGDP Growth Rate QoQ (Q1)0.8%0.2%🔴 High
22:45🇳🇿 NZGDP Growth Rate YoY (Q1)0.7%1.3%🔴 High

🗓️ Thursday, 18 Jun 2026

TimeCountryEventForecastPreviousImpact
06:00🇬🇧 GBEmployment Change (APR)80K148K🔴 High
06:00🇬🇧 GBUnemployment Rate (APR)5.0%5.0%🔴 High
06:00🇨🇭 CHBalance of Trade (MAY)CHF3.5BCHF3.2B🔴 High
07:30🇨🇭 CHSNB Interest Rate Decision0.0%0.0%🔴 High
11:00🇬🇧 GBBoE Interest Rate Decision3.75%3.75%🔴 High
12:30🇺🇸 USPhiladelphia Fed Manufacturing Index (JUN)9-0.4🔴 High
12:30🇺🇸 USInitial Jobless Claims (JUN/13)226K229K🔴 High
12:30🇨🇦 CAPPI MoM (MAY)0.4%2.0%🔴 High
12:30🇨🇦 CAPPI YoY (MAY)13.0%11.4%🔴 High
22:45🇳🇿 NZBalance of Trade (MAY)NZ$1.3BNZ$1.92B🔴 High
23:30🇯🇵 JPCore Inflation Rate YoY (MAY)1.6%1.4%🔴 High
23:30🇯🇵 JPInflation Rate YoY (MAY)1.6%1.4%🔴 High

🗓️ Friday, 19 Jun 2026

TimeCountryEventForecastPreviousImpact
06:00🇬🇧 GBRetail Sales MoM (MAY)-0.2%-1.3%🔴 High
06:00🇩🇪 DEPPI MoM (MAY)0.5%1.2%🔴 High
06:00🇩🇪 DEPPI YoY (MAY)2.5%1.7%🔴 High
12:30🇨🇦 CARetail Sales MoM Prel (MAY)0.3%0.6%🔴 High

📌 Week Summary

This week’s focus centered on major central bank decisions and inflation releases, with the Fed Interest Rate Decision and Fed Press Conference expected to create the strongest volatility. The BoJ and RBA decisions, UK inflation data, and BoE/SNB rate decisions also created important market-moving windows. Planning ahead for these high-impact releases can help prepare for potential volatility across currencies, commodities, stocks, and indices before the week unfolds.


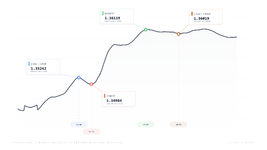
Below is an overview of the Bank of England Interest Rate Decision on April 30, 2026, along with a chart showing its impact on GBP/USD, with price action reflecting the market reaction using a 15-minute candlestick timeframe.

U.K. Official Bank Rate Release - 30 April 2026

The Bank of England kept its key interest rate unchanged at 3.75% on April 30, 2026, as policymakers assessed the economic impact of the Iran war and rising energy prices. The Monetary Policy Committee voted 8-1 in favor of holding rates, with Chief Economist Huw Pill the only member backing a 25-basis-point hike. The central bank warned that inflation was likely to rise later in the year as higher energy and fuel costs passed through the economy, while also noting the risk of second-round effects through wages and prices. However, with the labor market showing signs of loosening and economic growth expected to weaken if energy disruption continued, the BoE judged that keeping rates steady was the appropriate decision. Following the announcement, the pound rose against the dollar, while UK borrowing costs eased as markets digested the central bank’s cautious but alert policy stance.

Potential Profit Study

An entry on GBP/USD at 1.34984 with 1 standard lot would have required approximately $270.00 in margin at 1:500 leverage. At 1:2000 leverage, the margin requirement would have dropped to around $67.49.

The move from 1.34984 to the intraday high of 1.36119 covered approximately 113.5 pips. On a standard lot position, that would represent a potential profit of around $1,135.00.

This example
highlights the potential that market volatility can create. Traders did not need to capture the entire move to benefit — even securing a portion of the price swing could have resulted in a meaningful return for those who had a clear strategy, managed risk effectively, and understood the impact of the underlying market catalyst.

The chart below illustrates GBPUSD price movement on a 15-minute candlestick timeframe from on 30 April 2026 U.K. Official Bank Rate Decision Release.
 

Attachments

Monday 15 June 2026

Intel Stock Surged as AI Optimism, Foundry Momentum, and Broader Risk Appetite Drove Buyers Back In

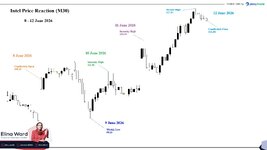
Intel Weekly Price Movement: 8–12 June 2026

The chart shows a sharp and highly volatile weekly move in Intel, with price opening at 109.25 on 8 June 2026, dropping to a weekly low of 99.35 on 9 June, then reversing strongly and reaching a weekly high of 127.51 on 12 June. The week ended with Intel closing at 124.38, only slightly below the weekly peak.

From the weekly low to the weekly high, Intel advanced by approximately 28.34%. From the weekly open to the close, the stock gained around 13.85%, showing that buyers managed to fully recover the early-week weakness and push the price into a strong bullish close.

Price Action Summary

MovementFromToPoint Move% MoveVisual Move
Open to Close109.25124.38+15.13+13.85%🟢 +15.13 / +13.85% ↗️
Weekly Low to Weekly High99.35127.51+28.16+28.34%🟢 +28.16 / +28.34% ↗️

The early decline toward 99.35 suggests that the market initially remained cautious, likely reacting to broader volatility and profit-taking after Intel’s previous rally. However, the selling pressure did not last long. Once price held above the weekly low, momentum began to shift aggressively in favor of buyers.

The main driver behind the rebound was renewed optimism around Intel’s AI and foundry growth story. Bank of America issued a rare double upgrade on Intel, moving the stock from underperform to buy and raising its price target to $135, citing stronger confidence in Intel’s ability to win new manufacturing customers. Reports also pointed to potential or existing relationships involving major names such as Apple, Tesla, SpaceX, Alphabet, and Nvidia, which helped strengthen the market’s confidence in Intel’s foundry business.

Intel also benefited from wider strength in semiconductor and AI-related stocks. Major AI chip and memory names rallied strongly, with Intel gaining alongside AMD and Micron as investors continued to price in demand from artificial intelligence and data-center growth.

The broader market backdrop also helped. Risk sentiment improved after geopolitical tensions eased and oil prices fell sharply following the US-Iran peace framework, reducing immediate inflation concerns and supporting global equities. Lower energy pressure can be positive for growth and technology stocks because it reduces fears of tighter monetary policy and weaker corporate margins.

Technically, the move became powerful after Intel broke above the 10 June intraday high at 111.41 and later cleared the 11 June intraday high at 119.34. These breakouts likely triggered additional momentum buying, forcing short sellers and cautious traders to re-enter the market. The final push toward 127.51 confirmed that buyers had taken full control of the weekly structure.

However, the slight pullback from 127.51 to the 124.38 close shows that some traders took profit near the weekly high. This is normal after such a fast move, especially when the stock had already climbed sharply from the weekly low. The close remained strong, but the upper rejection suggests that Intel may need fresh confirmation before extending the rally further.

Overall, Intel’s weekly movement was driven by a combination of AI demand optimism, stronger confidence in its foundry business, analyst upgrades, semiconductor sector momentum, and improved global risk sentiment. The stock’s ability to recover from 99.35 and close near the weekly high indicates that buyers remained dominant into the end of the week.

Profit Study:

Imagine catching the weekly low at 99.35 — with 1:20 leverage, the required margin would have been just $496.75. From there, Intel rallied to 127.51, creating a 28.16-point move, equal to a potential $2,816 profit.

The beauty? You did not need to catch the exact weekly high. Any exit above the 99.35 entry level would have kept the position in profit, while the full low-to-high move shows how powerful the weekly reversal became.


Attachments

Tuesday 16 June 2026

BTCUSD Rebounded Strongly as Geopolitical Relief Restored Risk Appetite

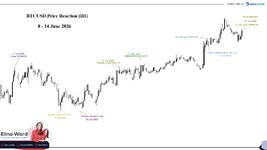
BTCUSD Price Reaction: 8–14 June 2026

BTCUSD moved through a strong bullish recovery between 8 June and 14 June 2026, as early-week selling pressure was replaced by steady buying momentum into the end of the week. According to the chart, Bitcoin opened at 63,300.04 on 8 June, dropped to a weekly low of 60,750.09 on 10 June, then rallied sharply to a weekly high of 65,887.82, before closing the period at 65,607.58 on 14 June.

The first part of the move showed weakness. After opening near 63,300.04, BTCUSD failed to hold its early level and moved lower into 9 June. Bitcoin reached an intraday low of 60,769.89, showing that sellers were still active as broader market sentiment remained cautious.

The strongest downside pressure appeared into 10 June 2026, when Bitcoin extended the decline and reached its weekly low at 60,750.09. From the 8 June open to the weekly low, BTCUSD fell by 2,549.95 points, equal to -4.03%. This reflected a clear risk-off reaction as macro uncertainty, inflation concerns, and geopolitical tension in the Middle East weighed on market sentiment.

However, Bitcoin did not continue lower after testing the 60,750 area. Buyers returned near the weekly support zone, and BTCUSD began to recover. On 11 June, Bitcoin reached an intraday high of 63,900.30, showing that downside momentum was starting to fade. The recovery continued on 12 June, when BTCUSD pushed higher again and reached an intraday high of 64,376.32.

The rebound was mainly supported by improving geopolitical sentiment. Earlier in the week, heightened Middle East tension and concerns around energy-market disruption pressured risk assets, including Bitcoin. Later, as headlines shifted toward de-escalation and diplomatic relief around the U.S.–Iran situation, investors became more willing to return to risk-sensitive assets.

This helped strengthen the market’s view that Bitcoin was reacting not only to crypto-specific flows, but also to the broader global macro environment. During the early sell-off, BTCUSD behaved more like a risk asset than a safe haven. Once geopolitical stress eased and risk appetite improved, buyers regained control and pushed Bitcoin higher into the end of the week.

By 14 June 2026, BTCUSD had reached a weekly high of 65,887.82 before closing at 65,607.58. The small pullback from the weekly high showed some profit-taking near the top of the move, but Bitcoin still held most of its weekly advance.

It is important to note that Bitcoin’s movement was not driven by price action alone. The chart reflected a clear shift in sentiment: early geopolitical pressure pushed BTCUSD down to 60,750.09, but de-escalation hopes and improving risk appetite helped buyers regain control and drive Bitcoin sharply higher into the weekly close.

Price Action Summary

MovementPeriodFromToPoint Move% MoveVisual Move
Open to Close8–14 Jun 202663,300.0465,607.58+2,307.54+3.65%🟢 +2,307.54 ↗ / +3.65% ↗
Weekly Low to Weekly High8–14 Jun 202660,750.0965,887.82+5,137.73+8.46%🟢 +5,137.73 ↗ / +8.46% ↗

Final Takeaway

BTCUSD opened the period on 8 June, fell to its weekly low on 10 June, then rallied strongly to its weekly high before closing higher on 14 June. From the weekly low to the weekly high, Bitcoin gained +8.46%. From the original 8 June open to the 14 June close, BTCUSD finished higher by +3.65%.

The chart also shows that BTCUSD opened higher at 07:00 AM GMT on 16 June 2026, extending the positive follow-through after the weekly recovery. This placed Bitcoin +1.25% above the 14 June close and +4.94% above the 8 June June open.

Overall, Bitcoin’s movement from 8 June to 14 June 2026 was mainly driven by the shift from early-week geopolitical pressure into stronger late-week risk appetite. Middle East tension, inflation concerns, and oil-market uncertainty initially pushed BTCUSD lower, while improving U.S.–Iran diplomatic expectations and broader geopolitical relief helped support the recovery. The weekly support zone held firmly, allowing buyers to regain control and drive Bitcoin higher into the weekly close, with the 16 June open confirming that bullish momentum remained active after the reviewed period.
 

Attachments

Live Forex Chart

Currency
Rates
EUR / USD
1.14718
USD / JPY
156.167
GBP / USD
1.33804
USD / CHF
0.82481
USD / CAD
1.39892
EUR / JPY
179.152
AUD / USD
0.70868
Back
Top
Log in Register