BTC USD 76,160.4 Gold USD 4,341.92
Time now: Jun 1, 12:00 AM

⭐ The Weekly Market Matrix: Stocks, Crypto, Geopolitics & Key Events with PlexyTrade

Monday 18 May 2026

Apple Climbed as Strong Earnings, Buybacks, and China Optimism Outweighed Inflation Pressure

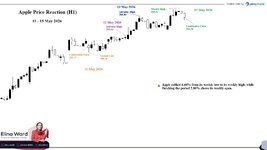
Apple Price Reaction: 11–15 May 2026


Apple moved through a strong upward trading structure between 11 May and 15 May 2026, as the stock was supported by company-specific momentum while the broader market faced inflation and geopolitical pressure. According to the chart, Apple opened at 292.17 on 11 May, dropped to a period low of 290.16, then rallied sharply as buyers returned to the stock.

The first upside reaction appeared on 12 May 2026, when Apple reached an intraday high of 295.16. This move came despite a difficult macro backdrop, as U.S. CPI rose 0.6% month over month and 3.8% year over year in April, while Treasury yields climbed and U.S. stock indexes weakened after the inflation release.

The strongest continuation appeared on 13 May 2026, when Apple pushed to an intraday high of 300.84. This move aligned with company-specific support from Apple’s latest fiscal Q2 results. Apple reported revenue of $111.2 billion, up 17% year over year, while diluted EPS rose 22% to $2.01. The company also reported March-quarter records for total revenue, iPhone revenue, and EPS, while Services revenue reached a new all-time high.

Investor sentiment was also supported by Apple’s capital-return announcement. Apple declared a $0.27 per-share dividend, payable on 14 May 2026, to shareholders of record as of 11 May 2026. More importantly, the board authorized an additional $100 billion share repurchase program, which helped reinforce confidence in the stock during a macro-heavy week.
Another supportive factor came from the China narrative. Reuters reported that Apple CEO Tim Cook joined President Donald Trump’s China visit alongside other major U.S. executives. For Apple, this mattered because China remained central to both its manufacturing chain and consumer market exposure.

However, the China visit was not a clean bullish catalyst. Reuters later reported that America’s most powerful CEOs had little to show from the trip, with limited clarity around confirmed commercial outcomes. This meant Apple’s China-related support was more about sentiment, market-access optimism, and investor positioning than a confirmed Apple-specific breakthrough.

Macro pressure worked against the stock during the same period. On 13 May, U.S. PPI rose 1.4% month over month and 6.0% year over year, its largest monthly gain since March 2022 and biggest annual rise since December 2022. Reuters linked the inflation pressure partly to the Iran war and disruption around the Strait of Hormuz, which kept bond yields and rate concerns in focus.

By 15 May 2026, Apple reached the chart’s highest point at 303.11 before pulling back slightly and closing at 300.34. The chart therefore showed a strong rally from 290.16 to 303.11, followed by a modest reversal into the final close.

It is important to note that Apple’s movement was not driven by one single event. The chart reflected a two-sided market reaction: strong earnings, iPhone and Services momentum, the $100 billion buyback, and China-related optimism supported the price, while hot CPI, hot PPI, higher yields, Iran-related energy inflation, and limited clarity from the Trump-Xi summit prevented the rally from extending further.
Apple’s broader investment story also remained part of the background. Earlier in 2026, Apple said it was expanding U.S. manufacturing, including Mac mini production in Houston, advanced AI server production, and plans to purchase well over 100 million advanced chips from TSMC’s Arizona facility. This was not a fresh 11–15 May catalyst, but it reinforced Apple’s supply-chain and investment narrative.

On the chart, this conflict produced a rally from 290.16 to 303.11, followed by a partial pullback toward the 300.34 closing reference level by 15 May.

Price Action Summary

MovementFromToPrice MoveTick Move*% MoveVisual Move
Open to Weekly Close292.17300.34+8.17+817 ticks+2.80%🟢 +8.17 ↗ / +2.80% ↗
Period Low to Period High290.16303.11+12.95+1,295 ticks+4.46%🟢 +12.95 ↗ / +4.46% ↗

Final Takeaway

Apple opened the period at 292.17, dropped to an early low of 290.16, then rallied strongly to a period high of 303.11 before closing at 300.34. From the period low to the period high, Apple gained +12.95 points, equal to +4.46%. From the high to the final 15 May close, Apple fell -2.77 points, equal to -0.91%, showing that most of the weekly rally remained intact.

Overall, Apple’s movement from 11 May to 15 May 2026 was mainly driven by the clash between strong company-specific support and heavy macro pressure. Earnings strength, iPhone and Services momentum, the $100 billion buyback, and optimism around Tim Cook’s presence in China helped Apple move higher. At the same time, hot CPI, hot PPI, higher Treasury yields, Iran-related energy inflation, and limited clarity from the Trump-Xi summit prevented the rally from extending further.


The chart below illustrates the movement of Apple Inc. on a 1-hour candlestick timeframe from 11 to 15 May 2026.


Attachments

  • 105.8 KB Views: 11
Tuesday 19 May 2026

BTCUSD Turned Lower as Inflation Pressure, ETF Outflows, and Geopolitical Risk Overpowered Crypto Regulation Optimism

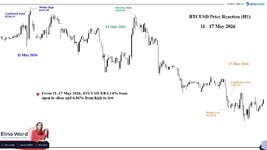
BTCUSD Price Reaction: 11–17 May 2026

BTCUSD moved through a volatile but clearly bearish trading structure between 11 May and 17 May 2026, as the market was pulled between crypto-regulation optimism, U.S. inflation pressure, rising Treasury yields, spot Bitcoin ETF outflows, and renewed geopolitical risk. According to the chart, Bitcoin opened at 82,241.49 on 11 May, briefly reached a period high of 82,361.68, then dropped sharply to a period low of 76,715.78 before closing the period at 77,191.32 on 17 May.

The first major pressure point came from macroeconomics. The U.S. Consumer Price Index report showed that inflation rose 0.6% in April, while the annual inflation rate increased to 3.8%. Energy prices rose 3.8% month-on-month and 17.9% year-on-year, which kept inflation risk firmly in focus for markets. For BTCUSD, this mattered because hotter inflation reduced risk appetite and strengthened the case for a higher-rate environment.

Inflation pressure strengthened further after the U.S. Producer Price Index report. The BLS reported that final demand prices rose 1.4% in April and 6.0% over the previous 12 months, while final demand goods increased 2.0%. More than three-quarters of the goods increase was linked to a 7.8% jump in final demand energy, with gasoline rising 15.6%. This reinforced the view that energy-driven inflation was still feeding into the broader economy.

The bond market also confirmed the tighter macro backdrop. The Federal Reserve’s H.15 data showed the U.S. 10-year Treasury yield rising from 4.42% on 11 May to 4.59% on 15 May, while the 2-year yield rose from 3.95% to 4.09% across the same period. Rising yields weighed on high-volatility assets because they made the broader risk environment less supportive for speculative markets such as crypto.

Geopolitics added another layer of pressure through the energy channel. Reuters reported that oil prices settled almost 3% higher on 11 May after President Donald Trump said the Iran ceasefire was “on life support,” leaving the Strait of Hormuz largely closed with no clear end to the war. This mattered for Bitcoin because the oil shock fed directly into inflation concerns, which then pressured risk assets through the rates channel.

Bitcoin-specific news was mixed. On the positive side, the U.S. Senate Banking Committee advanced long-awaited crypto legislation on 14 May, a milestone for digital-asset regulation. Reuters reported that the bill would create cryptocurrency regulations and proceed to the full Senate after receiving support from two Democrats. This helped explain why BTCUSD attempted to stabilize and rebound during the middle of the week.
However, that positive reaction failed to hold because spot Bitcoin ETF flows turned sharply negative. Farside Investors data showed U.S. spot Bitcoin ETF flows of +$27.2M on 11 May, followed by -$233.2M on 12 May, -$630.4M on 13 May, +$131.3M on 14 May, and -$290.4M on 15 May. Across the trading week, this created nearly $1.0B in net ETF outflows, which directly weakened institutional demand for Bitcoin.
It is important to note that BTCUSD’s movement was not driven by one single event. The chart reflected a two-sided market reaction: crypto-regulation progress supported sentiment temporarily, while inflation pressure, rising Treasury yields, oil-linked geopolitical risk, and heavy ETF outflows dominated the broader weekly direction.

On the chart, this conflict produced a move from the 82,361.68 period high down to the 76,715.78 period low, followed by a 17 May close at 77,191.32.

Price Action Summary

MovementFromToPrice MovePoint Move% MoveVisual Move
Open to Close Move82,241.4977,191.32-5,050.17-5,050.17 pts-6.14%🔴 -5,050.17 ↘ / -6.14% ↘
Period High to Period Low82,361.6876,715.78-5,645.90-5,645.90 pts-6.86%🔴 -5,645.90 ↘ / -6.86% ↘

Final Takeaway

BTCUSD opened the period at 82,241.49, briefly reached a period high of 82,361.68, then reversed sharply to a period low of 76,715.78 before closing at 77,191.32 on 17 May 2026. From the 11 May open to the 17 May close, Bitcoin fell -5,050.17 points, equal to -6.14%. From the period high to the period low, BTCUSD dropped -5,645.90 points, equal to -6.86%, showing that the week’s structure was clearly bearish despite temporary rebound attempts.

Overall, BTCUSD’s movement from 11 May to 17 May 2026 was mainly driven by the clash between crypto-regulation optimism and a heavier macro backdrop. The CLARITY Act helped Bitcoin sentiment temporarily, but hotter U.S. inflation data, rising Treasury yields, oil-linked geopolitical risk, and nearly $1B in weekly U.S. spot Bitcoin ETF outflows prevented the recovery from holding.
The strongest driver was macroeconomics, followed by Bitcoin ETF outflows. Geopolitical risk acted as an inflation amplifier through oil prices, while Bitcoin-specific regulation news was supportive but short-lived.

The chart below illustrates the movement of BTCUSD on a 1-hour candlestick timeframe from 11 to 17 May 2026.
 

Attachments

Thursday 21 May 2026

Brent Crude Oil Turned Volatile as U.S.–Iran Peace Hopes Clashed With Hormuz Supply Risk

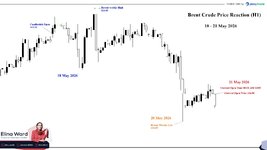
Brent Crude Oil Price Reaction: 18–21 May 2026

Brent Crude Oil moved through a highly volatile trading structure as oil was pulled between Middle East supply-risk pricing, U.S.–Iran peace headlines, and tightening inventory conditions. According to the chart, Brent opened at 112.23 on 18 May, climbed to a current weekly high of 114.43, then reversed sharply toward a current weekly low of 104.59 on 20 May, before opening the current 08:00 GMT candlestick at 106.98 on 21 May.

The first major support for Brent came from renewed supply concerns linked to the Iran war and the Strait of Hormuz disruption. Reuters reported that oil rose around 3% on 18 May as supply-disruption fears outweighed reports that the U.S. could waive sanctions on Iranian crude during talks. The Strait of Hormuz remained the key risk point because it normally handled around 20% of global oil and LNG shipments.
The strongest downside reaction appeared on 20 May 2026, when Brent fell sharply as optimism increased around a possible U.S.–Iran agreement. Reuters reported that Brent settled at 105.02, down $6.26, or 5.63%, after President Trump said negotiations with Iran were in the “final stages.” This reduced the immediate geopolitical risk premium and matched the chart’s sharp decline toward 104.59.

The move lower was also supported by signs that limited tanker traffic was starting to move through the Strait of Hormuz. Reports showed that three supertankers carrying around 6 million barrels of Middle East crude were crossing the strait, which helped ease some short-term supply fears. However, this did not mean the route had fully normalized, and the market remained sensitive to any change in U.S.–Iran headlines.
Macro data did not explain the selloff by itself. In fact, U.S. inventory data was supportive for oil prices. Reuters reported that the United States withdrew a record 17.8 million barrels of crude from total inventories, including 7.86 million barrels from commercial stocks and 9.9 million barrels from the Strategic Petroleum Reserve. This showed that physical supply conditions remained tight even while Brent sold off on peace-deal optimism.

By 21 May 2026, Brent had rebounded from the weekly low and opened the current 08:00 GMT candlestick at 106.98. Reuters reported that oil recovered by more than 1% as traders reassessed uncertainty around the U.S.–Iran peace deal, while inventory drawdowns and unresolved Hormuz risks kept supply concerns active.

It is important to note that Brent’s movement was not driven by one single event. The chart reflected a two-sided market reaction: geopolitical risk and Middle East supply disruption supported oil early in the period, while U.S.–Iran peace optimism and limited tanker movement triggered a sharp risk-premium unwind.

Price Action Summary

MovementFromToPoint MoveTick Move*% MoveVisual Move
Open to Current Reference Move112.23106.98-5.25-525 ticks-4.68%🔴 -5.25 ↘ / -4.68% ↘
Weekly High to Current Weekly Low114.43104.59-9.84-984 ticks-8.60%🔴 -9.84 ↘ / -8.60% ↘

Final Takeaway

Brent Crude Oil opened the period at 112.23, rallied to a current weekly high of 114.43, then reversed sharply to a current weekly low of 104.59 before stabilizing near the 106.98 reference level on 21 May. From the weekly high to the current weekly low, Brent fell -9.84 points, equal to -8.60%. From the original 18 May open to the current 08:00 GMT candlestick open, Brent was lower by -5.25 points, equal to -4.68%.

Overall, Brent’s movement from 18 May to 21 May 2026 was mainly driven by the clash between Middle East supply-risk pricing and U.S.–Iran peace-deal optimism. Oil initially remained supported by Hormuz disruption and tight inventories, but the rally failed to hold as peace headlines and limited tanker movement reduced the immediate geopolitical risk premium.


The chart below illustrates Brent Crude Oil price action on a 1-hour timeframe during the trading period from 18 May to the current 08:00 GMT session on 21 May 2026.
 

Attachments

Friday 22 May 2026

📊 High-Impact Economic Calendar – 26–29 May 2026

🌍 Week Overview

This week focused heavily on inflation data, central bank policy, consumer activity, and growth indicators, with major attention placed on the RBNZ Interest Rate Decision, U.S. Core PCE inflation data, and U.S. GDP releases. Markets also monitored inflation updates from Australia, France, and Germany alongside important Canadian and Japanese economic indicators.

Times in GMT

All events are 🔴 HIGH IMPACT for traders


📅 Tuesday, 26 May 2026

TimeCountryEventForecastPreviousImpact
14:00🇺🇸 USCB Consumer Confidence (MAY)92.092.8🔴 High
14:30🇺🇸 USDallas Fed Manufacturing Index (MAY)-1.0-2.3🔴 High

📅 Wednesday, 27 May 2026

TimeCountryEventForecastPreviousImpact
01:30🇦🇺 AUInflation Rate YoY (APR)5.1%4.6%🔴 High
02:00🇳🇿 NZRBNZ Interest Rate Decision2.25%2.25%🔴 High
14:00🇺🇸 USRichmond Fed Manufacturing Index (MAY)43🔴 High

📅 Thursday, 28 May 2026

TimeCountryEventForecastPreviousImpact
01:30🇦🇺 AUHousehold Spending YoY (APR)6.8%6.3%🔴 High
06:45🇫🇷 FRPPI YoY (APR)5.6%0.2%🔴 High
06:45🇫🇷 FRPPI MoM (APR)1.1%2.0%🔴 High
12:30🇺🇸 USCore PCE Price Index YoY (APR)3.3%3.2%🔴 High
12:30🇺🇸 USPersonal Spending MoM (APR)0.6%0.9%🔴 High
12:30🇺🇸 USPersonal Income MoM (APR)0.5%0.6%🔴 High
12:30🇺🇸 USDurable Goods Orders MoM (APR)0.4%0.8%🔴 High
12:30🇺🇸 USCore PCE Price Index MoM (APR)0.3%0.3%🔴 High
12:30🇺🇸 USPCE Price Index YoY (APR)3.8%3.5%🔴 High
12:30🇺🇸 USGDP Growth Rate QoQ 2nd Est (Q1)2.0%0.5%🔴 High
12:30🇺🇸 USInitial Jobless Claims (May/23)215K209K🔴 High
14:00🇺🇸 USNew Home Sales MoM (APR)-3.2%7.4%🔴 High
14:00🇺🇸 USNew Home Sales (APR)660K682K🔴 High
23:30🇯🇵 JPUnemployment Rate (APR)2.7%2.7%🔴 High
23:50🇯🇵 JPIndustrial Production MoM Prel (APR)0.7%-0.4%🔴 High

📅 Friday, 29 May 2026

TimeCountryEventForecastPreviousImpact
05:00🇯🇵 JPConsumer Confidence (MAY)31.532.2🔴 High
06:45🇫🇷 FRInflation Rate YoY Prel (MAY)2.6%2.2%🔴 High
06:45🇫🇷 FRInflation Rate MoM Prel (MAY)0.3%1.0%🔴 High
07:55🇩🇪 DEUnemployment Rate (MAY)6.4%6.4%🔴 High
12:00🇩🇪 DEInflation Rate MoM Prel (MAY)0.3%0.6%🔴 High
12:00🇩🇪 DEInflation Rate YoY Prel (MAY)3.1%2.9%🔴 High
12:30🇨🇦 CAGDP Growth Rate QoQ (Q1)0.1%-0.2%🔴 High
12:30🇨🇦 CAGDP MoM (MAR)0.0%0.2%🔴 High
12:30🇨🇦 CAGDP Growth Rate Annualized (Q1)0.7%-0.6%🔴 High
13:45🇺🇸 USChicago PMI (MAY)49.549.2🔴 High
22:45🇳🇿 NZBuilding Permits MoM (APR)0.9%-1.3%🔴 High
23:50🇯🇵 JPRetail Sales MoM (APR)-0.5%1.3%🔴 High

📌 Week Summary

This week’s focus centered on inflation and growth-related releases, with Thursday’s U.S. Core PCE inflation data and GDP update expected to generate the strongest volatility as markets reassessed Federal Reserve expectations and broader economic momentum. Attention also remained on the RBNZ Interest Rate Decision and inflation updates from Australia, France, and Germany, creating multiple periods of elevated volatility across global sessions. Planning ahead for these high-impact announcements can help prepare for major market-moving moments across currencies, commodities, stocks, and indices throughout the week.

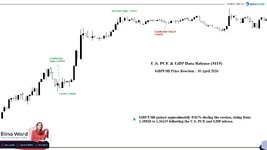
Below is an overview of the U.S. PCE and GDP releases on April 30, 2026, along with a chart showing their impact on GBP/USD, with price action reflecting the market reaction on a 15-minute candlestick timeframe.

U.S. PCE & GDP Release - 30 April 2026

U.S. consumer spending remained solid in March, with personal spending rising 0.9% and income increasing a stronger-than-expected 0.6%, helping households absorb higher inflation pressures. PCE prices rose 0.7%, while core PCE increased 0.3%, keeping annual inflation elevated at 3.5% and core inflation at 3.2%. However, Q1 GDP came in slightly below expectations at 2.0%, weighed down by a sharp drag from net exports, even as business investment and consumer activity remained resilient. Labour data also showed strength, with jobless claims falling to their lowest level since 1969, while wage cost growth remained contained. Overall, the U.S. economy continued to expand, but falling savings and persistent inflation highlighted growing pressure on household purchasing power.

Potential Profit Study:

An entry on GBP/USD at 1.1.35025 with 1 standard lot required approximately $270.05 in margin at 1:500 leverage, while at 1:2000 leverage, the margin requirement decreased to around $67.53.

The move from 1.35025 to the highest of 1.36119 totalled 109.4 pips, resulting in a potential profit of approximately $1,094 on a standard lot position.
 

Attachments

Monday 25 May 2026

Qualcomm Rebounded Sharply as Stellantis Automotive Momentum Lifted QCOM


Qualcomm Price Reaction: 18–22 May 2026

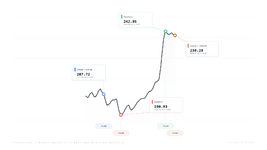
Qualcomm Incorporated (QCOM) moved through a strong bullish recovery as early-week selling pressure was replaced by aggressive buying momentum into the end of the week. According to the chart, Qualcomm opened at 207.72 on 18 May, dropped to a weekly low of 190.93 on 19 May, then rallied sharply to a weekly high of 242.85 on 22 May, before closing the period at 238.28.

The first part of the move showed weakness. After opening near 207.72, QCOM failed to hold its early level and moved lower into 19 May. The stock reached its weekly low at 190.93, showing that sellers were still active before buyers started to regain control.
The strongest upside reaction appeared later in the week, especially into 22 May 2026, when Qualcomm accelerated sharply higher. External daily market data also showed QCOM closing at 238.16, up 11.60% on 22 May, confirming that the final session carried the main bullish force of the weekly move.

The rally was mainly supported by renewed attention on Qualcomm’s automotive chip business. Stellantis and Qualcomm announced an expanded partnership to adopt Snapdragon Digital Chassis solutions across next-generation vehicle architectures, including cockpit, connectivity, and advanced driver-assistance systems.

This helped strengthen the market’s view that Qualcomm’s growth story was not only tied to smartphones. Qualcomm had already reported fiscal second-quarter revenue of $10.6 billion, while QCT automotive revenue reached $1.326 billion, up 38% year-over-year, showing that the automotive segment had become a key part of the company’s diversification story.

By 22 May 2026, QCOM had reached a weekly high of 242.85 before closing at 238.28. The small pullback from the high showed some profit-taking near the top of the move, but the stock still held most of its weekly advance.

It is important to note that Qualcomm’s movement was not driven by price action alone. The chart reflected a clear shift in sentiment: early weakness pushed the stock to 190.93, but automotive-chip momentum and the Stellantis partnership helped buyers regain control and drive the stock sharply higher into the weekly close.

Price Action Summary

MovementFromToPoint Move% MoveVisual Move
Open to Weekly Close207.72238.28+30.56+14.71%🟢 +30.56 ↗ / +14.71% ↗
Weekly Low to Weekly High190.93242.85+51.92+27.19%🟢 +51.92 ↗ / +27.19% ↗

Final Takeaway

Qualcomm opened the period at 207.72, fell to a weekly low of 190.93 on 19 May, then rallied strongly to a weekly high of 242.85 on 22 May before closing at 238.28. From the weekly low to the weekly high, QCOM gained +51.92 points, equal to +27.19%. From the original 18 May open to the 22 May close, Qualcomm was higher by +30.56 points, equal to +14.71%.

Overall, Qualcomm’s movement from 18 May to 22 May 2026 was mainly driven by the shift from early-week selling pressure into strong late-week buying momentum. The expanded Stellantis partnership gave investors a clear automotive-growth catalyst, while Qualcomm’s recent automotive revenue strength helped support the broader bullish reaction.


Profit Study:

Imagine catching the weekly low at 190.93 — with just $954.65 in margin, you'd have had a front-row seat to a $5,192 range explosion between 190.93 and 242.85. The beauty? You didn't even need to nail the perfect exit. Closing anywhere inside that range still put money in your pocket.

The chart below illustrates Qualcomm’s movement on a 1-hour candlestick timeframe from 18 May to 22 May 2026.
 

Attachments

Tuesday 26 May 2026

BTC/USD Weekly Analysis — 18 May 2026 to 24 May 2026
Timeframe: H1 | Net Move: -0.39% | Range: -5.27% | Sentiment Verdict: Cautiously Bearish


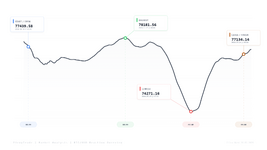
BTC/USD experienced a slight decline of -0.39% between May 18 and May 24, 2026, opening at 77439.58 and closing at 77134.14. The week's high was 78181.56, while the low dipped to 74271.16. Macroeconomic factors, particularly rising US Treasury yields and a strengthening dollar driven by hawkish signals from the Federal Reserve's May meeting minutes, played a significant role in the downward pressure. Bitcoin ETFs also saw substantial outflows, contrasting with earlier inflows. Despite the overall bearish sentiment, some on-chain data pointed to strategic accumulation by large holders, raising questions about the longer-term outlook.


PRICE ACTION SUMMARY

MetricValue
Period Open77,439.58
Period High78,181.56
Period Low74,271.16
Period Close77,134.14
Net Move (Open → Close)-0.39%
Range Move (High → Low)-5.27%

🔴 RESISTANCE said:
78000.00
🟢 SUPPORT said:
74300.00


FUNDAMENTAL DRIVERS

MACROECONOMIC

Rising US Treasury yields and a stronger dollar exerted downward pressure on Bitcoin. The Federal Reserve's May meeting minutes suggested a potential shift towards a less accommodative stance, with some participants preferring to remove the "easing bias," increasing the odds of future rate hikes. This macroeconomic environment dampened risk appetite and increased borrowing costs, impacting both institutional and retail investors.

ETF & INSTITUTIONAL FLOWS
Bitcoin ETFs experienced significant outflows, with $1.55 billion exiting the funds since May 14, 2026. This reversal followed strong inflows in April, indicating a shift in institutional sentiment. BlackRock's IBIT and Fidelity's FBTC led the outflows. However, Morgan Stanley's new Bitcoin ETF attracted $264 million in net inflows, showing some continued institutional interest.

ON-CHAIN SIGNALS
On-chain data revealed a divergence between whale and retail activity. Bitcoin's apparent demand fell to its most bearish level of 2026, with new issuance outpacing structural absorption. However, entities holding 1,000+ BTC increased their positions, suggesting strategic accumulation by larger players. The Bitcoin Fund Flow Ratio on Binance also indicated potentially weakening selling pressure.

MARKET STRUCTURE
The CLARITY Act continued to progress through the Senate, aiming to establish a comprehensive regulatory framework for digital assets in the U.S. The Senate Banking Committee advanced the bill, marking a step towards clearer jurisdictional boundaries between the SEC and CFTC. The act includes provisions related to stablecoin regulation, DeFi, and consumer protection, potentially reshaping how crypto businesses operate.


INTERMARKET CORRELATIONS

AssetMoveContext
S&P 500 (SPX)+0.9%Approximate weekly change from 18 May open to 22 May close; risk sentiment improved by the end of the week.
Gold (XAU)-0.55Approximate weekly change from 18 May open to 22 May close; price ended slightly lower despite safe-haven demand.
DXY (USD Index)+0.04%Approximate weekly change from 18 May open to 22 May close; the dollar ended almost flat.


WHAT TO WATCH NEXT

Late May 2026
— Further developments on the CLARITY Act in the Senate

Potential for regulatory clarity to positively impact market sentiment

June 2026 — Next Federal Reserve meeting
Guidance on interest rate policy will influence risk asset valuations


SENTIMENT VERDICT said:
CAUTIOUSLY BEARISH

The combination of macroeconomic headwinds and ETF outflows creates a cautious bearish outlook for BTC/USD. While on-chain data offers some counterpoints, the broader market sentiment appears to be tilted towards risk aversion in the short term.


Profit Study:​

Imagine catching BTCUSD near the weekly high at 78,181.56. With only around $781.82 in margin, that position would have given exposure to a powerful $3,910.40 price range as the market moved from 78,181.56 down to 74,271.16.


The key point? You would not have needed to exit at the exact low. Even closing anywhere below the entry level within that range could have captured part of the move.
 

Attachments

XAUUSD Weekly Analysis — 25 May 2026 to 27 May 2026
Timeframe: H1 | Net Move: | Range: -3.09% | Bias & Key Risk: Cautiously Bearish


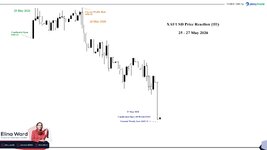
XAUUSD experienced a notable downturn between May 25 and May 27, 2026, declining approximately 3.00% from a high of $4,580.10 to a low of $4,442.74. Initially, the price rose due to uncertainty surrounding U.S.-Iran tensions and shifting inflation expectations. However, this initial support was short-lived as traders reduced their safe-haven exposure, focusing instead on the potential interest-rate implications of geopolitical events. The market appeared to be caught between optimism regarding a potential U.S.-Iran agreement and concerns about energy-driven inflation. As traders increasingly viewed gold as a Fed-sensitive and inflation-sensitive asset, a brief rally quickly turned into a sharp decline, raising questions about gold's role in a high-rate environment.


PRICE ACTION SUMMARY

MetricValue
Period Open4,543.10
Period High4,580.10
Period Low4,442.74
Range Move (High → Low)-3.09%

🔴 RESISTANCE said:
4477.00
🟢 SUPPORT said:
4430.00


FUNDAMENTAL DRIVERS

DXY & REAL YIELDS

On May 25, 2026, short-dated U.S. Treasury yields edged higher after the University of Michigan survey showed weak consumer sentiment and a rise in inflation expectations. Federal Reserve Governor Waller argued that the Fed should remove its 'easing bias' from the policy statement, reinforcing expectations of a less accommodative stance. Rising interest rates affect borrowing costs for corporations, mortgage rates for homeowners, and the discount rates used to value future earnings across equity markets. With consumer price inflation at 3.8% annually, the 30-year Treasury yield rose above 5% for the first time in years.

CENTRAL BANK ACTIVITY
Gold is supported by solid central bank purchases, with the People's Bank of China (PBoC) in its 17th consecutive month of buying. Central bank purchases have been one of the key drivers for the precious metal as the geopolitical premium has faded.

GEOPOLITICAL & SAFE HAVEN
Reports indicated that the United States conducted military operations in southern Iran targeting missile launch sites and boats in the Strait of Hormuz on May 25, 2026. These strikes occurred during ongoing ceasefire conditions and negotiations between the United States and Iran, contributing to heightened regional tensions. However, optimism regarding a potential U.S.-Iran agreement also surfaced during the period, putting downward pressure on gold prices.

COT POSITIONING
No significant activity identified for this driver during the period.


WHAT TO WATCH NEXT

June 2026
— Federal Reserve Meeting

Potential changes to monetary policy could significantly impact gold prices.

Ongoing — U.S.-Iran Negotiations
Progress or setbacks in negotiations will influence safe-haven demand for gold.


**Profit Study:**

Imagine catching XAUUSD near the weekly high at 4580.10 before the drop.

With just $916.02 margin on 1:500 leverage or $229.00 on 1:2000 leverage, a standard lot position would have given traders exposure to a powerful $13,736 market range as gold moved from 4580.10 to 4442.74.

That is the power of volatility. You did not need to catch the full move perfectly — even a partial position inside that range could have created serious opportunity for traders who were prepared.

The chart below illustrates XAUUSD’s price movement on a 1-hour candlestick timeframe from 25 May to 27 May 2026.


BIAS & KEY RISK said:
CAUTIOUSLY BEARISH

Given the rise in real yields and the potential for further interest rate hikes by the Federal Reserve, the outlook for gold is cautiously bearish. Any de-escalation in geopolitical tensions would further reduce safe-haven demand, adding to the downward pressure.

CRITICAL RISK: An unexpected escalation of geopolitical tensions in the Middle East could trigger a flight to safety, boosting gold prices.


For informational purposes only. Not financial advice.
 

Attachments

Thursday 28 May 2026

Brent Crude Oil Turned Volatile as Hormuz Deal Hopes Clashed With Fresh U.S.–Iran Strikes


Brent Crude Oil Price Reaction: 25–28 May 2026

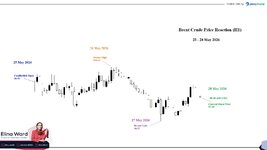
Brent Crude Oil moved through a sharp volatile structure between 25 May and 28 May 2026, as early geopolitical-risk pricing was replaced by heavy selling pressure before buyers returned again. According to the chart, Brent opened at 98.93 on 25 May, climbed to a recent high of 100.62 on 26 May, then dropped sharply to a recent low of 94.57 on 27 May, before recovering to 97.15 by 08:00 GMT on 28 May.
The first part of the move showed early upside momentum. After opening near 98.93, Brent pushed higher into 26 May and reached 100.62, showing that buyers were still active as the market continued to price uncertainty around Middle East supply risks and restricted flows through the Strait of Hormuz.

The strongest downside reaction appeared later, especially into 27 May 2026, when Brent fell sharply from the recent high and reached 94.57. The move came as traders reacted to growing hopes that the United States and Iran were moving closer to a framework that could eventually reopen commercial shipping through the Strait of Hormuz. Reuters reported that oil prices had already fallen nearly 7% on 25 May as optimism grew around a possible U.S.–Iran deal, although analysts warned that normal oil flows would not return immediately.

The selling pressure was also supported by reports that Iran’s state TV had obtained a draft framework for a possible memorandum of understanding with the United States. Under that draft, Iran would restore commercial shipping through the Strait of Hormuz to pre-war levels within one month, while the United States would withdraw military forces from Iran’s vicinity and lift a naval blockade. This reduced part of the geopolitical risk premium that had previously supported oil prices.

However, Brent did not continue lower in a straight line. By 28 May, the market rebounded from 94.57 to 97.15 after fresh military exchanges between the United States and Iran weakened confidence in a clean diplomatic breakthrough. Reuters reported that oil prices jumped after Iran’s Revolutionary Guards said they had targeted a U.S. airbase in response to a U.S. attack near Bandar Abbas. The Wall Street Journal also reported that Brent rose in early European trading after fresh U.S. strikes on Iran renewed supply-risk concerns.

This meant Brent’s movement was not driven by price action alone. The chart reflected a clear shift in sentiment: peace-deal hopes pushed prices lower by removing part of the war-risk premium, while renewed strikes brought back fears that the conflict could continue and keep the Strait of Hormuz disrupted.

By 28 May 2026, Brent had recovered to 97.15, but it was still below its 25 May opening price of 98.93. The late rebound showed that buyers returned after the 27 May sell-off, but the broader move across the period remained negative because Brent failed to reclaim its earlier high near 100.62.

Price Action Summary

MovementFromToPoint Move% MoveVisual Move
Open to Current Price98.9397.15-1.78-1.80%🔴 -1.78 ↘ / -1.80% ↘
Recent High to Recent Low100.6294.57-6.05-6.01%🔴 -6.05 ↘ / -6.01% ↘
Recent Low to Current Price94.5797.15+2.58+2.73%🟢 +2.58 ↗ / +2.73% ↗

Final Takeaway

Brent Crude opened the period at 98.93 on 25 May, reached a recent high of 100.62 on 26 May, then dropped sharply to a recent low of 94.57 on 27 May before recovering to 97.15 by 08:00 GMT on 28 May. From the recent high to the recent low, Brent fell -6.05 points, equal to -6.01%. From the original 25 May open to the 28 May current price, Brent was lower by -1.78 points, equal to -1.80%.

Overall, Brent’s movement from 25 May to 28 May 2026 was mainly driven by the shift between diplomacy and conflict risk. Hopes for a U.S.–Iran framework and a possible reopening of the Strait of Hormuz pushed prices sharply lower, while fresh U.S.–Iran strikes later revived supply-risk concerns and helped Brent recover from the low.

Profit Study:

Imagine catching Brent Crude Oil near the recent high at 100.62 before the drop.

With just $503.10 margin on 1:200 leverage, a standard lot position would have given traders exposure to a powerful $3,470 market range as Brent moved from 100.62 to 97.15.

That is the power of volatility. You did not need to catch the full move perfectly — even a partial position inside that range could have created serious opportunity for traders who were prepared.


Peace in the region = Oil Sell. New tensions = Oil Rise. Which side are you on?


The chart below illustrates Brent Crude Oil’s price movement on a 1-hour candlestick timeframe from 25 May to 28 May 2026.


Attachments

Friday 29 May 2026

📊 High-Impact Economic Calendar – 31 May – 5 June 2026

🌍 Week Overview

This week focused on manufacturing activity, inflation data, GDP releases, labor market indicators, and services PMI reports, with major attention on Eurozone inflation, Australian GDP, U.S. ADP employment, ISM Services PMI, and Friday’s U.S. Non-Farm Payrolls release.

Times in GMT

All events are 🔴 HIGH IMPACT for traders


📅 Sunday, 31 May 2026

TimeCountryEventForecastPreviousImpact
01:30🇨🇳 CNNBS Manufacturing PMI (MAY)50.550.3🔴 High

📅 Monday, 1 Jun 2026

TimeCountryEventForecastPreviousImpact
01:45🇨🇳 CNRatingDog Manufacturing PMI (MAY)51.952.2🔴 High
06:00🇩🇪 DERetail Sales MoM (APR)1.1%-2.0%🔴 High
06:30🇨🇭 CHRetail Sales MoM (APR)-0.2%0.1%🔴 High
07:00🇨🇭 CHGDP Growth Rate YoY (Q1)1.0%0.7%🔴 High
09:00🇪🇺 EAUnemployment Rate (APR)6.3%6.2%🔴 High
14:00🇺🇸 USISM Manufacturing PMI (MAY)53.052.7🔴 High

📅 Tuesday, 2 Jun 2026

TimeCountryEventForecastPreviousImpact
01:30🇦🇺 AUBuilding Permits MoM Prel (APR)-2.3%-10.5%🔴 High
06:00🇨🇭 CHBalance of Trade (APR)CHF2.3BCHF2.7B🔴 High
09:00🇪🇺 EACore Inflation Rate YoY Flash (MAY)2.3%2.2%🔴 High
09:00🇪🇺 EACPI Flash (MAY)103.2103.04🔴 High
09:00🇪🇺 EAInflation Rate MoM Flash (MAY)0.2%1.0%🔴 High
09:00🇪🇺 EAInflation Rate YoY Flash (MAY)3.4%3.0%🔴 High
14:00🇺🇸 USJOLTS Job Openings (APR)6.8M6.866M🔴 High
22:45🇳🇿 NZBuilding Permits MoM (APR)0.9%-1.3%🔴 High

📅 Wednesday, 3 Jun 2026

TimeCountryEventForecastPreviousImpact
01:30🇦🇺 AUGDP Growth Rate QoQ (Q1)0.5%0.8%🔴 High
01:30🇦🇺 AUGDP Growth Rate YoY (Q1)2.5%2.6%🔴 High
09:00🇪🇺 EAPPI YoY (APR)6.3%2.1%🔴 High
09:00🇪🇺 EAPPI MoM (APR)1.9%3.4%🔴 High
12:15🇺🇸 USADP Employment Change (MAY)75K109K🔴 High
14:00🇺🇸 USFactory Orders MoM (APR)2.7%1.5%🔴 High
14:00🇺🇸 USISM Services PMI (MAY)53.053.6🔴 High

📅 Thursday, 4 Jun 2026

TimeCountryEventForecastPreviousImpact
01:30🇦🇺 AUBalance of Trade (APR)-A$3B-A$1.841B🔴 High
06:30🇨🇭 CHInflation Rate YoY (MAY)0.8%0.6%🔴 High
07:00🇨🇭 CHUnemployment Rate (MAY)2.9%3.0%🔴 High
09:00🇪🇺 EARetail Sales MoM (APR)-0.6%-0.1%🔴 High
12:30🇺🇸 USInitial Jobless Claims (May/30)215K🔴 High
23:30🇯🇵 JPHousehold Spending YoY (APR)-2.6%-2.9%🔴 High

📅 Friday, 5 Jun 2026

TimeCountryEventForecastPreviousImpact
06:45🇫🇷 FRBalance of Trade (APR)-€7.3B-€6.9B🔴 High
06:45🇫🇷 FRIndustrial Production MoM (APR)0.2%1.0%🔴 High
12:30🇺🇸 USNon-Farm Payrolls (MAY)102K115K🔴 High
12:30🇺🇸 USUnemployment Rate (MAY)4.4%4.3%🔴 High
12:30🇨🇦 CAUnemployment Rate (MAY)6.9%6.9%🔴 High
12:30🇨🇦 CAEmployment Change (MAY)8K-17.7K🔴 High
12:30🇨🇦 CAFull-Time Employment Change (MAY)35K-46.7K🔴 High
14:00🇨🇦 CAIvey PMI s.a (MAY)51.057.7🔴 High

📌 Week Summary

This week’s focus centered on Eurozone inflation, Australian GDP, U.S. employment data, and North American labor market releases, with Friday’s U.S. Non-Farm Payrolls and Unemployment Rate expected to be the most significant volatility catalyst. Eurozone CPI, U.S. ADP employment, and ISM Services PMI also created important market-moving windows during the week. Planning ahead for these high-impact releases can help prepare for potential volatility across currencies, commodities, stocks, and indices before the week unfolds.

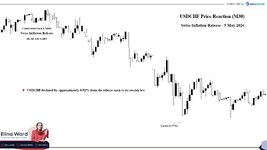
Below is an overview of the Swiss Consumer Price Index release on May 5, 2026, along with a chart showing its impact on USDCHF, with price action reflecting the market reaction using a 30-minute candlestick timeframe.

Swiss Inflation Rose in April as CHF Strengthened Against the Dollar

Swiss consumer prices rose in April 2026 as higher energy and travel-related costs lifted headline inflation, while USDCHF moved lower after the release, showing a stronger Swiss franc against the U.S. dollar. According to the Federal Statistical Office, the Consumer Price Index increased by 0.3% from the previous month to 101.1 points, while annual inflation stood at 0.6%. The rise was mainly driven by higher prices for petrol, diesel, heating oil, air transport, and international package holidays, although core inflation remained unchanged and domestic prices slipped by 0.1%, showing that broader inflation pressure was still moderate. Even with these mixed details, the stronger headline reading appeared to support CHF by reducing expectations that the Swiss National Bank would need to cut rates below 0%, rather than by creating a clear case for rate increases.


On the 30-minute USDCHF chart, the pair fell from the 0.78430 candlestick open to a low of 0.77712, a decline of 71.8 pips or about 0.92%. The move suggested that traders reacted positively to the headline inflation increase, while broader safe-haven demand and geopolitical uncertainty may also have reinforced Swiss franc strength.


Potential Profit Study:

Imagine catching USDCHF near the release open at 0.78430 before the sharp move lower.

With just around $200 margin on 1:500 leverage — or approximately $50 margin on 1:2000 leverage — a standard lot sell position would have given traders exposure to a powerful 71.8-pip market range as USDCHF moved from 0.78430 to 0.77712.

That move represented a potential profit of approximately $915.47 on a standard lot position, assuming the full move was captured. That was the power of volatility. You did not need to catch the full move perfectly — even a partial position inside that 71.8-pip range could have created a serious opportunity for traders who were prepared.

Headline inflation rose, and CHF strengthened against the dollar. Stronger headline CPI = USDCHF drop.

Next Swiss CPI release: 4 June
2026 at 06:30 AM GMT.

Will the next inflation print give CHF another strong reaction?


Attachments

Tuesday 2 June 2026


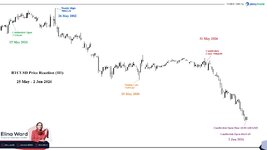
BTC/USD Weekly Analysis — 25 May 2026 to 31 May 2026
Timeframe: H1 | Net Move: -4.24% | Range: -7.68% | Sentiment Verdict: Cautiously Bearish


During the weekly session ending May 31, 2026, Bitcoin (BTC/USD) underwent a sharp bearish correction, declining by -4.24% to close at $73,866.05 after briefly establishing a weekly high of $78,062.26. The descent was precipitated by a combination of stubborn macroeconomic inflation data and a massive $1.29 billion wave of spot ETF redemptions, forcing the asset to breach crucial support zones before finding a local bottom at $72,493.64. Interestingly, this corrective price action diverged from a highly resilient traditional equity market, which saw the S&P 500 continue its record-breaking rally to secure a ninth consecutive winning week. As BTC experiences a modest weekend relief bounce, the market is left questioning whether localized on-chain exchange inflows will continue to supply heavy overhead resistance or if the structural long-term holder supply holding at historic highs will ultimately spark a robust recovery ahead of the upcoming June FOMC meeting.


PRICE ACTION SUMMARY

MetricValue
Period Open77,134.44
Period High78,062.26
Period Low72,493.64
Period Close73,866.05
Net Move (Open → Close)-4.24%
Range Move (High → Low)-7.68%

🔴 RESISTANCE said:
74,000.00
🟢 SUPPORT said:
70,000.00


FUNDAMENTAL DRIVERS

MACROECONOMIC

The release of the Personal Consumption Expenditures (PCE) price index for April on May 28, 2026, cemented a hawkish Federal Reserve outlook as Core PCE rose to 3.3% YoY (up from 3.2% in March) and headline PCE climbed to 3.8% YoY (up from 3.5%). Hawkish warnings from Fed officials like Philip Jefferson and Neel Kashkari pushed the probability of a rate hold at the June FOMC meeting to near 99.9%. In geopolitics, speculation of a 60-day ceasefire extension in the US-Iran conflict temporarily softened Brent crude to $91.12 per barrel by May 29, bringing spot gold down to $4,556.84 per ounce. Despite this, the tech-heavy S&P 500 closed at a record high of 7599.96 on June 1, while the US Dollar Index (DXY) ended the weekly session slightly softer at 98.91.

ETF & INSTITUTIONAL FLOWS
U.S. spot Bitcoin ETFs faced intense distribution pressure, suffering $1.29 billion in net redemptions between May 27 and May 31, bringing the total outflows since May 7 past the $4 billion mark according to CoinStats. Conversely, a Bank of America 13F filing showed the banking institution raised its position in BlackRock’s IBIT to approximately $37 million (nearly 70% of its crypto-related holdings). Meanwhile, MicroStrategy executed its first Bitcoin sale in four years, offloading 32 BTC for $2.5 million at an average price of $77,135 per coin between May 26 and May 31 to fund preferred stock dividends, which was publicly disclosed via an SEC filing on Tuesday, June 2.

ON-CHAIN SIGNALS
CryptoQuant reported aggregate Bitcoin exchange reserves falling to an extreme multi-year low of 2.66 million BTC, matching levels last seen in August 2019. However, on-chain analyst Rei Researcher flagged a sharp localized anomaly: a sudden surge in Binance's exchange reserves to 647,800 BTC in late May, signaling active whale deposits and creating immediate sell pressure near the $73,500 zone. Concurrently, long-term holder (LTH) supply surpassed its previous record to reach 15.8 million BTC (representing 73% of circulating supply), though Glassnode noted that roughly 900,000 BTC on Coinbase naturally aged past the 155-day threshold simply by sitting idle, suggesting inactive turnover rather than aggressive new accumulation.

MARKET STRUCTURE
Derivatives market liquidations were highly asymmetrical, with a brief test of the $78,000 level squeezing bearish positioning and triggering $32 million in short liquidations, followed by a subsequent breakdown below support near $74,000 that wiped out over $30 million in leveraged longs over a 24-hour period. Total futures open interest remained balanced, averaging $55 billion with neutral perpetual funding rates at 0.0033% per 8 hours. On the regulatory and institutional product front, Nasdaq secured conditional approval from the SEC on May 22 (announced May 25) to list cash-settled European-style Bitcoin index options under the ticker QBTC, while the U.S. Senate Banking Committee voted 15-9 to advance the Digital Asset Market Clarity Act (CLARITY Act) on May 14.


WHAT TO WATCH NEXT

Tuesday, June 2, 2026
— MicroStrategy SEC Form 4 Disclosure Impact

Markets will digest the psychological impact of MSTR's first BTC sale in four years.

Mid-June 2026 — June FOMC Rate Decision
Federal Reserve's official rate decision, with macro models pricing in a near 99.9% probability of a rate hold.


SENTIMENT VERDICT said:
CAUTIOUSLY BEARISH

In the near term, the confluence of heavy spot ETF redemptions and localized exchange inflows onto Binance will likely keep overhead resistance formidable. Although the long-term structural outlook remains highly constructive due to record-low aggregate exchange reserves, the immediate lack of buy-side momentum suggests a period of consolidation or further downside testing before a sustained reversal can take shape.

CRITICAL RISK: A sudden escalation of the US-Iran conflict reversing the temporary ceasefire optimism and triggering a broad risk-off asset liquidation.
 

Attachments

Live Forex Chart

Currency
Rates
EUR / USD
1.15351
USD / JPY
155.224
GBP / USD
1.34576
USD / CHF
0.81876
USD / CAD
1.39363
EUR / JPY
178.838
AUD / USD
0.71313
Back
Top
Log in Register