Elina-Ward
Fun Poster
- Messages
- 136
- Joined
- Dec 2, 2025
- Messages
- 136
- Reaction score
- 5
- Points
- 25
Monday 18 May 2026
Apple Climbed as Strong Earnings, Buybacks, and China Optimism Outweighed Inflation Pressure
Apple Price Reaction: 11–15 May 2026
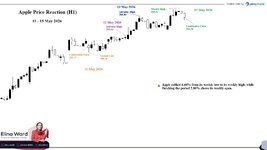
Apple moved through a strong upward trading structure between 11 May and 15 May 2026, as the stock was supported by company-specific momentum while the broader market faced inflation and geopolitical pressure. According to the chart, Apple opened at 292.17 on 11 May, dropped to a period low of 290.16, then rallied sharply as buyers returned to the stock.
The first upside reaction appeared on 12 May 2026, when Apple reached an intraday high of 295.16. This move came despite a difficult macro backdrop, as U.S. CPI rose 0.6% month over month and 3.8% year over year in April, while Treasury yields climbed and U.S. stock indexes weakened after the inflation release.
The strongest continuation appeared on 13 May 2026, when Apple pushed to an intraday high of 300.84. This move aligned with company-specific support from Apple’s latest fiscal Q2 results. Apple reported revenue of $111.2 billion, up 17% year over year, while diluted EPS rose 22% to $2.01. The company also reported March-quarter records for total revenue, iPhone revenue, and EPS, while Services revenue reached a new all-time high.
Investor sentiment was also supported by Apple’s capital-return announcement. Apple declared a $0.27 per-share dividend, payable on 14 May 2026, to shareholders of record as of 11 May 2026. More importantly, the board authorized an additional $100 billion share repurchase program, which helped reinforce confidence in the stock during a macro-heavy week.
Another supportive factor came from the China narrative. Reuters reported that Apple CEO Tim Cook joined President Donald Trump’s China visit alongside other major U.S. executives. For Apple, this mattered because China remained central to both its manufacturing chain and consumer market exposure.
However, the China visit was not a clean bullish catalyst. Reuters later reported that America’s most powerful CEOs had little to show from the trip, with limited clarity around confirmed commercial outcomes. This meant Apple’s China-related support was more about sentiment, market-access optimism, and investor positioning than a confirmed Apple-specific breakthrough.
Macro pressure worked against the stock during the same period. On 13 May, U.S. PPI rose 1.4% month over month and 6.0% year over year, its largest monthly gain since March 2022 and biggest annual rise since December 2022. Reuters linked the inflation pressure partly to the Iran war and disruption around the Strait of Hormuz, which kept bond yields and rate concerns in focus.
By 15 May 2026, Apple reached the chart’s highest point at 303.11 before pulling back slightly and closing at 300.34. The chart therefore showed a strong rally from 290.16 to 303.11, followed by a modest reversal into the final close.
It is important to note that Apple’s movement was not driven by one single event. The chart reflected a two-sided market reaction: strong earnings, iPhone and Services momentum, the $100 billion buyback, and China-related optimism supported the price, while hot CPI, hot PPI, higher yields, Iran-related energy inflation, and limited clarity from the Trump-Xi summit prevented the rally from extending further.
Apple’s broader investment story also remained part of the background. Earlier in 2026, Apple said it was expanding U.S. manufacturing, including Mac mini production in Houston, advanced AI server production, and plans to purchase well over 100 million advanced chips from TSMC’s Arizona facility. This was not a fresh 11–15 May catalyst, but it reinforced Apple’s supply-chain and investment narrative.
On the chart, this conflict produced a rally from 290.16 to 303.11, followed by a partial pullback toward the 300.34 closing reference level by 15 May.
Price Action Summary
| Movement | From | To | Price Move | Tick Move* | % Move | Visual Move |
|---|---|---|---|---|---|---|
| Open to Weekly Close | 292.17 | 300.34 | +8.17 | +817 ticks | +2.80% |  +8.17 ↗ / +2.80% ↗ +8.17 ↗ / +2.80% ↗ |
| Period Low to Period High | 290.16 | 303.11 | +12.95 | +1,295 ticks | +4.46% | +12.95 ↗ / +4.46% ↗ |
Final Takeaway
Apple opened the period at 292.17, dropped to an early low of 290.16, then rallied strongly to a period high of 303.11 before closing at 300.34. From the period low to the period high, Apple gained +12.95 points, equal to +4.46%. From the high to the final 15 May close, Apple fell -2.77 points, equal to -0.91%, showing that most of the weekly rally remained intact.Overall, Apple’s movement from 11 May to 15 May 2026 was mainly driven by the clash between strong company-specific support and heavy macro pressure. Earnings strength, iPhone and Services momentum, the $100 billion buyback, and optimism around Tim Cook’s presence in China helped Apple move higher. At the same time, hot CPI, hot PPI, higher Treasury yields, Iran-related energy inflation, and limited clarity from the Trump-Xi summit prevented the rally from extending further.
The chart below illustrates the movement of Apple Inc. on a 1-hour candlestick timeframe from 11 to 15 May 2026.
Attachments
-
 105.8 KB Views: 11
 -5,050.17 ↘ / -6.14% ↘
 High-Impact Economic Calendar – 26–29 May 2026
 Week Overview
 Tuesday, 26 May 2026
 US
US AU
AU NZ
NZ FR
FR JP
JP DE
DE CA
CA Week Summary
 CN
CN CH
CH EA
EA