Gold Rallies Over 22,678 Ticks Before Stabilizing as Fed Expectations and Geopolitics Drive Repricing
Gold represents a global safe-haven asset and remains highly sensitive to shifts in geopolitical risk, U.S. dollar dynamics, and real yields. As a non-yielding asset, gold’s price action is primarily driven by changes in interest rate expectations and inflation outlook rather than headlines alone.
Between April 13 and April 15, 2026, gold experienced a strong multi-session rally followed by a controlled pullback, as markets rapidly repriced Federal Reserve expectations amid shifting geopolitical developments surrounding U.S.–Iran tensions.
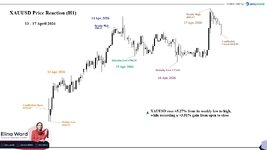
Gold opened on April 13 at 4670.19, briefly declined to a low of 4644.43, and then reversed sharply into a sustained bullish move. The market extended higher across April 14 and into April 15, reaching a peak of 4871.21, before easing back toward 4798.09 by 10:00 GMT on April 15.
This marked a total upside move of approximately +22,678 ticks, equivalent to a +4.88% increase from the low to the high. Following this impulsive expansion, the market retraced by −7,312 ticks, or −1.50%, reflecting a controlled pullback rather than a reversal.
The move began on April 13 following a sharp escalation in geopolitical tensions. U.S.–Iran talks collapsed, and the United States moved toward restricting Iranian oil flows near the Strait of Hormuz. This development triggered a surge in oil prices above $100, immediately raising inflation concerns across global markets.
Despite the rise in geopolitical risk, gold did not rally initially. Instead, the market responded to the inflationary implications of higher oil prices. Rising inflation expectations reduced the likelihood of near-term Federal Reserve rate cuts, leading to higher U.S. Treasury yields and a stronger U.S. dollar. This combination placed downward pressure on gold during the early phase of the move.
This reaction underscored a critical dynamic in gold pricing, where real yields and monetary policy expectations take precedence over geopolitical headlines.
Easing Tensions and Soft Inflation Data Trigger Aggressive Repricing Higher
On April 14, market sentiment shifted decisively as both macroeconomic data and geopolitical messaging began to align in a different direction. U.S. Producer Price Index data came in significantly below expectations, with a 0.5% month-on-month increase compared to the 1.1% forecast. At the same time, comments from Donald Trump indicated that discussions with Iran could resume, reducing immediate fears of escalation.
The combination of softer inflation data and easing geopolitical tone led to a rapid repricing across markets. Inflation expectations declined, which increased the probability of Federal Reserve rate cuts. This shift pushed Treasury yields lower and weakened the U.S. dollar.
Gold responded strongly to these macro changes, rallying aggressively and breaking through prior resistance levels as the market repriced the interest rate outlook. The move extended into April 15, where gold reached a peak of 4871.21.
Importantly, this rally was not driven by traditional safe-haven demand. Instead, it reflected a shift in macro conditions, where falling real yields and a softer dollar created a favorable environment for gold to advance.
Trend Continuation Followed by Controlled Pullback
The bullish momentum carried into April 15, completing a three-day expansion phase that saw gold gain nearly five percent from its lows. However, as the market reached new highs, momentum began to slow and a pullback phase emerged.
Oil prices started to move higher again due to persistent supply concerns in the Strait of Hormuz, keeping inflation risks present in the background. At the same time, the absence of a confirmed geopolitical resolution and the extent of the prior rally led to a stabilization in Treasury yields and a modest recovery in the U.S. dollar.
Under these conditions, gold eased back toward 4798.09. The decline remained orderly and controlled, reflecting a consolidation phase rather than a structural reversal.
A Classic Macro-Driven Repricing Event
The overall move followed a clear institutional pattern. Geopolitical escalation initially introduced inflation risk through higher oil prices, which supported yields and the dollar while limiting gold’s upside. This dynamic reversed when inflation data surprised to the downside and geopolitical tensions appeared to ease, allowing markets to price in a more accommodative Federal Reserve path.
As yields declined and the dollar weakened, gold rallied sharply. Once the initial repricing was complete and uncertainty persisted, the market transitioned into a consolidation phase, reflecting a balance between macro drivers and positioning.
Throughout the period, gold maintained its characteristic inverse relationship with U.S. Treasury yields, confirming that interest rate expectations remained the dominant force behind price action.
Market Structure Breakdown
The price action developed in a structured sequence over the three sessions. The first phase on April 13 involved a liquidity sweep below the opening level, followed by a strong reversal. The second phase on April 14 saw trend continuation, driven by macro repricing and momentum expansion. The third phase on April 15 marked a transition into exhaustion and controlled pullback, completing the cycle of expansion and consolidation.
Market Note (Short-Term Dynamics)
Market conditions remain highly sensitive to changes in Federal Reserve expectations, U.S. dollar direction, and Treasury yield movements, while geopolitical developments continue to act as catalysts that influence these variables. Oil prices remain a key transmission mechanism for inflation expectations, and any further movement in energy markets is likely to have a direct impact on gold through its effect on yields and the dollar.
This environment suggests that gold will remain reactive and prone to volatility, with price action driven by shifts in macro expectations rather than isolated headlines.
Conclusion
Between April 13 and April 15, gold rallied from a low of 4644.43 to a high of 4871.21, marking a +22,678 tick move, equivalent to a +4.88% increase. The market later stabilized near 4798.09, resulting in a net gain of +12,790 ticks, or +2.74%, from the April 13 opening level.
While easing tensions between the United States and Iran contributed to the broader shift in sentiment, the primary driver of the move was the resulting change in inflation expectations, which influenced Federal Reserve rate outlook, Treasury yields, and the U.S. dollar.
The price action confirmed that gold remains fundamentally driven by real yields and currency dynamics, with geopolitical developments acting as catalysts that shape macro expectations rather than directly determining direction.
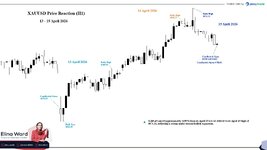
The chart below illustrates the price movement of XAUUSD between April 13 and April 15, 2026, based on a 1-hour candlestick timeframe.
Brent Crude Oil Declines −9.32% from Peak as Ceasefire Expectations Trigger Risk Premium Contraction
Introduction
Brent Crude Oil serves as a global benchmark for crude pricing, reflecting the balance between supply and demand in international energy markets. Prices remained highly sensitive to geopolitical developments, particularly in the Middle East, as well as supply disruptions, inflation expectations, and broader macroeconomic conditions. During this period, price action was primarily driven by shifts in perceived supply risk and evolving expectations around conflict resolution.
Price Action Overview
Between April 13 and April 16, Brent crude oil experienced a sharp repricing move followed by stabilization.
Price opened near $104.77 on April 13 and advanced to a period high of $105.19, before reversing into a sustained decline. The market dropped to a low of $95.39 on April 15, before stabilizing and trading back toward $97.67 by April 16.
This represented a total move of approximately 9,800 ticks, equivalent to a −9.32% decline from high to low. On a net basis, Brent declined approximately 7,100 ticks (−6.78%) from open to the latest observed level, reflecting a partial recovery following the initial sell-off.
Price Action Summary Table
Metric
Value
Weekly Open
104.77
Period High
105.19
Period Low
95.39
Latest Price (Apr 16)
97.67
Total Move (High → Low)
−9,800 ticks
Percentage Move
−9.32%
Net Move (Open → Latest)
−7,100 ticks
Net Percentage
−6.78%
Macro & Geopolitical Drivers
The move was primarily driven by geopolitical developments and shifting expectations around supply disruption:
Geopolitical tensions (Middle East)
Ongoing conflict involving Iran, Israel, and U.S. forces maintained elevated uncertainty around global oil supply, particularly due to restricted flows through the Strait of Hormuz.
Ceasefire expectations and diplomatic developments
Markets increasingly focused on the potential extension of a temporary ceasefire window, which introduced expectations of partial normalization in oil flows.
OPEC supply dynamics
OPEC+ maintained a cautious stance, with limited immediate supply response despite elevated prices, reinforcing the importance of geopolitical developments in driving price.
U.S. policy and rhetoric
Comments from Donald Trump suggesting the conflict was nearing resolution contributed to a shift in sentiment and a reduction in the oil risk premium.
Supply disruptions and outages
Continued disruptions to regional production and shipping flows supported prices initially but were later outweighed by expectations of easing tensions.
Inflation expectations and macro conditions
Oil’s role in inflation remained relevant, though macro factors acted more as a secondary influence relative to immediate geopolitical developments.
Market Reaction Breakdown
Price action developed through a clear sequence:
Initial upside extension
Brent pushed to a high of $105.19 as markets priced in sustained supply disruption and elevated geopolitical risk.
Sharp reversal phase
Following the peak, price declined aggressively as expectations shifted toward potential diplomatic resolution.
Continuation lower
The move extended into April 15, reaching a low of $95.39 as the risk premium contracted.
Stabilization phase
Price began consolidating between $95–98, reflecting a balance between ongoing supply risks and improving sentiment around negotiations.
Conclusion
Between April 13 and April 16, Brent crude declined −9.32% from peak to trough, with a net move of −6.78% from open to the latest level.
The move was driven primarily by geopolitical repricing, as markets transitioned from pricing in supply disruption toward incorporating expectations of potential conflict resolution.
While the initial phase reflected risk premium expansion, the subsequent sell-off represented a contraction in that premium, followed by stabilization as markets awaited further clarity on geopolitical developments.
The chart below shows Brent Crude Oil price action on a 1-hour candlestick chart covering the period from April 13 to April 16, 2026.
This week delivered a dense lineup of high-impact economic releases across major economies, with key focus on inflation data, PMI surveys, labor market indicators, and trade balances. These announcements drove expectations around central bank policy paths and provided fresh insight into global economic momentum.
Times in GMT
All events are HIGH IMPACT for traders
Sunday, 19 Apr 2026
Time
Country
Event
Forecast
Previous
Impact
22:45
NZ
Balance of Trade (MAR)
NZ$270M
NZ$257M
High
Monday, 20 Apr 2026
Time
Country
Event
Forecast
Previous
Impact
06:00
DE
PPI YoY (MAR)
-1.8%
-3.3%
High
06:00
DE
PPI MoM (MAR)
0.8%
-0.5%
High
12:30
CA
Inflation Rate YoY (MAR)
2.5%
1.8%
High
12:30
CA
Core Inflation Rate YoY (MAR)
2.4%
2.3%
High
12:30
CA
Core Inflation Rate MoM (MAR)
0.3%
0.4%
High
22:45
NZ
Inflation Rate YoY (Q1)
2.8%
3.1%
High
23:50
JP
Balance of Trade (MAR)
¥470B
¥57.3B
High
23:50
JP
Imports YoY (MAR)
—
10.2%
High
23:50
JP
Exports YoY (MAR)
—
4.2%
High
Tuesday, 21 Apr 2026
Time
Country
Event
Forecast
Previous
Impact
06:00
GB
Unemployment Rate (FEB)
5.3%
5.2%
High
06:00
GB
Employment Change (FEB)
-35K
84K
High
06:00
CH
Balance of Trade (MAR)
CHF4.5B
CHF4.4B
High
09:00
DE
ZEW Economic Sentiment Index (APR)
-10
-0.5
High
12:30
US
Retail Sales MoM (MAR)
0.4%
0.6%
High
Wednesday, 22 Apr 2026
Time
Country
Event
Forecast
Previous
Impact
06:00
GB
Core Inflation Rate YoY (MAR)
2.8%
3.2%
High
06:00
GB
Core Inflation Rate MoM (MAR)
0.2%
0.6%
High
06:00
GB
Inflation Rate YoY (MAR)
3.4%
3.0%
High
23:00
AU
S&P Global Services PMI Flash (APR)
46.0
46.3
High
23:00
AU
S&P Global Composite PMI Flash (APR)
46.3
46.6
High
23:00
AU
S&P Global Manufacturing PMI Flash (APR)
49.0
49.8
High
Thursday, 23 Apr 2026
Time
Country
Event
Forecast
Previous
Impact
00:30
JP
Manufacturing PMI Flash (APR)
50.1
51.6
High
00:30
JP
Composite PMI Flash (APR)
51.4
53.0
High
00:30
JP
Services PMI Flash (APR)
52.0
53.4
High
07:15
FR
Composite PMI Flash (APR)
48.2
48.8
High
07:15
FR
Services PMI Flash (APR)
48.0
48.8
High
07:15
FR
Manufacturing PMI Flash (APR)
50.5
50.0
High
07:30
DE
Composite PMI Flash (APR)
51.4
51.9
High
07:30
DE
Services PMI Flash (APR)
50.5
50.9
High
07:30
DE
Manufacturing PMI Flash (APR)
52.5
52.2
High
08:00
EA
Composite PMI Flash (APR)
50.2
50.7
High
08:00
EA
Services PMI Flash (APR)
49.7
50.2
High
08:00
EA
Manufacturing PMI Flash (APR)
52.0
51.6
High
08:30
GB
Services PMI Flash (APR)
51.4
50.5
High
08:30
GB
Manufacturing PMI Flash (APR)
51.0
51.0
High
08:30
GB
Composite PMI Flash (APR)
51.6
50.3
High
12:30
US
Initial Jobless Claims
218K
207K
High
12:30
CA
PPI MoM (MAR)
1.3%
0.4%
High
12:30
CA
PPI YoY (MAR)
6.5%
5.4%
High
13:45
US
Composite PMI Flash (APR)
49.9
50.3
High
13:45
US
Manufacturing PMI Flash (APR)
52.0
52.3
High
13:45
US
Services PMI Flash (APR)
49.6
49.8
High
23:30
JP
Inflation Rate YoY (MAR)
1.5%
1.3%
High
23:30
JP
Core Inflation Rate YoY (MAR)
2.0%
1.6%
High
Friday, 24 Apr 2026
Time
Country
Event
Forecast
Previous
Impact
06:00
GB
Retail Sales MoM (MAR)
0.2%
-0.4%
High
08:00
DE
Ifo Business Climate (APR)
85.4
86.4
High
12:30
CA
Retail Sales MoM (Prel, MAR)
0.2%
0.9%
High
Week Summary
High-impact economic releases were closely monitored throughout the week as they played a key role in shaping market sentiment and short-term price action. With major updates on inflation, growth, and business activity, markets reacted quickly to any deviations from expectations.
Periods of heightened volatility were most evident around clustered releases—particularly PMI data and inflation figures—where traders adjusted positions rapidly as new information was priced in across currencies, commodities, and indices.
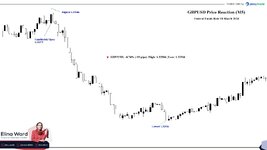
Below is an overview of the U.K. inflation release, along with a chart showing its impact on GBP/USD, with price action reflecting market reaction on 25 March 2026 using a 30-minute candlestick timeframe.
U.K. Inflation Release - 25 March 2026
The Bank of England is expected to hold interest rates steady through 2026 despite inflation remaining around 3%, as current energy prices are unlikely to push inflation high enough to justify further tightening. While markets are pricing in multiple rate hikes, this is seen as overstated due to liquidity distortions, with policymakers requiring a more significant surge—such as oil sustaining around $120 per barrel or gas above €70/MWh—to consider hikes. Inflation is projected to peak between 3.5% and 4% in autumn before easing, with near-term declines expected due to base effects and delayed energy price adjustments. Given a fragile labor market and evidence that firms are absorbing higher costs through job cuts rather than price increases, the central bank’s base case remains a prolonged pause, with potential rate cuts resuming in early 2027.
Potential Profit Study:
An entry on GBP/USD at 1.34272 with 1 standard lot required approximately $268.54 in margin at 1:500 leverage, while at 1:2000 leverage, the margin requirement decreased to around $67.14.
The move from 1.34272 to the session low of 1.33580 totaled 69.2 pips, resulting in a potential profit of approximately $692 on a standard lot position.
General Motors Gains After Midweek Dip as Macro Tailwinds and Strategic Move Support Rally
General Motors, founded in 1908 and headquartered in Detroit, Michigan, is one of the world’s largest automotive manufacturers. The company designs, manufactures, and sells vehicles under brands such as Chevrolet, GMC, Cadillac, and Buick, while also offering financial services and investing in electric vehicles (EVs) and advanced mobility technologies.
Shares advanced during the week of April 13–17, recovering from a midweek pullback as broader market sentiment improved and a late-week strategic development reinforced investor confidence.
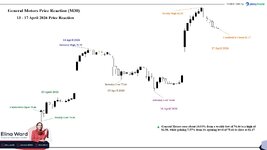
The stock opened at 75.46 and declined early to a weekly low of 74.44 on April 13, before rising to 79.79 by April 14. The initial advance was largely driven by improved risk appetite across global markets, with cyclical and industrial stocks benefiting from easing geopolitical tensions and a softer U.S. dollar.
Gains proved temporary, however, as GM shares retreated over the next two sessions to 76.86 on April 16. The pullback reflected profit-taking and a pause in momentum, with the absence of fresh catalysts leading investors to reassess short-term positioning.
Buying interest returned later in the week, lifting the stock sharply from the midweek low to a weekly high of 82.58. The rally coincided with increased confidence in GM’s strategic positioning after the company committed $600 million to expand its South Korean operations, aimed at maximizing production capacity for U.S.-bound exports despite tariff pressures.
The move signaled GM’s efforts to mitigate supply chain risks and manage geopolitical trade challenges, reinforcing its globally integrated manufacturing strategy. Shares later eased slightly to close at 81.17 on April 17, marking a +5.71 point (+7.57%) weekly gain. From low to high, the stock rose +10.94%.
Price Action Summary
Metric
Value
Weekly Open
75.46
Weekly Low
74.44
Weekly High
82.58
Weekly Close
81.17
Total Move (Low → High)
+8.14 points
Percentage Move (Low → High)
+10.94%
Net Move (Open → Close)
+5.71 points
Percentage Move (Open → Close)
+7.57%
Overall, the week’s price action suggested that the early rally was driven by macro tailwinds, the midweek decline reflected a consolidation phase, and the late advance was supported by both improving sentiment and company-specific developments.
The chart below illustrates the movement of General Motors (GM) stock from April 13 to April 17, 2026, based on 30-minute candlesticks.
Bitcoin Rebounds From Early Low, Peaks Midweek Before Pullback on Renewed Geopolitical Tensions
Bitcoin, introduced in 2009 as the first decentralized digital currency, operates on blockchain technology and is widely viewed as both a speculative asset and a macro-sensitive store of value. Its price action increasingly reflects global liquidity conditions, currency movements, and geopolitical developments.
Bitcoin traded higher overall during the week of April 13–19, rebounding sharply from an early-week low before rallying to a peak and subsequently pulling back as geopolitical tensions resurfaced.
The asset opened at 71,316.82 on April 13 and initially declined to a weekly low of 70,487.14, reflecting lingering caution in global markets at the start of the week. Selling pressure proved short-lived, however, as sentiment quickly improved, allowing Bitcoin to reverse higher.
Price climbed to 76,019.72 on April 14, supported by improving risk appetite as tensions surrounding potential diplomatic developments between the United States and Iran appeared to ease, encouraging flows back into risk-sensitive assets.
Momentum moderated over the next two sessions, with Bitcoin consolidating and posting intraday highs of 75,262.73 on April 15 and 75,506.40 on April 16. This phase reflected a pause in directional conviction, as traders awaited clearer macro signals while maintaining exposure amid a softer U.S. dollar backdrop.
Strong buying interest returned on April 17, driving Bitcoin sharply higher to a weekly peak of 78,311.76. The breakout was supported by continued dollar softness and sustained institutional participation, reinforcing Bitcoin’s sensitivity to global liquidity conditions.
However, the rally proved short-lived. Bitcoin reversed lower into April 18, falling to 75,426.76, as profit-taking emerged following the sharp advance. The pullback coincided with renewed geopolitical tensions after Iran moved to close the Strait of Hormuz again, escalating friction with the United States and prompting a shift toward defensive positioning.
This development supported short-term demand for the U.S. dollar, creating an additional headwind for Bitcoin and accelerating the correction from overextended levels.
Bitcoin later stabilized and closed the week at 74,648.74 on April 19, indicating that while upward momentum had weakened, broader support remained intact. From the weekly low to high, Bitcoin advanced approximately +11.10%, while the move from open to close reflected a gain of +4.67%.
Price Action Summary
Metric
Value
Weekly Open
71,316.82
Weekly Low
70,487.14
Weekly High
78,311.76
Weekly Close
74,648.74
Total Move (Low → High)
+7,824.62
Percentage Move (Low → High)
+11.10%
Net Move (Open → Close)
+3,331.92
Percentage Move (Open → Close)
+4.67%
Overall, the week’s price action suggested that the early decline was driven by cautious positioning, the subsequent rally reflected improving risk sentiment and macro tailwinds, and the late-week pullback was triggered by profit-taking, amplified by renewed geopolitical tensions and a temporary shift toward dollar strength.
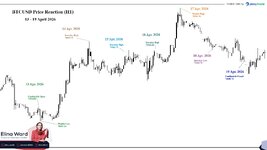
The chart below illustrates the movement of Bitcoin (BTC/USD) from April 13 to April 19, 2026, based on 1-hour candlesticks.
XAUUSD (Gold) Rebounds After Early Selloff as Geopolitics and Oil Drive Macro Repricing
Gold (XAUUSD) is a globally traded precious metal widely regarded as a safe-haven asset and an inflation hedge. It is highly sensitive to movements in the U.S. dollar, Treasury yields, and macroeconomic expectations, particularly those linked to inflation and central bank policy.
Prices advanced during the week of April 13–17, recovering from an early decline as shifting developments around U.S.–Iran tensions, oil price volatility, and changing Federal Reserve expectations drove a broad repricing across markets.
Gold opened at 4,670.19 and declined early to a weekly low of 4,644.43 on April 13, following the collapse of U.S.–Iran talks and the announcement of a U.S. naval blockade. This triggered a surge in oil prices and supported the U.S. dollar, increasing inflation expectations and reducing the likelihood of near-term rate cuts. As a result, gold came under pressure despite heightened geopolitical risk — a dynamic confirmed by major news coverage.
The trend reversed sharply on April 14, with prices rising to 4,846.15. The rebound was driven by renewed optimism around diplomatic negotiations and softer-than-expected U.S. producer inflation data. At the same time, oil prices declined and the dollar weakened, creating favorable conditions for gold as markets shifted toward a less restrictive policy outlook.
Gains proved temporary, however, as gold retraced over the next two sessions to 4,786.25 on April 15 and 4,772.62 on April 16. This pullback reflected profit-taking and a consolidation phase, with mixed geopolitical signals — including comments suggesting the conflict was “close to over” — and stable U.S. jobless claims limiting directional momentum. This midweek behavior was consistent with broader news reporting describing subdued volatility and positioning adjustments.
Buying interest returned later in the week, lifting gold sharply from the midweek lows to a weekly high of 4,889.27. The rally coincided with confirmation that the Strait of Hormuz remained open, which triggered a sharp drop in oil prices of roughly 9–10%. Lower energy prices eased inflation concerns, weakened the U.S. dollar, and pushed Treasury yields lower, creating strong tailwinds for gold. These developments were widely reported and directly aligned with the observed price spike.
Prices later eased slightly to close at 4,833.98 on April 17, marking a +163.79 point (+3.51%) weekly gain. From low to high, gold advanced +244.84 points (+5.27%).
Price Action Summary
Metric
Value
Weekly Open
4,670.19
Weekly Low
4,644.43
Weekly High
4,889.27
Weekly Close
4,833.98
Total Move (Low → High)
+244.84
Percentage Move (Low → High)
+5.27%
Net Move (Open → Close)
+163.79
Percentage Move (Open → Close)
+3.51%
Overall, the week’s price action suggested that the early decline was driven by inflationary pressure and dollar strength following geopolitical escalation, the midweek movement reflected a consolidation phase, and the late rally was supported by easing oil prices and a shift toward a more dovish Federal Reserve outlook.
The chart below illustrates the movement of XAUUSD (Gold) from April 13 to April 17, 2026, based on 1-hour candlesticks.
Brent Crude Extends Rally Above $106 as Middle East Risk Premium Builds
Brent crude oil advanced sharply through the week of April 20–23, rebounding from early losses to multi-day highs as geopolitical tensions in the Middle East drove a sustained repricing of supply risk.
The week opened near $97.52 on April 20, with prices initially softening to a weekly low of $93.60 amid cautious sentiment and the absence of immediate disruption signals. However, the tone shifted decisively on April 21, when Brent reversed higher and broke through the $100 threshold, reaching an intraday high of $101.85.
The move marked a clear inflection point in market positioning. Rather than reacting to a single headline, oil markets began gradually pricing in rising uncertainty around Gulf shipping routes and ongoing U.S.–Iran tensions. This resulted in a steady, structured advance rather than a sharp, news-driven spike.
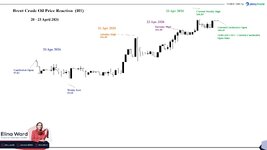
Momentum carried into April 22, with Brent extending gains to $102.89, before accelerating further into April 23. Prices climbed to a weekly high of $106.59, reflecting a +12.99 move (+13.88%) from the weekly low. The contract was last seen with a current candlestick open around $104.45 during the European session.
Technically, the rally remained well-supported, with a consistent sequence of higher highs and higher lows reinforcing bullish structure. The absence of aggressive pullbacks suggested the move was driven by sustained institutional positioning rather than short-term speculative flows.
The broader backdrop remained anchored in geopolitical developments, including unresolved negotiations between the United States and Iran, as well as persistent concerns around potential disruptions to oil flows in the Gulf. While no major oil company announcements materially shifted supply expectations during the period, the geopolitical risk premium continued to build.
Price Action Summary (20–23 April 2026)
Metric
Value
Weekly Open
97.52
Period High
106.59
Period Low
93.60
Latest Price (Apr 23 Open)
104.45
Total Move (Low → High)
+12.99 (+13.88%)
Net Move (Open → Latest)
+6.93 (+7.10%)
Total Range
12.99 (~1,299 ticks)
Summary
Oil markets once again demonstrated how strongly geopolitical developments influence price action. From a weekly low of $93.60 to a high of $106.59, Brent crude recorded a +12.99 move, equivalent to +13.88%, as markets steadily priced in rising uncertainty rather than reacting to a single event.
Geopolitics plays a critical role in oil because a large portion of global supply flows through politically sensitive regions, particularly the Middle East. Any escalation, disruption risk, or breakdown in diplomatic progress directly affects expectations around supply availability, prompting markets to reprice risk in real time.
In this case, the absence of a clear resolution, combined with ongoing tensions and shipping concerns, led to a sustained build-up of risk premium. The result was a structured upward move, highlighting how oil markets are driven not just by actual disruptions, but by the evolving probability of them.
The chart below represents Brent crude oil price action on an H1 timeframe, covering the period from April 20 to the current movement on April 23, 2026.
High-Impact Economic Calendar – 27 April – 1 May 2026
Week Overview
This week will be driven by a combination of central bank decisions, inflation data, and key U.S. macroeconomic releases, creating a high-volatility environment across global markets. Traders will focus on interest rate guidance, growth indicators, and price stability metrics, which will play a major role in shaping short-term market direction."
Times in GMT
All events are HIGH IMPACT for traders
Monday, 27 Apr 2026
Time
Country
Event
Forecast
Previous
Impact
06:00
DE
GfK Consumer Confidence (MAY)
-30
-28
High
14:30
US
Dallas Fed Manufacturing Index (APR)
-0.8
-0.2
High
23:30
JP
Unemployment Rate (MAR)
2.7%
2.6%
High
Tuesday, 28 Apr 2026
Time
Country
Event
Forecast
Previous
Impact
03:00
JP
BoJ Interest Rate Decision
0.75%
0.75%
High
14:00
US
CB Consumer Confidence (APR)
91.0
91.8
High
14:00
US
Richmond Fed Manufacturing Index (APR)
6
0
High
Wednesday, 29 Apr 2026
Time
Country
Event
Forecast
Previous
Impact
01:30
AU
Inflation Rate YoY (MAR)
4.8%
3.7%
High
12:00
DE
Inflation Rate MoM Prel (APR)
1.0%
1.1%
High
12:00
DE
Inflation Rate YoY Prel (APR)
3.3%
2.7%
High
12:30
US
Housing Starts MoM (Feb)
-5.2%
7.2%
High
12:30
US
Housing Starts MoM (Mar)
-0.7%
N/A
High
12:30
US
Building Permits MoM (Mar)
-0.7%
N/A
High
12:30
US
Building Permits MoM (Feb)
-1.9%
-4.7%
High
12:30
US
Durable Goods Orders MoM
1.3%
-1.4%
High
13:45
CA
BoC Monetary Policy Report
—
—
High
13:45
CA
BoC Interest Rate Decision
2.25%
2.25%
High
18:00
US
Fed Interest Rate Decision
3.75%
3.75%
High
18:30
US
Fed Press Conference
—
—
High
23:50
JP
Industrial Production MoM (MAR)
1.1%
-2.0%
High
23:50
JP
Retail Sales MoM (MAR)
0.8%
-2.0%
High
Thursday, 30 Apr 2026
Time
Country
Event
Forecast
Previous
Impact
01:30
CN
NBS Manufacturing PMI (APR)
50.6
50.4
High
01:45
CN
Caixin Manufacturing PMI (APR)
50.7
50.8
High
05:00
JP
Consumer Confidence (APR)
31.0
33.3
High
05:30
FR
GDP Growth Rate QoQ Prel (Q1)
0.0%
0.2%
High
05:30
FR
GDP Growth Rate YoY Prel (Q1)
1.0%
1.2%
High
06:00
DE
Retail Sales MoM (MAR)
0.5%
-0.6%
High
06:45
FR
PPI YoY (MAR)
-1.0%
-2.4%
High
06:45
FR
PPI MoM (MAR)
0.8%
-0.2%
High
06:45
FR
Inflation Rate YoY Prel (APR)
1.8%
1.7%
High
06:45
FR
Inflation Rate MoM Prel (APR)
0.7%
1.0%
High
07:55
DE
Unemployment Rate (APR)
6.3%
6.3%
High
08:00
DE
GDP Growth Rate QoQ Flash (Q1)
0.1%
0.3%
High
08:00
DE
GDP Growth Rate YoY Flash (Q1)
0.5%
0.4%
High
09:00
EA
Core Inflation Rate YoY Flash (APR)
2.4%
2.3%
High
09:00
EA
Inflation Rate YoY Flash (APR)
2.9%
2.6%
High
09:00
EA
Inflation Rate MoM Flash (APR)
1.0%
1.3%
High
09:00
EA
GDP Growth Rate QoQ Flash (Q1)
0.0%
0.2%
High
09:00
EA
GDP Growth Rate YoY Flash (Q1)
0.8%
1.2%
High
09:00
EA
Unemployment Rate
6.2%
6.2%
High
11:00
GB
BoE Interest Rate Decision
3.75%
3.75%
High
12:15
EA
Deposit Facility Rate
2.0%
2.0%
High
12:15
EA
ECB Interest Rate Decision
2.15%
2.15%
High
12:30
US
GDP Growth Rate QoQ (Adv Q1)
1.5%
0.5%
High
12:30
US
Core PCE Price Index YoY
3.1%
3.0%
High
12:30
US
PCE Price Index YoY
3.3%
2.8%
High
12:30
US
Core PCE Price Index MoM
0.3%
0.4%
High
12:30
US
Personal Income MoM
0.4%
-0.1%
High
12:30
US
Personal Spending MoM
0.4%
0.4%
High
12:30
US
Initial Jobless Claims
219K
214K
High
12:30
CA
GDP MoM (FEB)
0.2%
0.1%
High
12:45
EA
ECB Press Conference
—
—
High
13:45
US
Chicago PMI (APR)
51
52.8
High
22:45
NZ
Building Permits MoM (MAR)
-0.4%
2.7%
High
Friday, 1 May 2026
Time
Country
Event
Forecast
Previous
Impact
01:30
AU
PPI YoY (Q1)
4.1%
3.5%
High
06:30
CH
Retail Sales MoM (MAR)
0.3%
0.4%
High
14:00
US
ISM Manufacturing PMI (APR)
52.5
52.7
High
Week Summary
Week Overview This week is set to be driven by a powerhouse combination of central bank decisions, inflation data, and key U.S. macroeconomic releases. This setup creates a high-volatility environment across global markets. Traders will focus heavily on interest rate guidance, growth indicators, and price stability metrics, which will play a major role in shaping market direction through May.
Below is an overview of the U.S. Federal Funds Rate release on March 18, 2026, along with a chart showing its impact on GBP/USD, with price action reflecting market reaction using a 5-minute candlestick timeframe.
U.S. Feds Funds Rate - 18th March 2026
On March 18, 2026, the U.S. Federal Reserve held interest rates steady at 3.50%–3.75% while signaling higher inflation expectations and maintaining a cautious outlook amid heightened uncertainty driven by the U.S.–Israel war with Iran. Policymakers still projected one rate cut in 2026, but markets pushed expectations for easing further out to 2027 as rising oil prices added inflationary pressure. Fed Chair Jerome Powell emphasized the unpredictable economic impact of the conflict, noting that higher energy costs could lift inflation but with uncertain duration and scale. The situation escalated further with Iranian missile strikes damaging energy infrastructure in Qatar following attacks on Iran’s South Pars gas field, contributing to a surge in oil prices, which closed about 4% higher. Despite these pressures, the Fed maintained its broader outlook, expecting inflation to gradually decline toward target levels by 2027 while balancing risks between persistent inflation and potential labor market weakness.
Potential Profit Study:
An entry on GBP/USD at 1.1.33506 with 1 standard lot required approximately $267.01 in margin at 1:500 leverage, while at 1:2000 leverage, the margin requirement decreased to around $66.75.
The move from 1.33506 to the session low of 1.32516 totalled 99.0 pips, resulting in a potential profit of approximately $990 on a standard lot position.
XAUUSD Declines −3.77% from Peak as Oil Shock, Rising Yields, and Fed Expectations Trigger Gold Repricing
Introduction
XAUUSD (Gold vs U.S. Dollar) serves as one of the world’s leading safe-haven assets, typically responding to shifts in geopolitical tensions, inflation expectations, Federal Reserve policy, Treasury yields, and broader macroeconomic sentiment. Between April 27 and April 29, 2026, gold initially benefited from geopolitical uncertainty surrounding escalating Middle East tensions, but market psychology quickly shifted. Rather than functioning purely as a defensive haven, gold became increasingly pressured by surging oil prices, inflation concerns, elevated Treasury yields, and expectations that the Federal Reserve would maintain restrictive monetary policy for longer.
Price Action Overview
Between April 27 and April 29, XAUUSD experienced a failed bullish extension followed by a decisive bearish repricing.
Price opened at 4692.94 on April 27 and initially advanced to a period high of 4729.96, reflecting an early upside extension of approximately +0.79%. However, bullish momentum failed to hold, and price reversed sharply lower as macroeconomic pressure intensified. Gold declined to a period low of 4551.54 before stabilizing near 4569.77 by April 29 at 12:00 GMT.
From its 27 April opening price of 4692.94 to the 29 April current open price of 4569.77, XAUUSD recorded a decline of 12,317 ticks (−2.62%), while the broader move from the period high of 4729.96 to the period low of 4551.54 reflected a deeper bearish repricing of 17,842 ticks (−3.77%).
Price Action Summary Table
Metric
Value
Period Open
4692.94
Period High
4729.96
Period Low
4551.54
Latest Price (Apr 29)
4569.77
Total Move (High → Low)
−17,842 ticks
Percentage Move
−3.77%
Net Move (Open → Latest)
−12,317 ticks
Net Percentage
−2.62%
Macro & Geopolitical Drivers
The move was driven primarily by macroeconomic repricing rather than pure safe-haven demand:
Geopolitical tensions (Middle East / Iran conflict)
Escalating regional tensions initially supported gold, but markets increasingly interpreted the crisis through the lens of oil supply disruption rather than direct haven demand.
Oil shock and inflation expectations
Brent crude surged above $111–$114 during the same period, intensifying inflation fears and increasing expectations that elevated energy costs could delay monetary easing.
Federal Reserve policy expectations
During the pre-meeting blackout period leading into April 29, U.S. 10-year Treasury yields remained elevated near 4.35%, keeping the opportunity cost of holding bullion relatively high and reinforcing bearish pressure on gold.
Treasury yields and real yields
Elevated nominal and real yields directly reduced gold’s attractiveness as a non-yielding asset.
U.S. dollar firmness
A moderately stronger dollar added secondary downside pressure, reinforcing bearish sentiment.
Positioning and technical liquidation
Heavy speculative long exposure combined with the break below key support zones likely accelerated systematic selling pressure.
Conclusion
Between April 27 and April 29, XAUUSD declined −3.77% from peak to trough, with a net move of −2.62% from open to the latest open level.
The move was driven primarily by macroeconomic repricing, as markets transitioned from viewing geopolitical instability as bullish for gold toward pricing it as an oil-driven inflation shock that strengthened yields, elevated the dollar, and reinforced expectations of prolonged restrictive monetary policy.
While the initial phase reflected safe-haven demand, the broader decline represented a contraction in gold’s defensive premium as oil, inflation, Treasury yields, and Federal Reserve expectations became the dominant drivers.
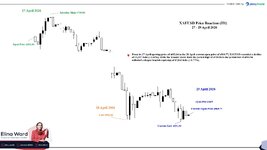
The chart below shows XAUUSD price action on a 1-hour candlestick chart covering the period from April 27 to April 29, 2026.
Geopolitical Supply Shock Reprices Global Oil as Brent Surges on Hormuz Crisis, Fed Inflation Risks, and Physical Market Tightening
Executive Summary
Between Monday, April 27, and Thursday, April 30, 2026, Brent crude experienced one of its sharpest four-day geopolitical repricings in recent years, climbing from an opening price of $107.36 on April 27 to a current intraday high of $120.33 on April 30 before moderating later in the session.
This move represented:
Brent Price Expansion:
From Monday Open (107.36) → Thursday Current Intraday High (120.33):
+12.97 points | +12.08%
From Monday Intraday Low (105.88) → Thursday Current Intraday High (120.33):
+14.45 points | +13.65%
The scale of this rally reflected a dramatic expansion in geopolitical risk premium rather than a conventional growth-driven commodity rally.
Brent’s rise was overwhelmingly driven by escalating fears of prolonged Middle East supply disruption, centered on the effective impairment of the Strait of Hormuz after stalled U.S.–Iran diplomacy, military escalation risk, and mounting concerns that a major share of global oil transit could remain structurally constrained longer than markets had initially anticipated.
While macroeconomic developments — particularly the Federal Reserve’s April 29 policy hold — influenced inflation expectations, Treasury yields, and the U.S. dollar, those forces were secondary. Instead, markets largely interpreted Fed hawkishness as confirmation that rising energy prices themselves were becoming an inflationary macro threat.
At the same time, a major U.S. crude inventory draw and record exports reinforced tightening physical fundamentals, validating Brent’s rally beyond geopolitics alone. The UAE’s decision to leave OPEC effective May 1 added longer-term strategic significance but had limited immediate influence on the week’s explosive price action.
Brent Price Action Snapshot (H1 Chart-Based)
Date
Session
Key Price Point
Brent Price
27 Apr 2026
Monday
Opening Price
107.36
27 Apr 2026
Monday
Intraday Low
105.88
28 Apr 2026
Tuesday
Intraday High
111.91
29 Apr 2026
Wednesday
Intraday High
117.70
30 Apr 2026
Thursday
Current Intraday High
120.33
Daily Breakdown: How Brent Repriced Higher
Monday, April 27 – Structural Risk Premium Begins
Brent opened at $107.36, briefly fell to $105.88, then reversed sharply higher as markets absorbed worsening geopolitical headlines.
Reports that U.S.–Iran negotiations had stalled and Strait of Hormuz shipping disruption remained unresolved triggered the week’s first major repricing wave.
Institutional Interpretation:
Markets began shifting from temporary geopolitical uncertainty to structural supply impairment.
This distinction mattered: Brent was no longer simply reacting to headlines — it was beginning to price duration.
Tuesday, April 28 – Diplomatic Weakness Deepens, Brent Reaches $111.91
Brent climbed further to $111.91, extending gains as traders increasingly assumed no near-term resolution to Middle East supply tensions.
Although the UAE’s planned OPEC departure generated headlines, markets largely treated it as strategically relevant for future supply discipline rather than a direct short-term catalyst.
Institutional Interpretation:
Immediate shipping disruption through Hormuz outweighed symbolic production policy shifts.
Wednesday, April 29 – Fed Hold, Inventory Shock, Brent Accelerates to $117.70
Wednesday marked the week’s decisive momentum phase.
Brent surged to $117.70 as three major catalysts aligned:
1. Federal Reserve Holds Rates at 3.50–3.75%
The Fed maintained rates but delivered a more inflation-sensitive tone, with internal hawkish dissents reinforcing concern that rising energy prices could sustain inflationary pressure.
2. Massive U.S. Inventory Draw
EIA data revealed a significant surprise crude draw and record exports, confirming that physical oil markets were tightening in real time.
3. Extended Blockade / Military Escalation Fears
Reports that Washington could intensify or prolong supply pressure on Iranian flows sharply expanded Brent’s geopolitical premium.
Institutional Interpretation:
This was the pivotal session where paper-market fear aligned with physical-market validation.
Thursday, April 30 – Brent Peaks at $120.33
Brent reached its highest point of the week at $120.33, completing a nearly vertical four-day repricing cycle.
This move reflected peak market anxiety over:
Prolonged Strait of Hormuz paralysis
U.S.–Iran diplomatic deadlock
Potential broader military intervention
Structural global supply shortages
At this stage, Brent was no longer trading primarily on conventional economic metrics.
Institutional Interpretation:
Oil had shifted from cyclical commodity pricing into geopolitical survival pricing.
Primary Drivers Behind Brent’s Surge
1. Strait of Hormuz Disruption (Dominant Driver)
As one of the world’s most critical oil chokepoints, any prolonged disruption immediately threatens global energy security.
2. Collapse of U.S.–Iran Diplomatic Momentum
Failed negotiations increased the market’s expectation that supply disruption would persist.
3. Physical Tightening (Inventory Draw + Record Exports)
The EIA draw transformed geopolitical fear into physical confirmation.
4. Federal Reserve Hawkish Hold (Secondary)
Rather than suppressing Brent, the Fed reinforced inflation fears connected to rising oil.
5. UAE Exit from OPEC (Medium-Term)
Strategically relevant, but not a major short-term price driver during acute supply crisis conditions.
Why Brent Rose Despite Hawkish Fed Conditions
Under ordinary circumstances:
Higher Rates + Stronger Dollar = Commodity Pressure
But this week was different.
Supply Shock > Monetary Headwind
When markets fear structural supply shortages, physical scarcity can overpower:
Higher yields
Stronger USD
Demand-side macro pressure
In this case, the Fed did not stop oil’s rise — it indirectly validated oil’s inflationary consequences.
Strategic Market Lesson
This week’s Brent rally was not a classic demand expansion story.
It was a geopolitical supply repricing event, where markets aggressively transitioned from pricing temporary disruption toward pricing prolonged strategic impairment of a critical global energy artery.
Bottom Line:
Brent rose because markets stopped asking whether disruption existed — and started pricing how long global oil supply could remain structurally constrained.
Forward-Looking Risk Factors
Brent’s next major directional phase will remain highly sensitive to:
Geopolitical:
Strait of Hormuz shipping functionality
U.S.–Iran negotiations
Military escalation headlines
Structural:
OPEC+ quota decisions
UAE post-OPEC production strategy
Macro:
U.S. inventory trends
Summer demand strength
Inflation and central bank policy
Final Conclusion
Between April 27 and April 30, Brent crude transformed from a rising commodity into a geopolitical macro asset.
The move from $107.36 → $120.33 (+12.08%) — or $105.88 → $120.33 (+13.65%) from the weekly low — reflected one dominant institutional reality:
When supply security is threatened at the geopolitical core, oil stops trading primarily on economics — and begins trading on strategic survival.
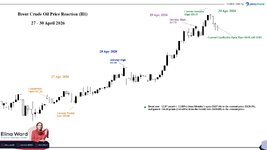
The chart below illustrates Brent Crude Oil’s 1-hour candlestick price reaction from April 27 through April 30, including the move into the current candlestick that opened at 08:00 AM GMT.
 Gold Rallies Over 22,678 Ticks Before Stabilizing as Fed Expectations and Geopolitics Drive Repricing
 Price Action Summary
 111 KB Views: 21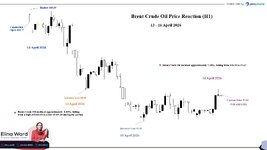
 Week Overview
 HIGH IMPACT for traders
 NZ
NZ DE
DE CA
CA JP
JP GB
GB CH
CH US
US AU
AU FR
FR EA
EA Week Summary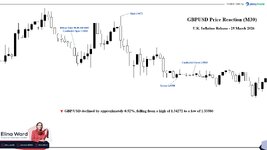
 CN
CN