This week centered on major labor market data, central bank policy, trade balances, and growth indicators, with particular attention on the RBA Interest Rate Decision, U.S. labor data, and Non-Farm Payrolls. Traders monitored these releases closely as they shaped expectations for monetary policy, economic momentum, and broader market sentiment.
Times in GMT
All events are HIGH IMPACT for traders
Monday, 4 May 2026
Time
Country
Event
Forecast
Previous
Impact
01:30
AU
Building Permits MoM Prel (MAR)
-6.0%
29.7%
High
14:00
US
Factory Orders MoM (MAR)
0.8%
0.0%
High
Tuesday, 5 May 2026
Time
Country
Event
Forecast
Previous
Impact
01:30
AU
Household Spending YoY (MAR)
5.1%
4.6%
High
04:30
AU
RBA Interest Rate Decision
4.35%
4.1%
High
06:30
CH
Inflation Rate YoY (APR)
0.8%
0.3%
High
12:30
US
Balance of Trade (MAR)
-$61.4B
-$57.3B
High
12:30
CA
Balance of Trade (MAR)
-C$3.4B
-C$5.74B
High
14:00
US
New Home Sales (MAR)
640K
—
High
14:00
US
New Home Sales MoM (FEB)
3.9%
-17.6%
High
14:00
US
JOLTS Job Openings (MAR)
7.0M
6.882M
High
14:00
US
New Home Sales MoM (MAR)
4.9%
—
High
14:00
US
New Home Sales (FEB)
610K
587K
High
14:00
US
ISM Services PMI (APR)
53.7
54.0
High
22:45
NZ
Unemployment Rate (Q1)
5.3%
5.4%
High
Wednesday, 6 May 2026
Time
Country
Event
Forecast
Previous
Impact
06:45
FR
Industrial Production MoM (MAR)
0.2%
-0.7%
High
09:00
EA
PPI MoM (MAR)
2.0%
-0.7%
High
09:00
EA
PPI YoY (MAR)
0.6%
-3.0%
High
12:15
US
ADP Employment Change (APR)
70K
62K
High
14:00
CA
Ivey PMI s.a (APR)
47.0
49.7
High
Thursday, 7 May 2026
Time
Country
Event
Forecast
Previous
Impact
01:30
AU
Balance of Trade (MAR)
A$4B
A$5.686B
High
06:00
DE
Factory Orders MoM (MAR)
1.1%
0.9%
High
06:45
FR
Balance of Trade (MAR)
-€5.7B
-€5.8B
High
07:00
CH
Unemployment Rate (APR)
3.1%
3.1%
High
09:00
EA
Retail Sales MoM (MAR)
0.4%
-0.2%
High
12:30
US
Initial Jobless Claims (May/02)
215K
189K
High
Friday, 8 May 2026
Time
Country
Event
Forecast
Previous
Impact
06:00
DE
Industrial Production MoM (MAR)
-0.7%
-0.3%
High
06:00
DE
Balance of Trade (MAR)
€14B
€19.8B
High
12:30
US
Unemployment Rate (APR)
4.3%
4.3%
High
12:30
US
Non-Farm Payrolls (APR)
95K
178K
High
12:30
CA
Full-Time Employment Change (APR)
18K
-1.1K
High
12:30
CA
Unemployment Rate (APR)
6.7%
6.7%
High
12:30
CA
Employment Change (APR)
20K
14.1K
High
14:00
US
Michigan Consumer Sentiment Prel (MAY)
50.0
49.8
High
Planning ahead for high-impact economic releases can help prepare for potential volatility before it reaches the market. By tracking the week’s key announcements in advance, it becomes easier to anticipate major market-moving moments, refine strategy, manage risk more effectively, and stay ready for shifts across currencies, commodities, stocks, and indices before the week unfolds.
Below is an overview of the April 3, 2026 Nonfarm Payrolls release, accompanied by a GBP/USD chart illustrating the market’s reaction through 5-minute candlestick price action.
Non-Farm Payrolls Release - 3 April 2026
U.S. nonfarm payrolls rose by 178,000 in March, significantly beating expectations of 59,000 and rebounding sharply from February’s revised 133,000 decline, signaling that the labor market remains resilient despite broader signs of slowing growth. The unemployment rate edged down to 4.3%, though the decline was largely driven by a sharp drop in labor force participation rather than stronger employment conditions. Wage growth came in softer than expected, with average hourly earnings rising just 0.2% monthly and 3.5% annually—the slowest yearly pace since May 2021—suggesting easing wage inflation pressures. Job gains were led primarily by health care, construction, and transportation, while federal government and financial sectors posted losses. Overall, the report reinforced expectations that the Federal Reserve is likely to remain on hold, as stronger-than-expected hiring offsets labor market weakness concerns, while softer wages and elevated inflation continue to complicate the policy outlook.
Potential Profit Study:
An entry on GBP/USD at 1.1.32255 with 1 standard lot required approximately $264.51 in margin at 1:500 leverage, while at 1:2000 leverage, the margin requirement decreased to around $66.13.
The move from 1.32255 to the session low of 1.31782 totalled 47.3 pips, resulting in a potential profit of approximately $473 on a standard lot position.
Apple Shares Rise on Record Q2 Earnings Beat and $100B Buyback Authorization
Apple Inc. (AAPL) shares climbed 5.14% during the late April trading window, fueled by a strong fiscal Q2 earnings beat, record iPhone and Services performance, and a new $100 billion share repurchase authorization.
Executive Summary
During the week of April 27–May 1, 2026, Apple Inc. (AAPL) exhibited a strong price reversal, rising 5.14% from its weekly low following the release of its fiscal second-quarter results. The company reported $111.2 billion in revenue, representing a 17% year-over-year increase, alongside earnings per share of $2.01, both exceeding Wall Street expectations.
While the week began with pre-earnings caution and broader market softness, the post-market announcement on April 30 served as the primary catalyst. CEO Tim Cook described the period as the “best March quarter ever,” highlighting record iPhone revenue and continued strength in Services.
Investor sentiment was further supported by Apple’s decision to authorize an additional $100 billion share repurchase program and increase its quarterly dividend by 4%, offsetting concerns related to rising memory costs and ongoing supply constraints for AI-capable Mac hardware.
Key Takeaways
Fiscal Q2 revenue reached $111.2B (+17% YoY), driven by record iPhone and Services performance.
Apple authorized a $100 billion share repurchase program and raised its quarterly dividend to $0.27.
Strong demand for AI-related use cases led to supply shortages in high-end Mac configurations.
Major financial institutions, including Morgan Stanley and Wells Fargo, raised price targets following the results.
Drivers Behind the Move
Fundamental Earnings Beat
Apple delivered a significant beat on both top and bottom lines, with revenue reaching $111.2 billion versus consensus estimates near $109.7 billion.
Capital Return Program
The authorization of a $100 billion buyback, alongside a dividend increase, supported investor sentiment and reinforced shareholder return expectations.
iPhone Momentum
Strong demand contributed to a record March-quarter performance for iPhone, reinforcing the strength of Apple’s core product segment.
AI-Driven Hardware Demand
Elevated demand for AI-related Mac hardware outpaced production capacity, signaling continued strength in the upgrade cycle while contributing to short-term supply constraints.
Price Action Summary Table (Apr 27 – May 1, 2026)
Metric
Value
Period Open
266.43
Period High
287.14
Period Low
265.63
Period Close
280.13
Total Move (Low → High)
+21.51
Percentage Move
+8.10%
Net Move (Open → Close)
+13.70
Net Percentage
+5.14%
Macro Backdrop
Monetary Policy Stability
The Federal Reserve maintained interest rates on May 1, providing a stable environment for equities, particularly large-cap technology.
Yield Environment
U.S. 10-year Treasury yields remained near 4.3%, continuing to weigh on high-growth valuations, though Apple’s strong cash flow profile helped mitigate these pressures.
Outlook
Apple’s late-April rally reflected strong fundamental performance and effective capital allocation. The stock remained above its 50-day moving average following the earnings-driven move, with resistance observed near the 287–290 range.
While supply-chain constraints and rising input costs remain factors to monitor, continued demand across core products and services supports the current positioning.
The chart below illustrates Apple’s price movement from April 27 to May 1, 2026, on a 30-minute candlestick timeframe.
Gold Slid as Fed Uncertainty, Oil-Driven Inflation Fears and Treasury Yields Pressured Bullion
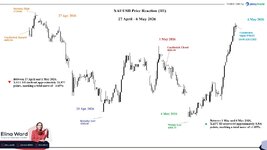
XAUUSD declined sharply between 27 April and 1 May 2026 as elevated oil prices, rising Treasury yields and shifting Federal Reserve expectations triggered a broad macro repricing across precious metals markets
Introduction
XAUUSD (Gold vs U.S. Dollar) remained one of the most macro-sensitive assets during the week of 27 April to 1 May 2026, as markets reacted to escalating Middle East tensions, elevated oil prices, inflation fears, Treasury yield volatility and changing Federal Reserve expectations.
Gold initially benefited from safe-haven demand linked to intensifying geopolitical tensions involving Iran and fears surrounding energy-market disruption.
However, the narrative shifted rapidly. Rather than functioning purely as a defensive asset, gold increasingly traded as a macro-sensitive interest-rate instrument as investors focused on the inflationary consequences of elevated oil prices and the possibility that the Federal Reserve would maintain restrictive monetary policy for longer than previously expected.
Rising Treasury yields, firmer U.S. dollar conditions and weakening expectations for near-term rate cuts ultimately became the dominant drivers behind gold’s repricing cycle throughout the week.
Price Action Overview
Between 27 April and 1 May 2026, XAUUSD experienced a failed bullish extension followed by an aggressive bearish repricing cycle.
Gold opened at 4692.94 on 27 April before rallying toward an intraday high of 4729.96 as geopolitical uncertainty initially supported haven demand.
However, bullish momentum quickly deteriorated as markets increasingly interpreted the Middle East crisis through the lens of oil-driven inflation risk rather than direct defensive demand.
Selling pressure intensified into the 29 April Federal Reserve meeting and accelerated following Jerome Powell’s press conference, where markets interpreted the overall communication as less dovish than expected.
Gold later declined sharply toward an intraday low of 4510.19 on 29 April before stabilizing.
By 1 May, bullion partially recovered and closed near 4616.40 as easing oil-market fears and short-covering activity supported moderate rebound buying.
From the 27 April opening price of 4692.94 to the 1 May closing level of 4616.40, XAUUSD recorded a net decline of approximately 7,654 ticks (−1.63%).
Meanwhile, the broader move from the intraday high of 4729.96 to the intraday low of 4510.19 reflected a deeper bearish repricing cycle of approximately 21,977 ticks (−4.65%).
Price Action Summary (27 April – 1 May 2026)
Metric
Value
Date Range
27 Apr – 1 May 2026
Period Open
4692.94
Intraday High
4729.96
Intraday Low
4510.19
Period Close
4616.40
Total Move (High → Low)
−21,977 ticks
Percentage Move
−4.65%
Net Move (Open → Close)
−7,654 ticks
Net Percentage
−1.63%
What Drove the Move
Oil Prices and Inflation Concerns
The dominant driver behind gold’s reversal was the market’s reassessment of inflation risk linked to elevated oil prices.
As tensions involving Iran escalated, markets feared prolonged disruption across Middle East energy supply chains. Rising crude prices intensified concerns that inflation pressures could remain elevated longer than expected.
Rather than supporting gold through haven demand alone, the geopolitical crisis indirectly pressured bullion by reinforcing expectations that interest rates would stay elevated for longer.
Federal Reserve and Treasury Yield Pressure
The 29 April FOMC meeting became the central macro catalyst of the week.
Although the Federal Reserve kept rates unchanged at 3.50%–3.75%, investors interpreted Jerome Powell’s comments as relatively cautious regarding inflation risks tied to geopolitical instability and energy markets.
Markets subsequently reduced expectations for aggressive near-term rate cuts.
At the same time, elevated Treasury yields increased the opportunity cost of holding non-yielding assets such as gold, while a firmer U.S. dollar added additional bearish pressure on bullion.
Macro Data Reinforced the Higher-for-Longer Narrative
Stronger consumer confidence figures, resilient GDP data and elevated inflation readings reinforced expectations that restrictive monetary policy conditions could remain in place longer than previously anticipated.
Combined with the oil-driven inflation pressure, the broader macro environment further pressured precious metals markets.
Recovery Phase After 1 May
Following the 1 May close near 4616.40, XAUUSD later staged a strong recovery into 6 May.
By 6 May at 10:00 AM GMT, gold had rebounded toward approximately 4701.81.
The recovery reflected a rebound of roughly 8,541 ticks (+1.85%) from the 1 May closing level.
The move higher was supported by partial stabilization in geopolitical sentiment, softer oil-market fears and renewed dip-buying demand after the aggressive selloff earlier in the week.
Recovery Movement Summary (1 May – 6 May 2026)
Metric
Value
Date Range
1 May – 6 May 2026
1 May Closing Price
4616.40
Current Opening Price (6 May 2026)
4701.81
Recovery Move
+8,541 ticks
Recovery Percentage
+1.85%
Conclusion
Gold’s movement between 27 April and 1 May 2026 reflected a major shift in market psychology as XAUUSD recorded a sharp −4.65% peak-to-trough repricing cycle and ended the week lower by −1.63%.
While geopolitical instability initially supported traditional haven demand, the dominant narrative quickly shifted toward persistent inflation concerns, elevated Treasury yields, firmer dollar conditions and reduced expectations for rapid Federal Reserve easing, which ultimately pressured bullion markets throughout the week.
Following the selloff phase, XAUUSD later stabilized and recovered between 1 May and 6 May, rebounding +1.85% as oil-market fears eased, geopolitical sentiment partially stabilized and dip-buying activity returned to precious metals markets.
The chart below shows XAUUSD price action on a 1-hour candlestick chart covering the period from 27 April to 6 May 2026.
Brent Crude Spiked on Hormuz Risk Before Sliding as Trump-Iran Deal Hopes Eased Oil Fears
Brent crude moved sharply between 4 May and 7 May 2026 as the market shifted from pricing Middle East supply disruption to pricing a potential easing of Strait of Hormuz risks.
Introduction
Brent crude oil remained highly sensitive to Middle East headlines between Monday 4 May and Thursday 7 May 2026, as markets reacted to Iran-related supply risks, the Strait of Hormuz standoff, U.S. military activity, Trump administration comments, inventory pressure and renewed hopes for a possible U.S.–Iran agreement.
The period began with a strong risk-premium rally as fears grew that disruption around the Strait of Hormuz could tighten global energy supply. However, that bullish pressure quickly reversed after markets began pricing in the possibility of a gradual reopening of the waterway and a diplomatic breakthrough between the United States and Iran.
Price Action Overview
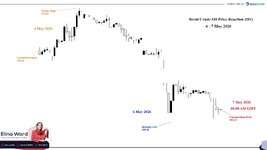
Between 4 May and 7 May 2026, Brent crude initially rallied before entering a sharp bearish repricing cycle.
Brent opened the period near 112.94 on 4 May and advanced to a weekly high of 120.05, marking an early upside move of approximately +6.30% as geopolitical risk supported oil prices.
However, the rally failed to hold. Selling pressure intensified after reports of progress toward a potential U.S.–Iran agreement reduced fears of prolonged disruption around the Strait of Hormuz.
By 6 May, Brent had fallen to an intraday low of 101.10, representing a peak-to-trough decline of approximately −15.79% from the weekly high.
By 7 May at 10:00 AM GMT, Brent traded near a current open price of 103.13, leaving the market down approximately −8.69% from the 4 May opening level, while still rebounding about +2.01% from the 6 May intraday low.
Price Action Summary: 4 May – 7 May 2026
Metric
Value
Date Range
4 May – 7 May 2026
Period Open
112.94
Weekly High
120.05
Intraday Low
101.10
Current Open
103.13
Open → Weekly High
+6.30%
Weekly High → Intraday Low
−15.79%
Open → Current Open
−8.69%
Intraday Low → Current Open
+2.01%
What Drove the Move
Strait of Hormuz Risk Drove the Initial Rally
The early move higher was driven by supply-risk pricing around the Strait of Hormuz. Reports of attacks involving ships in the Middle East Gulf and UAE energy infrastructure increased fears that disruption around one of the world’s most important energy chokepoints could deepen.
Reuters reported that crude prices had surged and slumped in line with headlines surrounding the U.S.–Iran war, while the disruption around Hormuz continued affecting physical refined-fuel flows across Asia. Reuters also noted that roughly 20% of the world’s crude and refined products had moved through the Strait of Hormuz before the closure.
That made the strait the central risk point for Brent. Any sign of deeper disruption raised fears of tighter crude flows, higher freight risk, insurance pressure and broader supply instability.
Oil Eased as Markets Looked Past Immediate Escalation
On 5 May, oil prices began easing even though tensions remained elevated. The move marked the first major shift in tone as traders started reducing part of the panic premium that had built into crude after the earlier supply-risk rally.
The market still remained concerned about disruption, but the reaction showed that traders were no longer pricing only immediate escalation risk.
Trump’s Project Freedom Pause Changed the Market Tone
The market narrative shifted further after Donald Trump announced that the United States would temporarily pause Project Freedom, the operation guiding vessels through the Strait of Hormuz.
This came before Trump said “great progress” had been made toward a deal with Iran.
The pause mattered because Project Freedom had been tied directly to the movement of stranded vessels through one of the world’s most important energy chokepoints. The Guardian reported that Trump put Project Freedom on hold so he could work on a deal with Tehran, which helped shift the market focus from military escalation toward diplomacy.
“Great Progress” With Iran Triggered a Risk-Premium Unwind
After the Project Freedom pause, oil selling accelerated as Trump signaled progress toward a potential Iran agreement.
The Guardian reported that Brent fell sharply after Trump softened his tone and spoke of “great progress” toward a final agreement with Iran, while separate reports showed oil prices falling on hopes that the Strait of Hormuz could reopen.
The selloff reflected a major shift in market psychology. Traders began pricing the possibility that even a partial agreement could lead to a gradual reopening of the Strait of Hormuz and reduce the geopolitical premium embedded in crude prices.
This helped drive Brent into a sharp bearish repricing phase, with the broader peak-to-trough movement reaching approximately −15.79%.
Inventory Draws Limited the Bearish Case
Even though peace-deal optimism pressured Brent, the physical supply picture remained tight.
Reuters reported that U.S. crude inventories fell by 2.3 million barrels to 457.2 million barrels in the week ended 1 May, while gasoline and distillate stocks also declined.
That helped explain why Brent remained volatile rather than moving in a straight line lower. The market was no longer pricing only supply disruption, but it was also not fully convinced that physical flows would normalize immediately.
Conclusion
Between 4 May and 7 May 2026, Brent crude shifted from a geopolitical risk rally into a sharp peace-deal repricing cycle.
The initial rally was driven by fears that Iran-related attacks and Strait of Hormuz disruption could tighten global crude supply. However, the move reversed after the United States paused Project Freedom and Trump later signaled progress toward a potential Iran agreement, reducing the immediate war-risk premium in oil.
By 7 May at 10:00 AM GMT, Brent remained down approximately −8.69% from the 4 May opening level, despite rebounding +2.01% from the 6 May intraday low. The broader movement showed that traders were no longer pricing only disruption risk, but also the possibility that diplomacy could gradually ease pressure on one of the world’s most important energy chokepoints.
The chart below shows Brent Crude Oil price movement on a 1-hour candlestick chart from 4 May to 7 May 2026.
This week featured a strong concentration of inflation data, growth indicators, and consumer activity releases, with markets closely focused on the U.S. CPI and PPI reports, alongside key economic updates from China, the Eurozone, the UK, and Japan.
The combination of inflation metrics and growth-related releases was expected to play a major role in shaping expectations around global monetary policy and short-term market sentiment.
Times in GMT
All events are HIGH IMPACT for traders
Saturday, 9 May 2026
Time
Country
Event
Forecast
Previous
Impact
03:00
CN
Imports YoY (APR)
—
27.8%
High
03:00
CN
Balance of Trade (APR)
$79.1B
$51.13B
High
03:00
CN
Exports YoY (APR)
—
2.5%
High
Monday, 11 May 2026
Time
Country
Event
Forecast
Previous
Impact
01:30
CN
Inflation Rate YoY (APR)
0.8%
1.0%
High
01:30
CN
PPI YoY (APR)
1.5%
0.5%
High
14:00
US
Existing Home Sales MoM (APR)
-0.7%
-3.6%
High
14:00
US
Existing Home Sales (APR)
3.95M
3.98M
High
23:30
JP
Household Spending YoY (MAR)
1.3%
-1.8%
High
Tuesday, 12 May 2026
Time
Country
Event
Forecast
Previous
Impact
00:30
AU
Westpac Consumer Confidence Change (MAY)
1.1%
-12.5%
High
01:30
AU
NAB Business Confidence (APR)
-32
-29
High
09:00
DE
ZEW Economic Sentiment Index (MAY)
-26
-17.2
High
12:30
US
Inflation Rate YoY (APR)
3.6%
3.3%
High
12:30
US
Core Inflation Rate YoY (APR)
2.6%
2.6%
High
12:30
US
Core Inflation Rate MoM (APR)
0.2%
0.2%
High
Wednesday, 13 May 2026
Time
Country
Event
Forecast
Previous
Impact
05:30
FR
Unemployment Rate (Q1)
7.8%
7.9%
High
09:00
EA
Industrial Production MoM (MAR)
0.5%
0.4%
High
12:30
US
PPI MoM (APR)
0.2%
0.5%
High
12:30
US
PPI YoY (APR)
4.2%
4.0%
High
23:01
GB
RICS House Price Balance (APR)
-19%
-23%
High
Thursday, 14 May 2026
Time
Country
Event
Forecast
Previous
Impact
06:00
GB
Industrial Production MoM (MAR)
0.1%
0.5%
High
06:00
GB
GDP Growth Rate QoQ Prel (Q1)
0.3%
0.1%
High
06:00
GB
GDP MoM (MAR)
0.2%
0.5%
High
06:00
GB
GDP Growth Rate YoY Prel (Q1)
1.4%
1.0%
High
06:00
GB
Balance of Trade (MAR)
-£3.4B
-£720M
High
12:30
US
Retail Sales MoM (APR)
0.1%
1.7%
High
12:30
US
Initial Jobless Claims (May/09)
209K
200K
High
23:50
JP
PPI YoY (APR)
—
2.6%
High
23:50
JP
PPI MoM (APR)
—
0.8%
High
Friday, 15 May 2026
Time
Country
Event
Forecast
Previous
Impact
12:30
US
NY Empire State Manufacturing Index (MAY)
4
11
High
13:15
US
Industrial Production MoM (APR)
0.1%
-0.5%
High
Week Summary
This week’s focus centred on U.S. inflation data, with Tuesday’s CPI release expected to be the week’s main volatility catalyst, followed by U.S. PPI data and UK GDP releases. Inflation and growth updates from the United States, China, Japan, the UK, and the Eurozone were expected to create elevated volatility across global markets. Planning ahead for these high-impact releases can help prepare for major market-moving moments throughout the week.
Intel CFD Rallied Sharply as Apple Foundry Hopes Fueled a 26% Weekly Gain
Intel CFD Stock Price Reaction: 4–8 May 2026
Intel CFD delivered a strong bullish reaction during the week of 4–8 May 2026, moving from an early-week dip into a sharp upside breakout by the end of the period. According to the CFD chart, price opened at 98.65 on 4 May, briefly moved lower to a weekly low of 95.55, then reversed strongly as buyers stepped back into the market.
The first major shift in sentiment came after reports said Apple had held exploratory discussions with Intel and Samsung about producing main processors for its devices in the United States. The talks were described as early-stage, but they gave the market a fresh reason to focus on Intel’s foundry business and its potential role in U.S.-based chip manufacturing.
Intel also entered the week with a stronger earnings backdrop. The company had recently reported Q1 2026 revenue of $13.6 billion, up 7% year-over-year, with non-GAAP EPS of $0.29, while guiding for Q2 2026 revenue of $13.8 billion to $14.8 billion. That helped support confidence around Intel’s turnaround narrative before the sharp price reaction developed further.
The strongest move appeared on 8 May 2026, when reports said Intel had reached a preliminary agreement to manufacture some chips for Apple devices. This triggered a major bullish reaction, with Intel shares reportedly rising around 15% as investors priced in the potential impact of a high-profile foundry partnership.
However, it is important to note that the Apple-related developments were reported market stories, not officially confirmed announcements from Intel or Apple at the time. Therefore, the price reaction reflected investor response to reported developments and foundry expectations, rather than a fully confirmed commercial agreement. Article 1 also noted that official INTC market prices were slightly different from the CFD chart values, which is normal because CFD pricing can vary slightly from the underlying listed stock.
On the CFD chart, this buying pressure pushed Intel to a weekly high of 130.47 before price cooled slightly and closed at 124.61. Even after the pullback from the high, the weekly structure remained strongly positive, as price closed far above both the opening level and the early-week low.
Price Action Summary
Movement
From
To
Point Move
Tick Move*
% Move
Open to Close Net Move
98.65
124.61
+25.96
+2,596 ticks
+26.31%
Weekly Low to Weekly High
95.55
130.47
+34.92
+3,492 ticks
+36.55%
Final Takeaway
Intel CFD opened the week at 98.65, dropped to a weekly low of 95.55, then rallied sharply to a weekly high of 130.47 before closing at 124.61. From open to close, the stock gained +25.96 points, equal to +26.31%. From the weekly low to the weekly high, the full movement reached +34.92 points, equal to +36.55%..
Overall, Intel CFD’s strong move from 4–8 May 2026 was mainly driven by renewed confidence in Intel’s foundry story, a stronger earnings backdrop, and Apple-related chip manufacturing reports. The explanation is clear and market-relevant, but the Apple catalyst should be understood as a reported development that influenced sentiment, not as an officially confirmed deal at the time.
The chart below illustrates Intel Stock’s price action on a 30-minute timeframe during the trading period from 4 May to 8 May 2026.
BTCUSD Rallied as U.S.–Iran Headlines and ETF Flows Fueled a 3.69% Weekly Gain
BTCUSD Price Reaction: 4–10 May 2026
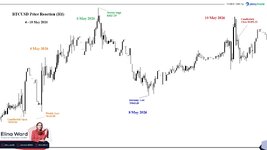
BTCUSD delivered a positive weekly reaction during the period of 4–10 May 2026, moving from an early-week low into a strong midweek rally before closing the week above its opening level. According to the BTCUSD H1 chart, price opened at 78,553.86 on 4 May, briefly moved lower to a weekly low of 78,184.68, then reversed as buyers stepped back into the market.
One major reported catalyst behind the move was geopolitical sentiment. Bitcoin rallied as optimism around a possible U.S.–Iran deal helped ease energy-market concerns and improved broader risk appetite. Market reports noted that BTC reached the $82,700 area during the move, while short-covering pressure, stronger spot demand, and a weaker U.S. dollar helped accelerate the reaction. Reuters also reported that U.S. and global stocks jumped on 5 May while oil prices eased, even as markets continued to monitor U.S.–Iran tensions around the Strait of Hormuz.
Bitcoin-specific flows also played an important role. U.S. spot Bitcoin ETFs recorded strong inflows early in the week, with Farside data showing +$532.3 million on 4 May, +$467.3 million on 5 May, and +$46.2 million on 6 May. These inflows supported the move higher and helped explain why BTCUSD pushed toward its weekly high.
The strongest upside point appeared on 6 May 2026, when BTCUSD reached a weekly high of 82,827.39. This move aligned with improving risk sentiment, strong ETF demand, short-covering momentum, and the breakout above the psychological 80,000 level.
However, the rally did not continue in a straight line. After reaching the weekly high, BTCUSD pulled back into 8 May, touching an intraday low of 79,163.26. This cooling phase was linked to profit-taking, weaker ETF-flow momentum, and renewed macro caution. Farside data showed ETF flows turned negative later in the week, with -$268.5 million on 7 May and -$145.7 million on 8 May.
Macro news also influenced the market. On 8 May, the U.S. Bureau of Labor Statistics reported that nonfarm payroll employment rose by 115,000 in April, while unemployment stayed at 4.3%. The labor-market reading reduced urgency for near-term Fed rate cuts, adding a pressure point for risk assets. The Federal Reserve had also kept the federal funds target range at 3.50%–3.75% at its 29 April meeting, keeping monetary policy restrictive.
Another Bitcoin-related support came from U.S. crypto regulation headlines. Reuters reported that the Senate Banking Committee was set to consider the CLARITY Act, a bill designed to create a clearer regulatory framework for cryptocurrency and clarify financial regulators’ jurisdiction over digital assets. This added a supportive regulatory backdrop, although it was not the main driver of the weekly price move.
On the BTCUSD chart, buying pressure returned after the 8 May pullback, and price recovered into 10 May before closing at 81,452.22. Even though BTCUSD failed to hold the full weekly high, the structure remained positive because price closed well above both the opening level and the weekly low.
Price Action Summary
Movement
From
To
Point Move
Tick Move*
% Move
Open to Close Net Move
78,553.86
81,452.22
+2,898.36
+289,836 ticks
+3.69%
Weekly Low to Weekly High
78,184.68
82,827.39
+4,642.71
+464,271 ticks
+5.94%
Final Takeaway
BTCUSD opened the week at 78,553.86, dropped to a weekly low of 78,184.68, then rallied to a weekly high of 82,827.39 before closing at 81,452.22. From open to close, Bitcoin gained +2,898.36 points, equal to +3.69%. From the weekly low to the weekly high, the full movement reached +4,642.71 points, equal to +5.94%.
Overall, BTCUSD’s move from 4–10 May 2026 was mainly supported by early-week U.S.–Iran deal optimism, strong spot Bitcoin ETF inflows, and short-covering momentum. Later ETF outflows, profit-taking, stronger U.S. labor data, and Fed-rate expectations limited follow-through after the weekly high.
The chart below illustrates BTCUSD’s price action on a 1-hour timeframe during the trading period from 4 May to 10 May 2026.
XAUUSD Turned Volatile as Iran War Risk Clashed With Hot U.S. Inflation and Fed Rate Pressure
XAUUSD Gold Price Reaction: 11–13 May 2026
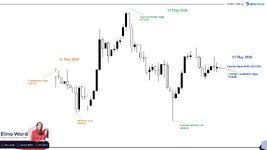
XAUUSD moved through a highly volatile trading structure between 11 May and 13 May 2026, as gold was pulled between safe-haven demand from Middle East geopolitical risk and selling pressure from stronger U.S. inflation data. According to the chart, gold opened at 4697.82 on 11 May, dropped to an early intraday low of 4648.04, then recovered as buyers returned to the market.
The first major pressure on gold came from renewed inflation concerns linked to the Iran war and elevated oil prices. Reuters reported that weak progress in U.S.–Iran peace negotiations pushed oil prices higher and raised concerns that inflation could keep interest rates higher for longer. This mattered for gold because higher interest-rate expectations tend to pressure non-yielding assets such as bullion.
The strongest upside reaction appeared on 12 May 2026, when XAUUSD pushed to a current weekly high of 4773.32. This move aligned with safe-haven demand as traders continued to monitor the Iran conflict, the Strait of Hormuz disruption, and broader geopolitical uncertainty. However, the move failed to hold as the market shifted focus back toward inflation and Federal Reserve policy pressure.
The key macro catalyst was the April U.S. CPI report. The Bureau of Labor Statistics reported that CPI rose 0.6% month-on-month in April and 3.8% year-on-year, while core CPI rose 2.8% year-on-year. Energy prices rose 17.9% over the year, confirming that energy-market stress had fed directly into inflation.
That inflation reading strengthened the higher-for-longer Fed narrative. The Federal Reserve had already kept the target range for the federal funds rate at 3.50%–3.75% on 29 April, while noting that inflation remained elevated partly because of higher global energy prices and that Middle East developments had created a high level of uncertainty.
By 13 May 2026, XAUUSD had pulled back from the weekly high and opened the current 08:00 GMT candlestick at 4702.46. Reuters reported that gold slipped as firm U.S. inflation data reduced hopes for Fed rate cuts, with spot gold down around 0.3% near $4,701.98 per ounce.
It is important to note that gold’s movement was not driven by one single event. The chart reflected a two-sided market reaction: geopolitical risk supported gold as a safe-haven asset, while stronger inflation, higher oil prices, firmer yields, and reduced Fed rate-cut expectations limited the upside. Reuters also reported that the U.S. Energy Information Administration expected the Strait of Hormuz disruption to remain a key pressure point through May, keeping energy-market risk in focus.
On the chart, this conflict produced a sharp rally to 4773.32, followed by a reversal toward the current weekly low of 4638.34, before price stabilized near the 4702.46 reference level.
Price Action Summary
Movement
From
To
Point Move
Tick Move*
% Move
Visual Move
Open to Current Reference Move
4697.82
4702.46
+4.64
+464 ticks
+0.10%
+4.64 ↗ / +0.10% ↗
Weekly High to Current Weekly Low
4773.32
4638.34
-134.98
-13,498 ticks
-2.83%
-134.98 ↘ / -2.83% ↘
Final Takeaway
XAUUSD opened the period at 4697.82, dropped to an early intraday low of 4648.04, then rallied sharply to a current weekly high of 4773.32 before reversing lower. From the weekly high to the current weekly low of 4638.34, gold fell -134.98 points, equal to -2.83%. From the original open to thecurrent08:00 GMT candlestick open at 4702.46, gold was only slightly higher by +4.64 points, showing how much of the safe-haven rally had been retraced.
Overall, XAUUSD’s movement from 11 May to 13 May 2026 was mainly driven by the clash between Iran-war safe-haven demand and U.S. inflation-driven Fed pressure. Gold initially benefited from geopolitical uncertainty, but stronger CPI data, elevated oil prices, firmer yields, and reduced rate-cut expectations prevented the rally from holding.
The chart below illustrates XAUUSD price action on a 1-hour timeframe during the trading period from 11 May to 13 May 2026.
Brent Crude Oil Turned Volatile as Hormuz Supply Risk Clashed With U.S. Inflation Pressure
Brent Crude Oil Price Reaction: 11–14 May 2026
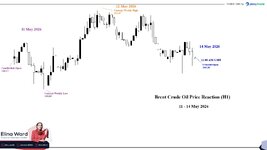
The chart below illustrates the movement of Brent Crude Oil on a 1-hour candlestick timeframe from 11 to 14 May 2026.
Brent Crude Oil moved through a volatile trading structure between 11 May and 14 May 2026, as the market was pulled between Middle East supply-risk pricing, inflation pressure, and uncertainty around diplomatic progress. According to the chart, Brent opened at 108.17 on 11 May, dropped to a period low of 106.06, then rallied sharply as buyers returned to the market.
The first major support for Brent came from renewed concerns around the Iran war and the Strait of Hormuz disruption. Reuters reported that oil prices rose as U.S.-Iran negotiations remained fragile, while Tehran emphasized sovereignty over the Strait of Hormuz, a route that handles about one-fifth of global oil and liquefied natural gas flows.
The strongest upside reaction appeared on 12 May 2026, when Brent pushed to the chart’s current period high of 111.47. This move aligned with fading hopes for peace in the Middle East and continued concern that restricted physical flows through the Strait of Hormuz could keep crude prices supported. Reuters also reported that both major oil benchmarks had gained nearly 2.8% on the previous session as supply concerns remained in focus.
However, the move failed to hold near the high. By 13 May, Brent started to pull back as traders shifted attention toward U.S. inflation pressure, possible interest-rate hikes, and demand concerns. Reuters reported that oil contracts fell on Wednesday as investors worried that higher fuel prices could spur inflationary pressure and raise the risk of U.S. rate hikes.
By 14 May 2026, Brent had stabilized below the 12 May high. The chart showed the current 11:00 AM GMT candlestick opening at 108.28. On the same day, Reuters reported that oil prices were flat after earlier gains faded, while markets also watched the Trump-Xi meeting in Beijing for any signs of diplomatic progress around Iran, China’s role, and keeping energy flows through the Strait of Hormuz open.
It is important to note that Brent’s movement was not driven by one single event. The chart reflected a two-sided market reaction: supply-route disruption supported crude prices, while inflation pressure, interest-rate concerns, and uncertainty over diplomatic progress limited the upside. The IEA also reported that global observed oil inventories fell by 129 million barrels in March and another 117 million barrels in April, confirming that the market backdrop remained tight.
On the chart, this conflict produced a sharp rally from 106.06 to 111.47, followed by a reversal toward the 108.28 reference level by 14 May.
Price Action Summary
Movement
From
To
Price Move
Tick Move*
% Move
Visual Move
Open to Current Reference Move
108.17
108.28
+0.11
+11 ticks
+0.10%
+0.11 ↗ / +0.10% ↗
Period Low to Period High
106.06
111.47
+5.41
+541 ticks
+5.10%
+5.41 ↗ / +5.10% ↗
Period High to Current Reference
111.47
108.28
-3.19
-319 ticks
-2.86%
-3.19 ↘ / -2.86% ↘
Final Takeaway
Brent Crude Oil opened the period at 108.17, dropped to an early low of 106.06, then rallied sharply to a current period high of 111.47 before reversing lower. From the period low to the period high, Brent gained +5.41 points, equal to +5.10%. From the high to the current 14 May 11:00 AM GMT reference level at 108.28, Brent fell -3.19 points, equal to -2.86%, showing that a large part of the geopolitical-risk rally had been retraced.
Overall, Brent’s movement from 11 May to 14 May 2026 was mainly driven by the clash between Strait of Hormuz supply risk and macro pressure from inflation and interest-rate concerns. Crude initially benefited from geopolitical uncertainty, but inflation concerns, possible Fed rate pressure, and uncertainty over diplomatic progress prevented the rally from holding near the 111.47 high.
The chart below illustrates the movement of Brent Crude Oil on a 1-hour candlestick timeframe from 11 to 14 May 2026.
Week Overview This week featured a heavy concentration of inflation data, labor market releases, PMI surveys, and central bank communications, with major focus placed on the UK inflation cluster, FOMC Minutes, and Global PMI Flash releases across Europe, the UK, the U.S., Japan, and Australia.
The combination of inflation indicators and forward-looking business activity surveys was expected to create elevated volatility across global sessions as markets reassessed growth expectations and monetary policy outlooks.
Times in GMT All events are HIGH IMPACT for traders Monday, 18 May 2026
Time
Country
Event
Forecast
Previous
Impact
02:00
CN
Industrial Production YoY (APR)
5.5%
5.7%
High
02:00
CN
Unemployment Rate (APR)
5.5%
5.4%
High
23:50
JP
GDP Growth Annualized Prel (Q1)
1.8%
1.3%
High
23:50
JP
GDP Growth Rate QoQ Prel (Q1)
0.4%
0.3%
High
Tuesday, 19 May 2026
Time
Country
Event
Forecast
Previous
Impact
00:30
AU
Westpac Consumer Confidence Change
-1.1%
-12.5%
High
01:30
AU
RBA Meeting Minutes
—
—
High
06:00
GB
Unemployment Rate (MAR)
5.3%
4.9%
High
06:00
GB
Employment Change (MAR)
-20K
25K
High
09:00
EA
Balance of Trade (MAR)
€35B
€11.5B
High
12:30
CA
Core Inflation Rate MoM (APR)
—
0.2%
High
12:30
CA
Building Permits MoM (MAR)
10.8%
-8.4%
High
12:30
CA
Inflation Rate YoY (APR)
3.0%
2.4%
High
12:30
CA
Core Inflation Rate YoY (APR)
2.7%
2.5%
High
Wednesday, 20 May 2026
Time
Country
Event
Forecast
Previous
Impact
06:00
GB
Core Inflation Rate MoM (APR)
—
0.4%
High
06:00
GB
Core Inflation Rate YoY (APR)
—
3.1%
High
06:00
GB
Inflation Rate YoY (APR)
—
3.3%
High
06:00
DE
PPI YoY (APR)
1.6%
-0.2%
High
06:00
DE
PPI MoM (APR)
1.1%
2.5%
High
18:00
US
FOMC Minutes
—
—
High
22:45
NZ
Balance of Trade (APR)
—
NZ$698M
High
23:00
AU
S&P Global Services PMI Flash (MAY)
—
50.7
High
23:00
AU
S&P Global Composite PMI Flash (MAY)
—
50.4
High
23:00
AU
S&P Global Manufacturing PMI Flash (MAY)
—
51.3
High
23:50
JP
Imports YoY (APR)
—
10.9%
High
23:50
JP
Exports YoY (APR)
—
11.7%
High
23:50
JP
Machinery Orders YoY (MAR)
—
24.7%
High
23:50
JP
Balance of Trade (APR)
—
¥667B
High
23:50
JP
Machinery Orders MoM (MAR)
—
13.6%
High
Thursday, 21 May 2026
Time
Country
Event
Forecast
Previous
Impact
00:30
JP
S&P Global Services PMI Flash (MAY)
—
51.0
High
00:30
JP
S&P Global Composite PMI Flash (MAY)
—
52.2
High
00:30
JP
S&P Global Manufacturing PMI Flash (MAY)
—
55.1
High
01:30
AU
Full-Time Employment Change (APR)
—
52.5K
High
01:30
AU
Employment Change (APR)
10K
17.9K
High
01:30
AU
Unemployment Rate (APR)
4.3%
4.3%
High
07:15
FR
S&P Global Composite PMI Flash (MAY)
47.1
47.6
High
07:15
FR
S&P Global Manufacturing PMI Flash (MAY)
52.7
52.8
High
07:15
FR
S&P Global Services PMI Flash (MAY)
46.0
46.5
High
07:30
DE
S&P Global Manufacturing PMI Flash (MAY)
51.6
51.4
High
07:30
DE
S&P Global Composite PMI Flash (MAY)
48.0
48.4
High
07:30
DE
S&P Global Services PMI Flash (MAY)
46.2
46.9
High
08:00
EA
S&P Global Manufacturing PMI Flash (MAY)
52.5
52.2
High
08:00
EA
S&P Global Composite PMI Flash (MAY)
47.5
48.8
High
08:00
EA
S&P Global Services PMI Flash (MAY)
47.0
47.6
High
08:30
GB
S&P Global Manufacturing PMI Flash (MAY)
51.2
—
High
08:30
GB
S&P Global Services PMI Flash (MAY)
51.7
52.7
High
08:30
GB
S&P Global Composite PMI Flash (MAY)
51.9
52.6
High
12:30
US
Housing Starts MoM (APR)
—
10.8%
High
12:30
US
Building Permits MoM Prel (APR)
—
—
High
12:30
US
Philadelphia Fed Manufacturing Index (MAY)
—
26.7
High
12:30
US
Initial Jobless Claims (May/16)
—
—
High
13:45
US
S&P Global Manufacturing PMI Flash (MAY)
—
—
High
13:45
US
S&P Global Services PMI Flash (MAY)
—
51.0
High
13:45
US
S&P Global Composite PMI Flash (MAY)
—
—
High
23:30
JP
Core Inflation Rate YoY (APR)
—
1.8%
High
23:30
JP
Inflation Rate YoY (APR)
—
1.5%
High
Friday, 22 May 2026
Time
Country
Event
Forecast
Previous
Impact
06:00
GB
Retail Sales MoM (APR)
—
0.7%
High
06:00
DE
GfK Consumer Confidence (JUN)
-34
-33.3
High
08:00
DE
Ifo Business Climate (MAY)
82.0
84.4
High
12:30
CA
Retail Sales MoM Prel (APR)
—
—
High
12:30
CA
PPI YoY (APR)
—
7.8%
High
12:30
CA
PPI MoM (APR)
—
2.4%
High
Week Summary This week’s focus centered on inflation data, labor market releases, and Global PMI surveys, with Wednesday’s UK inflation cluster and Thursday’s worldwide PMI Flash releases expected to generate the strongest volatility. Markets also closely monitored the FOMC Minutes for additional signals on future U.S. monetary policy direction. Planning ahead for these high-impact announcements can help prepare for major market-moving moments across currencies, commodities, stocks, and indices throughout the week.
 High-Impact Economic Calendar – 4–8 May 2026
 Week Overview
 HIGH IMPACT for traders
 Monday, 4 May 2026
 AU
AU US
US CH
CH CA
CA NZ
NZ FR
FR EA
EA DE
DE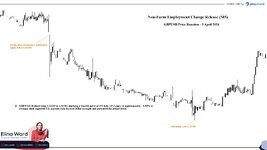 118 KB Views: 25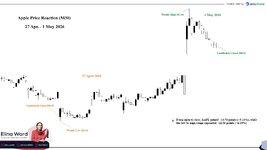
 Saturday, 9 May 2026
 CN
CN JP
JP GB
GB Week Summary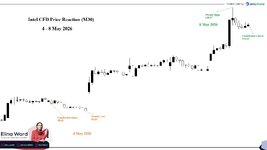
 +4.64 ↗ / +0.10% ↗