terima kasih sbb bagi sokongan
cadangan sy elok di senaraikan chart pattern yang di ketahui supaya senang menjadi rujukan semua mcm saudara sx386 buat di awal thread ...hehe lepas tue baru ke langkah seterusnya
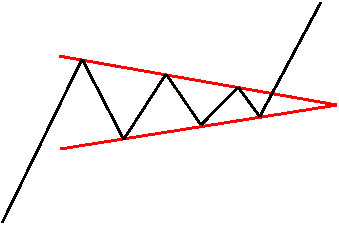
Bullish symmetrical triangles represent neutral periods of doubt and indecision. They are characterized by a series of higher lows and lower highs as the forces of supply and demand are nearly equal.Each rally is seen as a selling opportunity while each dip is met with buying. The pattern is typically large and takes several months or more than a year to form.
The best breakouts occur ½ to ¾ of the way through the pattern. A stock seems to gain energy as it is compressed into the triangle, but that energy dissipates beyond the ¾ point. It is recommended that traders abandon a stock that trades beyond the ¾ mark for very little movement is likely to occur. Volume typically diminishes as the pattern develops because traders become more and more unsure as to the stock's future direction. Then, seemingly without warning, the stock explodes out of the pattern.
Bullish symmetrical triangles appear in uptrends and typically resolve themselves to the upside. Breakouts to the upside must be accompanied by a significant increase in volume to confirm the breakout. Failure to accomplish this doesn't automatically render the play invalid, but it does raise a yellow flag. Besides volume, the astute trader ought to look for a close above the most recent high. This price represents the previous area of selling pressure and an area where stockholders may be looking to “get out even.” It is recommended that if volume does not accompany the break, and if the stock fails to make a higher high within a reasonable amount of time, the trader should move a sell stop up to protect profits.
The expected price movement upon breakout is approximately equal to the widest part of the pattern.