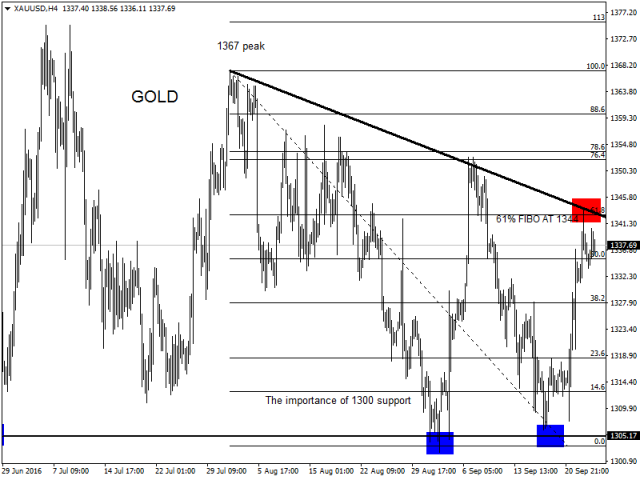
The yellow metal managed to preserve 1300 handle, which is considered as a major support in the daily chart. Gold benefited from dovish FED comments to recover from its recent losses, breaking above 1328 short-term resistance and reaching a high of $1344 per ounce on Friday.
This level represents the 61.8% retracement of the bearish cycle that comes from 1367 peak to 1302 low, consequently, a downside correction can be seen early next week.
Looking at the biggest picture, gold remain bullish as far as prices keep trading above 1300 psychological support, however we still need to see a clear breakout above 1352/1357 resistance zone to confirm another extension higher towards 1367 level followed by 2016 high at $1375 per ounce.
In the near-term, if prices correct lower, then we will look for support around 1328/1300 zone before a new bullish cycle begin.
Technically, the Dollar remain steady despite that the U.S Manufacturing PMI came out less than expected in September.
Bulls managed to protect the 95.00 daily support and for the time being, the focus is on 95.55 near-term barrier as a break above it should send prices higher towards 96.00 handle.
Recently, the Dollar index broke above its bearish trend line that comes from 97.60 peak reinforcing the bullish outlook in the near-term and the recent bounce can be considered as a positive sign as traders began to digest the recent statement from the FED. Therefore, the selling pressure may unwind in the coming days.
As of now, it is clear that market participants are pricing on a rate hike in December, meanwhile, the U.S dollar can resume its advance towards the mentioned above zone.
In the downside, only a daily close below 94.90 support will put the Dollar under pressure again.
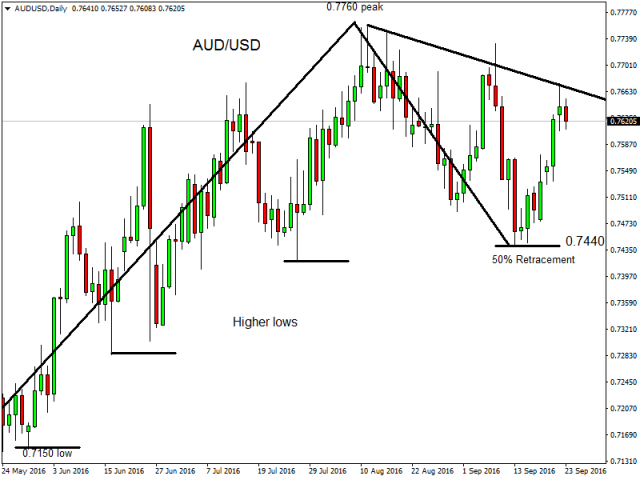
The Australian Dollar jumped from the 50% retracement of the cycle that comes from 0.7760 peak to 0.7150 low, and continue to print higher lows in the daily chart, which keeps the bullish trend intact in this pair.
Prices succeeded to overtake 0.7620 resistance level, and by now, a move back in the direction of 0.7575/60 area should offer fresh long opportunities for buyers. In the near-term, the pair should trade sideways as momentum indicators are sitting in the overbought territories and we will focus on the key levels to determine the next directional move.
To summarize, the pair is bullish in the daily chart while the hourly chart is sideways to positive and as far as 0.7550/70 zone is intact, another rally cannot be ruled out in the following days.
Beginning with USD/CAD, the pair failed to break above 1.3280/1.3300 monthly resistance zone and turned sharply after prices dropped below 1.3194 support. The pair has reached a high of 1.3278 following crude oil inventories release before the sell-off begin. The move was fast because of the surprise effect following the output-cap deal and by now the pair the outlook has become strongly bearish in the short-term.
Technically, momentum indicators turned negative and a continuation lower is likely in the coming hours. Regarding the next levels of interest, the selling pressure should send prices to as low as 1.3000 psychological support while a recovery towards 1.3155/1.3172 zone is likely to cap any rally attempt.
To conclude, as far as 1.3225 peak is intact in the hourly chart, the trend should stay bearish.
The Australian Dollar remain one the strongest currencies this year and a new rally towards 2016 peak is likely in the following days.
Looking at the recent price action, the pair continue to respect the higher lows structure seen from 0.7150 support, consequently, the preference should be to the upside. In the hourly chart, as far as 0.7640 low is in place, the pair should continue to gain ground in the direction of 0.7730 resistance while a drop to 0.7675/60 support zone should find strong buyers.
After falling to a low of 0.7232 earlier today, the kiwi managed to bounce strongly on the back of OPEC recent deal. From a technical standpoint, the pair remain overbought in the near-term and as long as 0.7320 high is intact, we expect prices to keep trading sideways until a clear breakout above the mentioned above resistance level happens.
In the opposite, a daily close below 0.7210/20 support zone should confirm a change in the short-term positive trend.
Oil rallied more than 5% reinforcing the scenario of a double bottom patter near $44.20 per barrel. In the meantime, prices succeeded to overtake a major resistance level located at 46.50 level, which may clear the path for further advance in the direction of 47.75 barrier.
In the other side, a move to 46.50 may offer fresh long opportunities for bulls and therefore this former resistance is likely to turn as a support in the coming hours.
From a wider angle, Oil is trading sideways in the weekly chart and only a clear break above $51.00/51.75 per barrel will confirm that prices have bottomed for this year and a big recovery can be expected in the coming months. In the meantime, if we look at the theoretical target of the recent double bottom reversal pattern, we can see that 48.90 represents this price objective and coincide with a former resistance level.
To summarize, Oil outlook turned positive for the time being and the recent rally can extend to as high as $49 per barrel as far as 44.20 low is in place.
The Euro continue to trade sideways inside a 100pips range located between 1.1285 to the upside and 1.1185 support in the downside as the lack of economic releases from the Eurozone weighs on liquidity.
Looking at the hourly chart, the pair still fighting to overtake 1.1235 barrier, which is considered as the near-term resistance for the single currency. The pair has showed a potential double top bearish formation around this level, however, a clear breakdown below 1.1185 is needed to confirm that bears have regained the control. Otherwise, the Euro may keep consolidating in the coming hours until prices manage to exit this range bound.
In the daily chart, the single currency remain under pressure below 1.1365 peak, and a daily close below 1.1185 support will confirm this negative outlook and send prices in the direction of 1.1100 handle while close above 1.1285 will confirm a bullish reversal.
The British pound keep fighting for a clear direction in the near-term and volatility is likely to increase in the coming hours, ahead of the U.S GDP figures.
From a technical standpoint, the Sterling remain positive in the hourly chart as far as 1.2950/35 support zone is in place. However, the pair lacks positive momentum for a sustainable bullish reversal, which can keep the upside potential limited in this pair.
In the near-term, the focus should be 1.2980 support as a break below it will bring the bearish pressure and can send the pair to as low as 1.2915 in the next days.
In the flipside, a daily close above 1.3030/1.3056 resistance levels can be the trigger for a move back up towards 1.3120 barrier.
After several attempts to break above 1357 hourly resistance that failed, prices turned lower again from the 61.8% retracement of the recent recovery seen from 1306 support reinforcing the negative outlook in the near-term.
Technically, gold turned bearish in the near-term as prices has shown five consecutive lower highs from the yearly peak of $1375, which increase the probability of further weakness in the coming days. As of now, $1320/1318 represents the short-term resistance zone and a clear breakdown below it, should trigger another sell-off in the coming hours.
To conclude, gold remain under pressure and the upside potential is likely to be limited below 1342 peak, while another dip towards 1306 support remain possible.