The Euro began the week higher on the back of profit taking ahead of FED rate decision scheduled for the coming Wednesday.
The single currency traded into a short-term corrective wave that found an end around 1.1200 former support, which turned as a resistance for the time being.
Looking at last week close, we believe that the pair is set for further decline, especially if 1.1235 hourly resistance remain intact. Therefore, a move lower towards 1.1125 area is likely followed by 1.1045 major support.
This view remains valid as far as prices keep trading below 1.1285 peak and only a daily close above this level, will cancel this negative scenario.
The Sterling jumped to reach as high as 1.3090 level before to retreat during the U.S trading session.
Regarding the daily trend, cable remain strongly bearish after the breakdown below 1.3055 support that happened last Friday. Therefore, today’s rally is likely to be short-lived as the pair may face strong resistance around 1.3075-1.3135 zone, for another acceleration to the downside during the coming days.
As of tomorrow, traders should focus on 1.3030/15 support as a break below it will confirm that bears have overtook the control of the market again. Consequently, 1.2935 is likely to be tested.
In the flipside, a breakout above 1.3090 peak will expose 1.3135 barrier before to see new sellers.
The pair turned from neutral to slightly bearish in the hourly chart as prices dropped below 101.70 support in early European trading session.
Therefore, another extension lower in the direction of 101.35 support level is expected, meanwhile, when looking at today’s price action, the pair needs further bearish momentum to confirm a potential break lower. In the meantime, from a market correlation angle, we can see that the Dollar is quite strong in the near-term against a basket of G10 currencies, which can support Dollar/Yen from falling.
In the daily chart, the pair found strong resistance near the 61.8% retracement of the entire decline that began from 107.50 peak, which stands at 104.45 level and therefore, a downside continuation is possible in the coming days.
As of now, the bullish momentum seen recently has faded and a daily close below 101.35/20 support zone would be ideal for another sell-off that can reach 100.50 major support.
In the flipside, only a breakout above 103.35 peak will confirm a major bullish reversal in the pair.
The Australian Dollar managed to bounce on Monday as prices succeeded to overtake the 0.7500 handle again.
Despite that, momentum indicators are still calling for additional weakness in the pair as far as 0.7740 peak is in place.
In the hourly chart, the recent rally stalled at September13 resistance, which stands at 0.7567 and we should continue to see further decline in the coming hours especially if the Aussie succeed to break below 0.7500 psychological support for the second time.
In the other side, only a daily close above 0.7567 peak will unwind the selling pressure and another jump in the direction of 0.7725 weekly resistance can happen.
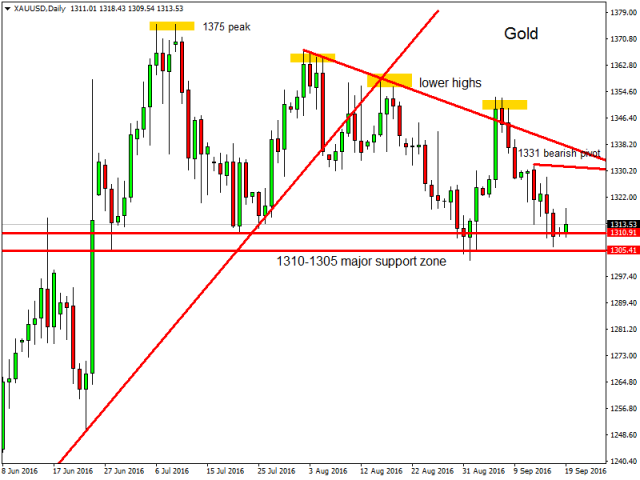
The Yellow metal lost its force in the near-term as both global equities and the U.S Dollar strengthened recently, reducing the demand for safe havens like Gold and Silver.
Technically, prices remain under pressure in the hourly chart, as Gold failed to overtake 1357 hourly resistance. Looking at the recent price action, since forming a top at $1375 per ounce, prices have printed a series of lower highs, which shows the weakness in gold for the short-term.
As of now, the focus will be on 1300 psychological support ahead of FED rate decision this week and a break below it will trigger a big sell-off in the yellow metal with targets around 1286$.
In the flipside, if prices bounce and manage to overtake 1327-1331 resistance zone, then we can say that gold has found a real bottom around 1300 support and prices should be ready for a re-test of 1357 resistance.
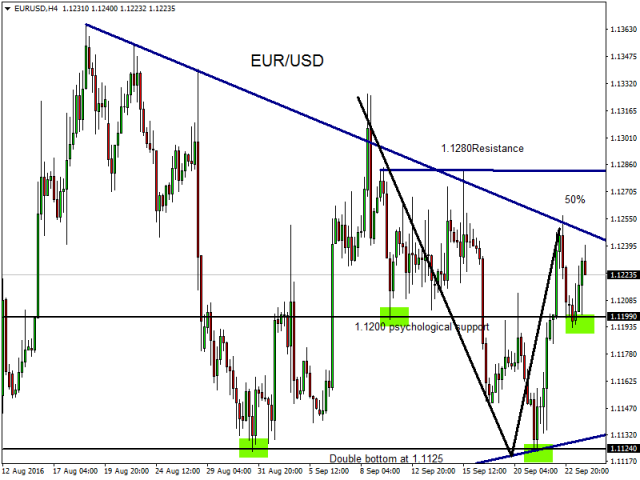
The Euro remain steady in the near-term after prices showed a double bottom formation around 1.1125 support. The single currency traded higher by the end of the week, however, the pair found strong resistance at 1.1250 level, which represents the 50% fibonacci retracement from 1.1365 peak coupled with the bearish trendline in the hourly chart. Therefore, prices are likely to consolidate in a sideways manner until we see a clear breakout above this barrier, which will open the path of 1.1328 resistance followed by a re-test of 1.1365 area in extension.
In the opposite, only a daily close below 1.1125 support should put the pair under pressure again.
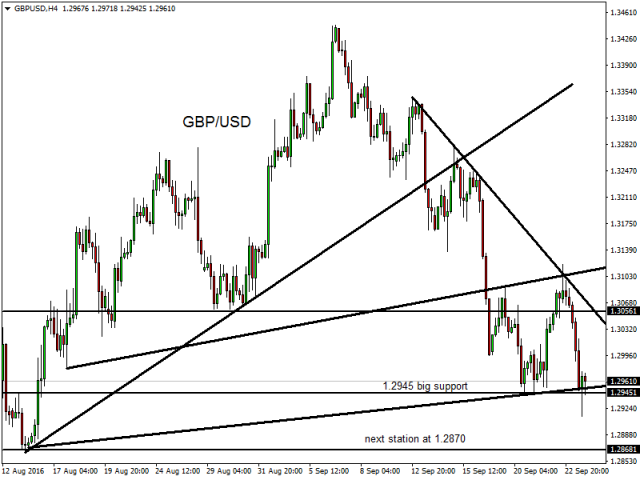
Cable sold-off sharply on Friday as prices managed to break below the 1.3000 psychological support, the pair has made a fresh weekly low at 1.2915 before to stabilize around 1.2960 level. Looking at the recent price action, we have seen a strong bearish engulfing candle in the daily chart, which may clear the path for further weakness in the pair towards 1.2865 weekly support followed by 2016 low, which stands at 1.2795. Meanwhile, the pair still need to show a daily close below 1.2945 support to confirm the next wave to the downside.
Finally, if prices manage to recover during the beginning of next week, then we will look for resistance around 1.3020/45 area before the selloff resume. This scenario is valid as far as 1.3120 peak is intact.
From a technical standpoint, the pair remain clearly oversold in the short-term; in the meantime, we continue to see strong reaction each time the pair is trying to break below 100.00 psychological support. This level is important to Bank of Japan officials, and we may still see some interventions from time to time around this level.
Looking at the recent price action, the pair failed near 102.80 resistance level and extended its decline below the 101.00 daily support, which cleared the path for a big sell-off that reached as low as 100.10 following the recent FOMC rate decision.
In the near-term, momentum indicators started to show some positive signs; however, the current jump can be defined as a dead cat bounce as the pair remain strongly bearish below 102.80 peak. Therefore, this recovery can be short-lived and we expect strong sellers to appear between 101.20/101.45 resistance zone, before to see a downside reaction again.
In extension, a break above this zone should open the way to a re-test of 101.75 resistance..
Finally, the picture remain negative in the daily chart as prices keep printing lower highs since early 2016 peak and consequently, the selling pressure is likely to resume when the fundamental dynamics converge again.
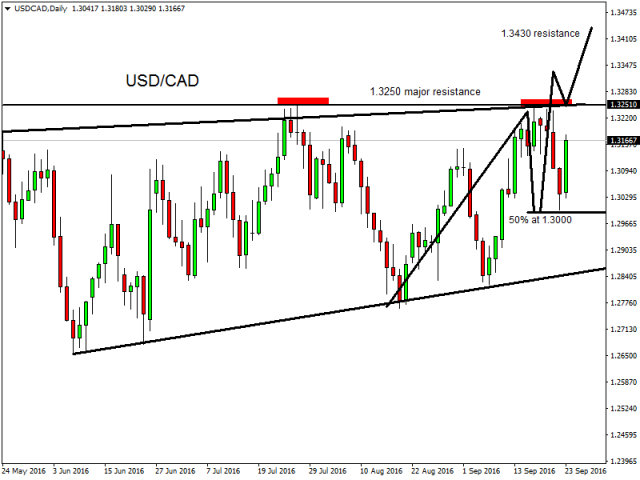
The pair continue to fight for a clear direction in the near-term, volatility increased on Friday as Saudis do not see output deal for Oil.
Technically, prices fell on Wednesday to retrace 50% of the entire recovery seen from
1.2762 low before to bounce strongly from this level, which coincide with the 1.3000 handle.
Consequently, the outlook has turned positive again in the hourly chart, and another attempt to break above 1.3250 barrier is likely during the week ahead.
If the pair succeed to overtake this crucial resistance, then traders should expect a big rally in the coming days that can target as high as 1.3430-1.3500 zone as the current market environment can be ideal for such a break higher, with Oil under pressure and commodity currencies sideways to higher.
In the flip side, a breakdown below 1.3000 psychological support should cancel this positive outlook.