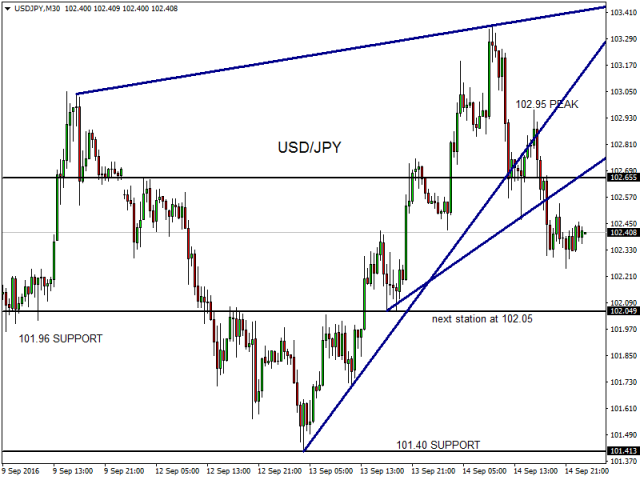
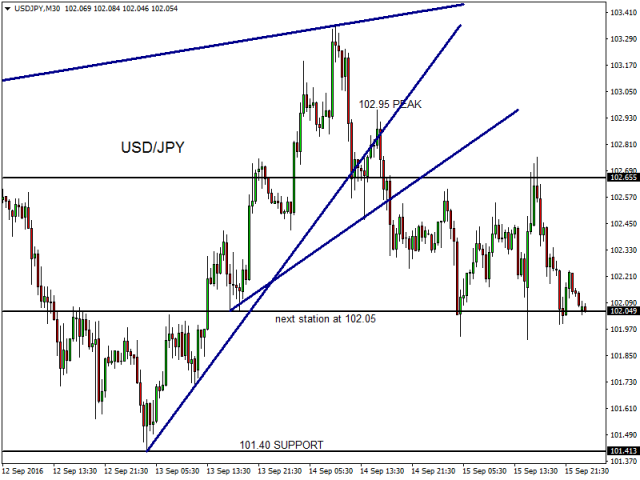
The pair turned lower in the hourly chart as prices failed to overtake 103.35 resistance.
Therefore, another extension lower in the direction of 101.35 support level is likely as far as 102.95 peak is in place.
Looking at the daily chart, the pair found strong resistance near the 61.8% retracement of the entire decline that began from 107.50 peak, which stands at 104.45 level and therefore, a downside continuation is possible in the coming days.
As of now, the bullish momentum seen recently has faded and a daily close below 101.35/20 support zone would be ideal for another sell-off that can reach 100.50 major support.
In the flipside, only a breakout above 103.35 peak will weaken this negative scenario.
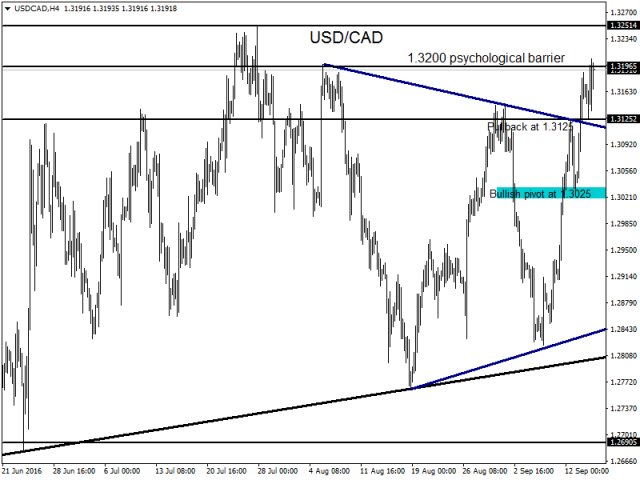
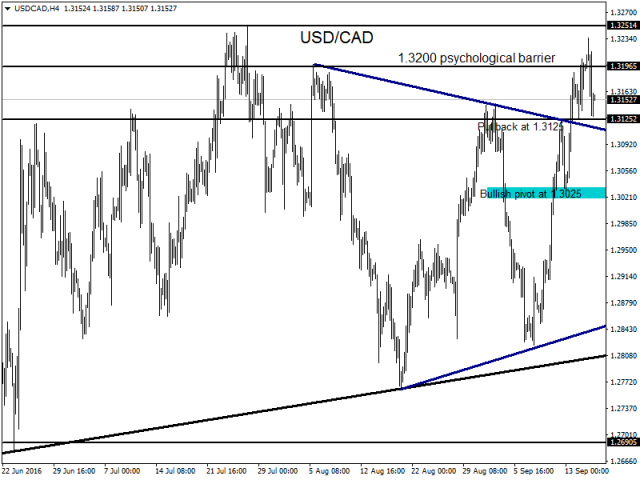
The pair soared recently as commodity currencies entered into a bear market in the short-term. In addition, the sell-off in Oil continue to support the pair and as of now, the focus should be on 1.3250 resistance in the coming days.
Therefore, the downside potential in USD/CAD is likely to remain limited and as far as 1.3025 low is in place, new high can be seen very soon.
However, a downside correction remains possible and should find strong buyers above 1.3120 level as it represents the hourly support.
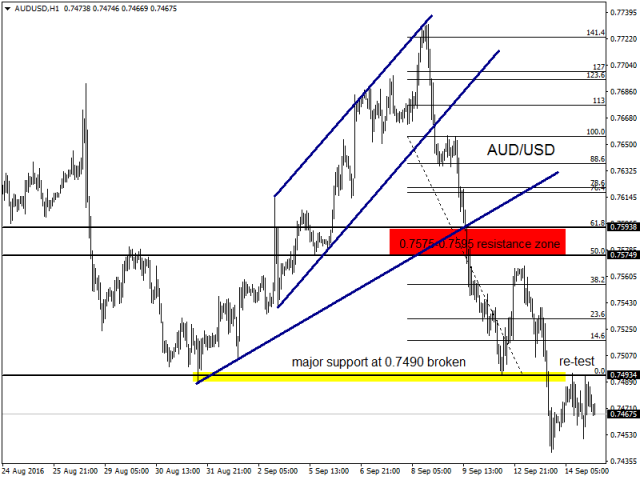
The Australian Dollar ended last week on a negative note as prices have showed a strong shooting star reversal candle in the weekly chart.
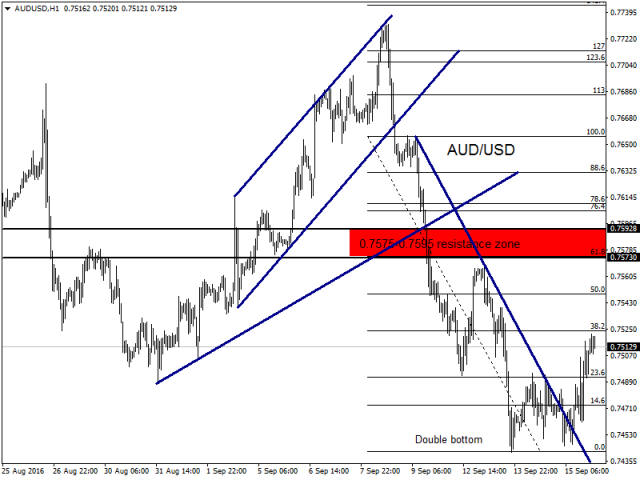
Therefore, a continuation to the downside was highly anticipated as per our previous reports. Effectively, the Aussie dropped sharply after breaking below 0.7495 daily support, which may now act as a strong resistance in the near-term ahead of Australian employment change figures, which will be released overnight.
In the other side, only a daily close above 0.7567 peak will unwind the selling pressure and another jump in the direction of 0.7725 weekly resistance can happen.
In extension, a worse than expected figures may fuel the next wave lower and we can see the pair falling to as low as 0.7420 in the coming hours.
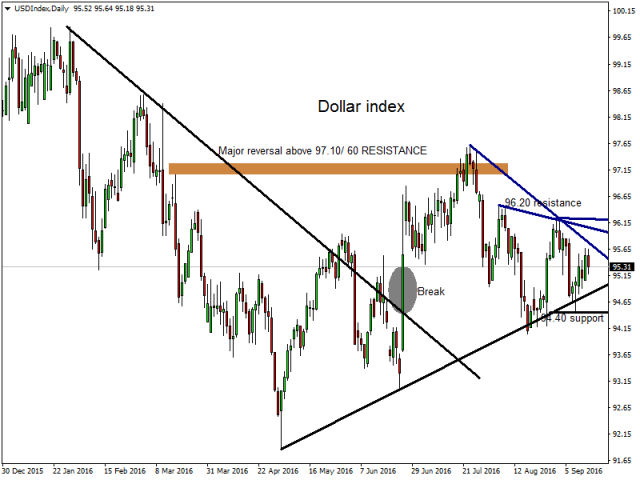
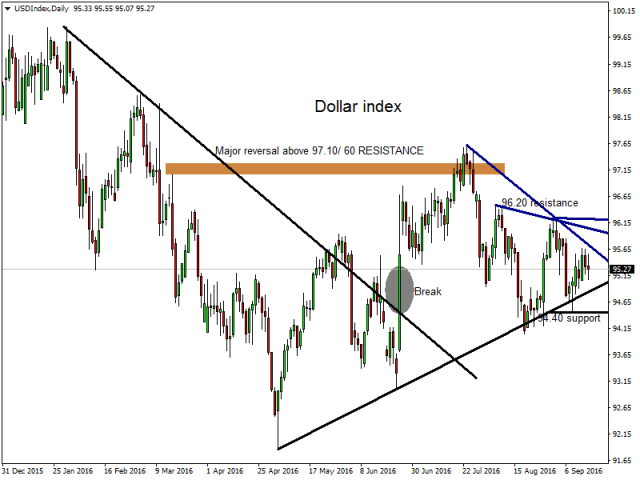
Looking at the U.S Dollar recent price action, the Greenback keep fighting for a clear direction as speculation about the date of the future U.S rate hike intensified.
Technically, prices remain under pressure in the hourly chart, as the index continue to print lower highs from 97.60 peak.
Recently, we have seen strong sellers at the 61.8% Fibonacci retracement of the drop that began from 96.23 peak. Consequently, a move lower towards 94.45 support remain possible for the week ahead.
In the flipside, 96.25-96.50 levels are considered as a strong resistance zone for the near-term price action and the upside potential remain limited below these barriers. From a wider angle, the Dollar keep trading sideways in the weekly chart, as investors remain skeptical about the FED monetary policy. Consequently, volatility can persist in the near-term unless we see a clear break above 96.50 peak or below 94.00 daily support.
Looking at the U.S Dollar recent price action, the Greenback keep fighting for a clear direction as speculation about the date of the future U.S rate hike intensified.
Technically, prices remain under pressure in the hourly chart, as the index continue to print lower highs from 97.60 peak.
Recently, we have seen strong sellers at the 61.8% Fibonacci retracement of the drop that began from 96.23 peak. Consequently, a move lower towards 94.45 support remain possible for the week ahead.
In the flipside, 96.25-96.50 levels are considered as a strong resistance zone for the near-term price action and the upside potential remain limited below these barriers. From a wider angle, the Dollar keep trading sideways in the weekly chart, as investors remain skeptical about the FED monetary policy. Consequently, volatility can persist in the near-term unless we see a clear break above 96.50 peak or below 94.00 daily support.
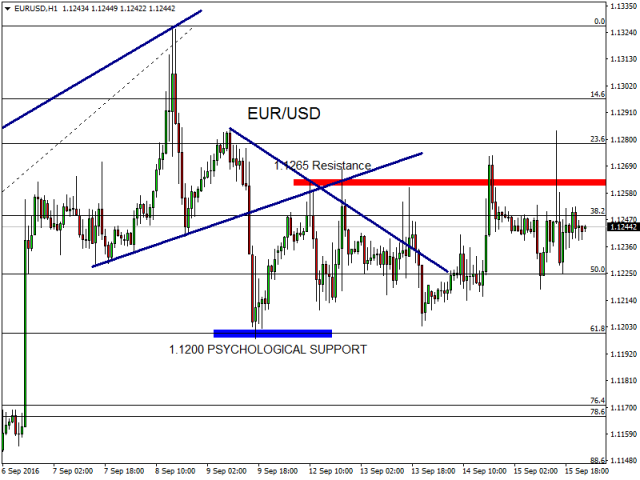
The Euro is about to end the day little changed as the lack of liquidity and economic drivers does not help the single currency to exit from its tight range located between 1.1265 in the upside and 1.1200 handle in the downside.
The Euro made another attempt to overtake 1.1265 hourly resistance but we can clearly see that prices still need additional bullish momentum to create a sustainable breakout.
In the other side,1.1200 handle is considered as the short-term psychological support for the pair, and as far as this level holds, the Euro should remain steady in the coming days. While a daily close below it, should trigger another sell-off and will put the single currency under pressure again.
However, a break above 1.1265 resistance is needed to confirm another rally in the direction of 1.1325/50 zone.
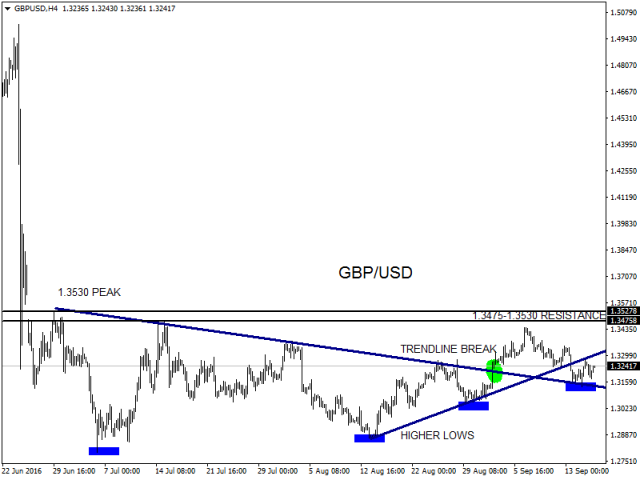
The Sterling traded in a choppy manner today as both bulls and bears continue to fight to overtake the control of the market.
As of our previous report, cable rallied to a high of 1.3272 before to retreat below 1.3200 handle during the U.S trading session.
Actually, prices managed to bounce back again before the daily close, therefore, cable can continue heading to the upside towards the 50% retracement of the entire recovery seen from 1.2865 low to 1.3445 peak, located around 1.3290 level before to begin a new wave lower.
In the flipside, a drop below 1.3178 level should put the pair under pressure again.
To summarize, the Sterling remain positive in the hourly chart as far as prices continue to trade above 1.3140 low.
The pair turned lower yesterday in the hourly chart as prices failed to overtake 103.35 resistance.
Therefore, another extension lower in the direction of 101.35 support level was expected, but looking at today’s price action, the pair remain neutral to slightly bearish below 102.95 peak.
In the daily chart, the pair found strong resistance near the 61.8% retracement of the entire decline that began from 107.50 peak, which stands at 104.45 level and therefore, a downside continuation is possible in the coming days.
As of now, the bullish momentum seen recently has faded and a daily close below 101.35/20 support zone would be ideal for another sell-off that can reach 100.50 major support.
In the flipside, only a breakout above 103.35 peak will weaken this negative scenario.
USD/CAD retreated today for the first session, after a big rally seen in the previous days.
The pair showed a bearish engulfing candlestick, which can lead to a deeper correction to the downside and 1.3107 support level can be the next point of interest in this pair. From a wider angle, 1.3030 low represents the bullish pivot in the 4hour chart and the downside potential is likely to remain limited above this support.
In the weekly chart, traders should be aware that the pair is about to confirm a bullish reversal, which will come with a weekly close above 1.3250 resistance, consequently, after looking at momentum indicators, a big rally can be underway especially if 1.3250 resistance is taken out. Support: 1.3136-1.3120-1.3025
The Aussie managed to bounce on Thursday near the weekly support of 0.7420 as the bearish momentum decreased following Australian employment figures that came out overnight.
Technically, the trend still bullish in the daily chart and as far as 0.7400 psychological support is in place, prices may stabilize in the near future. Regarding the short-term outlook, the Australian Dollar is bearish and any recovery should find strong sellers around 0.7550 area, while in the flipside, a daily close below 0.7440/20 zone should trigger a big sell-off in the coming days.