The pair managed to preserve the psychological support of 100.00 and we have seen a big jump on Friday especially after the strong break above 100.95 resistance level.
Technically, we have seen a strong reaction each time the pair tried to break below 100.00 support. Bank of Japan officials eye this level, and we may continue to see some interventions from time to time around this level. Meanwhile, when looking at the daily chart, the pair keep printing lower highs/ lower lows since 114.90 peak and consequently the upside potential is likely to remain limited.
For the time being, the pair may continue its path in the direction of 99.00 (2016 low) followed by 98.00/97.50 monthly support zone in the coming weeks. This scenario should remain valid as far as prices keep trading below 102.80/103.55 barrier.
However, in the near-term a retracement to the upside remain cannot be ruled out and may target 100.90/101.20 resistance zone before the bearish pressure resume.
The Euro resumed its decline after bears managed to push prices below 1.1240 hourly support. As of now, the trend remain bearish in the near-term, and a continuation to the downside is likely in the coming hours. However, when looking at momentum indicators, the pair is clearly oversold and a bounce can happen soon. Technically, the drop should find strong demand around 1.1110-1.1080, from where we expect to see the beginning of at least three corrective waves higher.
In the daily chart, the single currency remain under pressure below 1.1365 peak, meanwhile, prices are likely to test the 61.8% Fibonacci retracement of the entire recovery that began from 1.0910 low which stands at 1.1085. Consequently, the recent sell-off may slow down once prices get there.
The British pound keep fighting for a clear direction in the near-term and volatility is likely to increase in the coming hours, ahead of the U.S Non-farm payrolls due later this week.
From a technical standpoint, the Sterling remain positive in the hourly chart as far as 1.3025 support is in place. However, the current market environment is in favor of the U.S Dollar, which can keep the upside potential limited in this pair.
In the near-term, the focus should be 1.3070 support as a break below it will bring the bearish pressure and can send the pair to as low as 1.3025 in the next days.
In the flipside, a daily close above 1.3157 level can be the trigger for a move back up towards 1.3170/95 resistance zone will offer fresh selling opportunities for bears and another wave lower to be seen.
After several attempts to break above 1357 hourly resistance that failed, prices succeeded to break below the support zone of $1333/1328 in the daily chart, which cleared the path for a re-test of the daily support of $1305.
Technically, gold turned bearish in the near-term as prices has shown four consecutive lower highs (1375-1367-1357-1342) from the yearly peak of $1375, which reinforces the probability of further weakness in the coming days. As of now, $1325 represents the short-term resistance level and as far as prices keep trading below it, further weakness is here to stay in the coming hours.
To conclude, gold remain under pressure and the upside potential is likely to be limited, while another towards 1300 psychological support is imminent.
Looking at the U.S Dollar price action ahead of the U.S Jobs report scheduled for Friday. The Greenback continue to strengthen as FED rate hike bets increased significantly, the sentiment shifted towards buying the U.S Dollar in the recent days.
Technically, prices overtook 96.00 handle, which keeps the near-term outlook bullish for the U.S Dollar, in addition, the break above this resistance should expose 96.50 area in the coming days, and from where strong sellers may appear. From a larger perspective, the Dollar keep trading sideways in the weekly chart, as investors remain skeptical about the date of the next interest rates hike. Consequently, volatility can persist in the near-term unless we see a clear break above 97.65 peak or below 93.00 weekly support.
Meanwhile, we can see that bulls managed to preserve the higher lows structure that began from 92.95 low, which may lead to further gains in the Greenback especially if a daily close above 96.50 level happens.
The rising optimism over the Fed taking action this year has propelled the Dollar Index above 96.00. This Index is turning bullish on the daily timeframe as prices are trading above the 20 SMA. Previous resistance around 96.00 could transform into a dynamic support which encourages buyers to send prices towards 96.50.
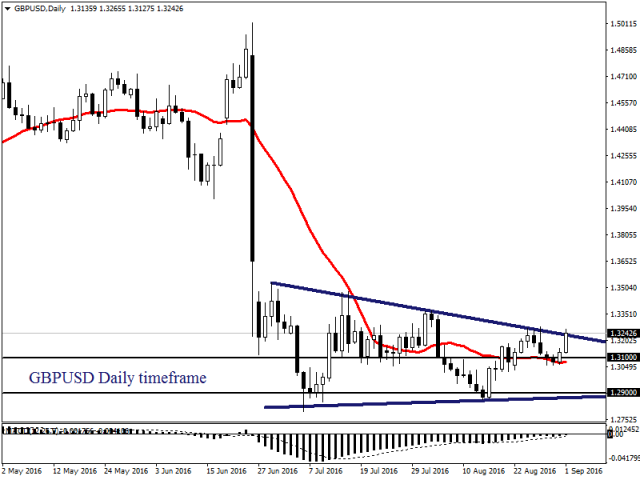
From a technical standpoint, Sterling bulls were offered a lifeline and the GBPUSD has already lurched over 130 pips to the upside. Prices are trading above the daily 20 SMA while the MACD is in the process of crossing to the upside. While bulls may seem to be in control on the daily timeframe, a solid NFP on Friday could swiftly quell the uptrend with prices trading back towards 1.3100.
Technical Outlook for the week ahead 05-09 to 09-09-2016
Technical Outlook for the week ahead 05-09 to 09-09-2016
EUR/USD
The Euro remain one of the weakest currency in the FX Market.
On Friday, the single currency managed to recover some of early last week losses, boosted by a disappointing jobs figures from the U.S.
However, the pair turned sharply lower after reaching a key fibonacci retracement, which stands at 1.1255. When looking at the candlesticks structure in the daily chart, we can see a strong bearish engulfing reversal candle which happened on Friday, consequently, another extension to the downside is likely to resume in the week ahead and prices may fall towards the next daily support, located at 1.1085 level.
In the opposite, only a daily close above 1.1257 peak will cancel this negative view.
Technical Outlook for the week ahead 05-09 to 09-09-2016
Technical Outlook for the week ahead 05-09 to 09-09-2016
GBP/USD
The Sterling rallied strongly after breaking above 1.3300 psychological barrier and managed to extend its gains to as high as 1.3350 level before to end the week few pips below 1.3300 handle, more specifically at 1.3291 level.
Looking at the technical picture, the pair showed a clear increase in the bullish momentum and by now a potential bullish reversal is in place. Meanwhile, we still need a daily close above 1.3370 weekly resistance to confirm this positive scenario.
This barrier represents the last chance for bears and therefore, we can see a downside retracement in the beginning of the week, that can reach around 1.3240 level before the short-term bullish trend resume.
As of now, the pair should keep trading higher in the direction of 1.3370/1.3430 resistance zone as far as prices remain above 1.3127low, while in the short-term the focus will be on 1.3350/70 barriers.
Technical Outlook for the week ahead 05-09 to 09-09-2016
Technical Outlook for the week ahead 05-09 to 09-09-2016
USD/JPY
The pair continue to rally as the bearish momentum faded.
Bulls managed to preserve the 100.00 psychological support and pushed prices above 102.80 barrier, which cleared the path for a big rally in the pair.
Looking at the daily chart, the pair is trading near the 61.8% retracement of the entire decline that began from 107.50 peak, which stands at 104.60 level and therefore, a downside correction cannot be ruled out in the coming days.
As of now, the bullish momentum may slowdown as the pair is about to test a major resistance level located at 104 60.
In extension, a close above this barrier can open the way to as high as 105.65 level, while a dip below 102.80 should weaken this near-term bullish trend.