The USD surged back into focus today as markets were more upbeat about the USD and the prospects for the future. This came on the back of a crypto currency pullback that sent some investors panicking, but for the majority of traders the USD was the big winner today when it came to the bulls. The beige book was also released today, and while nothing major was really said it did note that US growth continues to look steady, and the general outlook for 2018 is increasingly positive for the majority of firms. Adding further to this was of course the US Industrial Production m/m figures which came in at 0.9% (0.45% exp), so more than double what analysts had predicted. It was also a nice turn of events given that the previous month had a reading of -0.12% which put some pressure on the USD.
The standout pair today was of course the USDJPY which shot back up the charts before hitting resistance at 111.113, but in the last hour has managed to break through and is looking all the more bullish. Traders will now be focused on the 200 day moving average which does tend to slow down bullish and bearish pressure, with the prospect of getting to resistance at 111.944 if it does push through the MA. There is also the prospect of a trend line forming as can be seen on the charts so markets will be looking to see if there is much weight in that as well. If the USD sell off does indeed continue though then support levels can be found at 110.202 and 109.385 on the charts, with expectations that it would be hard to reach 109 unless the bears are really taking things apart.
The upcoming news on Australia is also worth watching as well, given that employment figures are due out shortly. Many analysts are expecting the unemployment rate to remain the same, but if we do see a drop it could put pressure on the Reserve Bank of Australia to be more hawkish. One thing that is interesting is also the climb in the AUDUSD, which will most likely get some comments from the RBA regarding the price levels which are well above expectations when it comes to a trade weighted index. So there could be some jaw boning come the next meeting. Nevertheless, for now the focus is certainly on the AUDUSD and the employment figures due out shortly.
A stronger than expected reading could see the AUDUSD shoot up to 0.8123 as risk sentiment has been positive for the AUD so far. Further extensions higher than that are likely to find the next level at 0.8234. Support levels can also be found at 0.7926 and 0.7864 as well, but the 80 cent mark will be a tough ask to beat unless we do see that positive employment data.
The Australian dollar has been doing okay against the USD in recent times on the back of the commodity boom that has been promising. However, there have been some minor hiccups so far with iron ore prices dropping 4.4% overnight on the Asian exchanges. This in theory could present some minor problems for the Australian dollar as exporting of minerals and metals plays a significant impact on the economy. What is most interesting though is the relation to the NZD, with the AUDNZD being a key focus for traders at present. The NZ economy continues to remain robust and it's commodity based exports have seen some value in recent times with the global dairy auctions as of late. Add in the fact that the recent services PMI was also positive and you have a strong combination for the NZ economy and of course the NZD. The Reserve Bank of New Zealand is also undergoing some reforms but so far these have not frightened of the market.
So for the AUDNZD it's a case of the bigger neighbour struggling against the smaller one on the currency chart. So far we've got a strong trend line pushing the bears down the chart and stopping and bullish activity taking hold, add into the mix a very strong support level and it's likely we will see some volatility look to break out of the flag pattern here. Resistance can be found at 1.0933 and 1.0982 on the charts, but I would be mainly focused on the trend line which will likely stop any bulls becoming too aggressive. Support levels are looking interesting, with 1.0855 the level to beat for the market as this is a strong level, anything through this could touch on 1.0809. Going below any of these levels could be a hard mask for the market though at present as the AUD is a bigger economy, so it could dig itself out of a hole compared to its neighbour. It's also worth remembering that the AUDNZD is at a low when you look over a very long time frame.
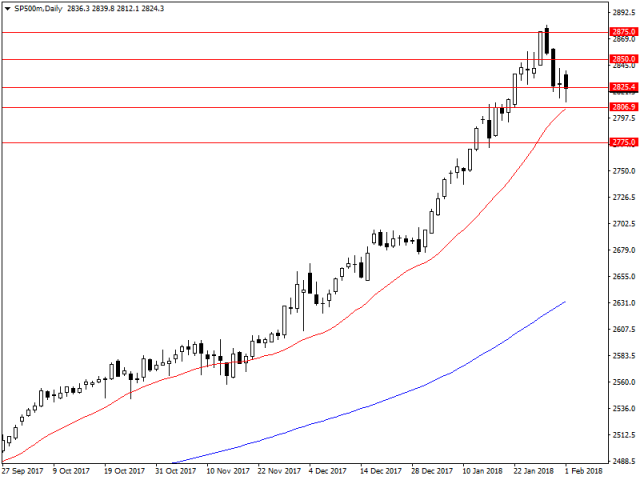
Once again it's been another great day for US equity markets as they climbed the charts hitting record highs again. So far the S&P 500 is not looking like it will stop and the NASDAQ continues also to be a great runner as well. For the bulls it seems that the Trump effect is shining on further more in these markets.
Looking at the S&P 500 and it has climbed up to resistance at 2850 before taking a breath. Expect markets to look to tackle the level again tomorrow if there are no curve balls. Any extension above 2850 is likely to find some further resistance at 2875. Markets will also be looking at possible support levels as well, and they can be found at 2825 and 2809 in the current market climate.
The USD took another beating today which saw nearly all major pairs and commodities climb sharply as a result. This is not surprising given the recent data which saw US existing home sales m/m fall to 5.57M (5.7M exp) from the previous high of 5.78M, showing that there may be some slowdown in the housing market. US PMI for services was also lagging expectations coming in at 53.3, still showing expansion but at the same time not coming in where analysts had expected. There could be some good news on the horizon though with Trump expected to talk up his infrastructure plan at the state of the union and lay the foundation for further spending in order to bolster the economy. However, there is a danger that it could cause it to overheat as he looks to be bold and put his front foot forward. The real story though is that right now the USD continues to come under fire, and for the market this is causing large volatility.
One of the big movers today for me was gold which sky rocketed up the charts and pushed past the previous 2017 high. It's always ominous when gold starts becoming more and more bullish but at present this is being caused by the weaker USD and resistance at 1349 was absolutely crushed today as gold whooshed past. The next levels of resistance can be found at 1366 and 1375, with 1375 likely to be a key target level for traders. Anything above this would suddenly get the market a little worried I feel, as gold is always the hedge for recessions and inflation. Support levels in the event the bears catch can be found are at 1349 and 1336, with further potential to dip lower to 1314 if the bears do manage to take hold. All in all though, if the USD weakness continues gold could be swinging higher in no time through no fault of its own.
The New Zealand dollar has got a large shock today on the back of a weaker than expected inflation report. NZ CPI figures for Q4 came in sharply down at 0.1%, expectations were for 0.4%. Pushing the Yearly figure to 1.6%, a large shock for the previously booming economy. This will certainly put pressure on the Reserve Bank of New Zealand to pause when it comes to thinking about pushing rates higher in the economy - despite the high level of employed and wage growth at present.
The NZDUSD on the charts quickly pushed back from resistance at 0.7431 as the news filtered through for the CPI figures. Support levels can be found at 0.7324 and 0.7255 at present, with the market also likely to treat the 20 day moving average as support as well. If the USD does gain momentum then we could see some very serious bearish pressure, at the same time if it does remain weak then potentially the NZD could stay elevated despite the recent economic news, so the market focus will be on USD data after this with a bearish bias.
It's been a mixed day for the USD, but it has seen some respite from the relentless selling as of late. With Trump in Davos it has meant more positive than controversial from him, as he puts the gloss on with world leaders. However, economic data continued to be mixed and not necessarily positive, as US new home sales m/m dropped to 625K (675K exp) , this is a -9.3% drop on the previous month. So not positive at all. The big ray of light though, was that the US job market continues to thrive and tick over, with US jobless claims coming in at 233k (235K exp), showing that the labour market is still the major story when it comes to positivity. The consumer market though will be a key focus for the incoming chair Powell as any movements here are likely to have big impacts, but also could point to future inflation rates and the chance to lift rates higher, as 2018 is set to be the year of hikes I feel for the FED.
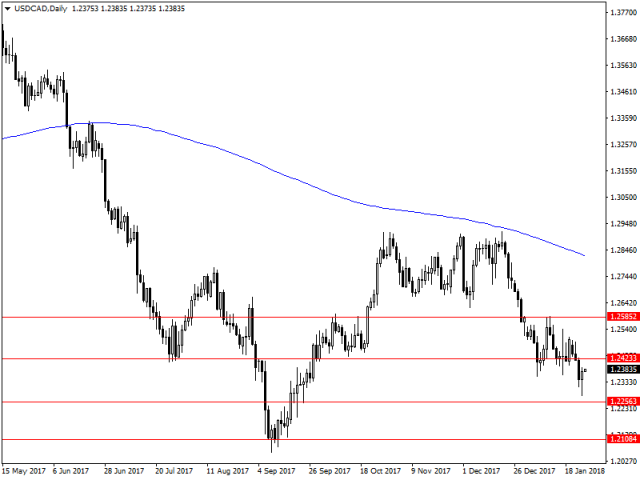
For me the USDCAD is still in the focus when it comes to bearish movements at present, the reason being that oil prices have risen higher and the USD continues to fall. All the while the Canadian economy is not doing so bad either on the back of stronger commodity prices. As a result the bears have been chipping away forcing it lower, and support at 1.2256 is likely to be in the cross hairs for traders drifting lower, followed by 1.2108. If the bulls do come back into the market then resistance levels at 1.2423 and 1.2585 are likely to come under some pressure. However, the recent market conditions have not warranted any serious bullish pullbacks as of late.
Meanwhile it could be more trouble in the United Kingdom, as news has come out that there might be further political revolting in Theresa Mays Tory party. This is not likely to topple the prime minister, but it does show the growing discontent within the party relating to current Brexit negotiations. The flow on effect for the pound of such events has been negative, with it taking some heat today and losing ground against the USD. It's likely that tomorrow will bring further news, but if none then the market is likely to focus on US GDP figures when it comes to moving the GBPUSD.
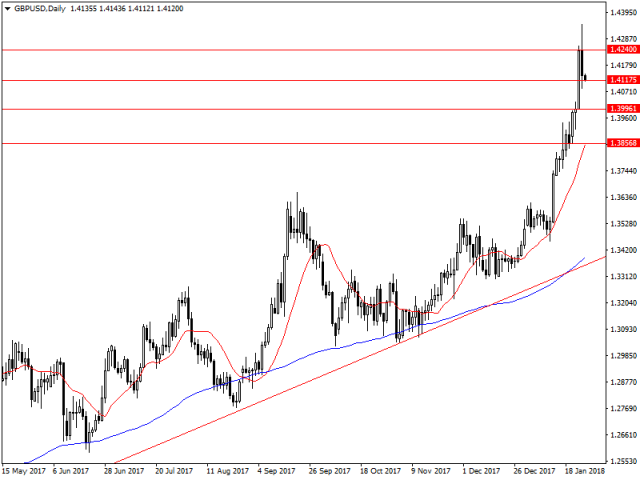
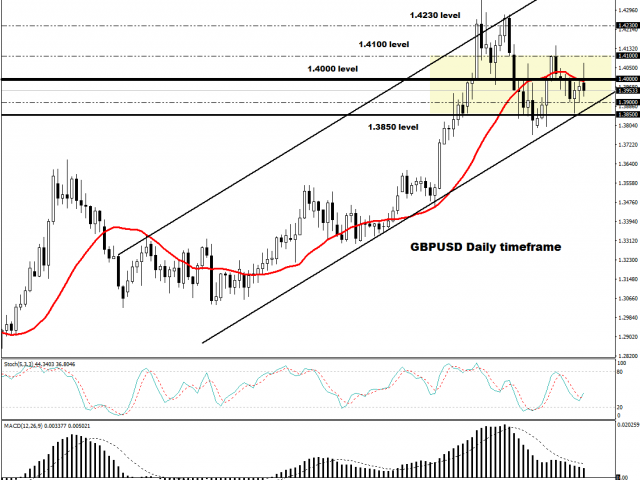
The GBPUSD though is currently caught on support at 1.4117 with the market looking to find some breathing space before continuing. I would expect the bulls to either take another big run, or the bears to take a firm hold and drive it back down from the recent volatility. Resistance can be found at 1.4240 and this will be the key level at present. Support levels can be found at 1.3996 and 1.3856 is the GBPUSD continues to find itself under bearish pressure.
New Video from FXTM Market Update with Research Analyst ForexTime, Lukman Otunuga
Global stocks were under pressure on Tuesday as investors remained cautious ahead of the Federal Reserve meeting. The Dollar struggled to hold ground against a basket of major currencies while Sterling was bruised by Brexit jitters. In the commodity arena, Gold benefitted from a vulnerable Dollar. The main event risk today will be BoE Mark Carney’s testimony and CB Consumer confidence for the United States.
- The #EURUSD remains bullish on the daily charts - #GBPUSD is currently towards 1.4175 - #Gold bulls are eying $1360
The market is currently taking a breather after the US data today as it's almost time for non-farm payroll. Markets previously have been surprised by the recent swings in the labour market, especially with wage growth not matching the pace, but analysts and economists are now expecting wage growth to pick up, and this in turn could lead to a more aggressive hawkish Fed if that is the case. The Fed has always commented on the lack of wage growth being a key factor in holding it back, but if we were to see that growth then certainly there would be a case for further future hikes at a more aggressive pace. Analysts are expecting 180k, the reality could be much lower, but whatever the case there will be some large swings.
The USDCAD has been a key one for me to watch as of late with all the USD weakness we've seen. Commodities have risen in value as a result, and none more so than oil which has lifted on the back of it. At the same time the NAFTA treaty negotiations are looking positive thus far, and the Canadian economy is positive all round about expectations for further growth. The Bank of Canada has been a little bit more neutral, but that's more to take pause and look at its southern neighbour the US more than anything else.
So far the USDCAD has slipped lower to support at 1.2256 and is looking to extend even lower to 1.2108. While a bit of a slow mover it has been trending fairly reasonably so markets have taken notice and played on that accordingly. If the USD did see some strength from the bulls then resistance at 1.2423 and 1.2585 would be key targets for the market to move to. I still believe that if there were any bulls in this market that the 200 day moving average would be the real test, as the market has been quick to bounce of it and give up and bullish sentiment in the previous months.
The S&P 500 has shown another day of losses on the charts which is quite rare, so much so that people have taken a fair degree of notice. In part this has been driven by the rise in treasury yields which is starting to look like it could compete in the future with the current rates of return from equity markets. Expectations still continue to mount that the market may be slightly overbought and this may be a correction.
For me the S&P 500 is a great technical mover and this can be seen from the levels it plays off. One of the most important things though at present is the 20 day moving average which has been a sign of bullish action lately. Support can be found at 2825, 2806 and 2775, but I would mainly focus on the moving average. Resistance can be found at 2850 and 2875 in the current market climate.
Markets have been hot and cold today as equities saw some intense volatility. For most, it was the beginning of the end at the start of the week, but the close of Tuesdays bell in the US has been so far fairly bullish. Many in the market had been expecting further falls, but so far most investors have been quick to push back on the basis that macroeconomic indicators are still strong, and there is no deterioration compared to 2008 which saw heavy falls as a result. I'm inclined to agree at this statement given the history of the markets and of course that for most economies they're looking to lift rates and cut back QE. There has been of course some minor wobbles with the US economy and Europe in the past, but so far it's full steam ahead and yields are looking good.
The S&P 500 had a crazy day today and it would not have been for the faint hearted as the market looked to dive deeper, pushing all the way down to the 200 day moving average before starting to make a solid recovery. The 100 day moving average was ignored on the way up, but that's not surprising given the aggressive nature of these moves, but nonetheless technical's did come into play with the market hitting resistance at 2698 to pause and breath. The next level up for the bulls if they get to continue will be at 2743. Support levels if the market were to turn can be found at 2628 and 2564, but the major one will be the 200 day moving average which has so far managed to beat back the bears on such an aggressive day of volatility. I would be surprised to not see the same sort of aggressive volatility tomorrow as markets prepare for another big day again.
Across the Atlantic in European markets the FTSE has been hammered in the previous week, but finally clawed back some major gains in line with the rest of the globe in the evening. For a while it looked like a bullish trend line may come into play, but the Monday sell-off put that out of the question and the bears took full control. The recovery today, however, was very strong and saw the market climb back up to support at 7278 as traders looked to breath - much like the S&P 500. I would be surprised to see further gains here for the FTSE as UK equities have not been as impressive on the back of Brexit. So we could see resistance levels really push back bulls in the market. On the other hand sharp drops to 7205 and 7100 are not off the cards if the bears can really get there claws back into the equity markets at present.
All in all, at present the global equity markets present a unique opportunity, but a lot of risk when it comes to the amount of volatility. Movements like these are rare and powerful, but for traders they can come with heart palpitations.
Global shares extend recovery; dollar remains weak
Asian equity markets continued to build on last week’s gains, after U.S. stocks capped their best week since 2013. Investor sentiment has gradually improved after fears of rising inflation sent most global indices into correction territory. The Cboe’s Volatility Index (VIX) ended Friday’s session below 20, suggesting that indictments from Special Counsel Robert Mueller against 13 Russian nationals for alleged interference in the 2016 elections did little to impact investor decisions. With the U.S. markets closed on Monday for President’s Day and the Greater China region remaining offline for the Lunar New Year, expect trading volumes to be below average.
The U.S. Dollar’s weakness remained a bit of a mystery for many currency traders, as it is supposed to follow differential in yields. The gap between U.S. and German 10-year yields widened to 217 basis points, and had gained 28% since mid-July 2017. Similarly, U.S. – Japan 10-year yields widened 285 basis points, the highest increase since 2007. Still, the Dollar declined against the Euro, Japanese Yen and all other major currencies.
One explanation for why the correlation between the Dollar and yield differentials has broken recently, is that financial market participants are forward-looking. Investors believe that rising inflation in the U.S. will spread to other economies, leading to tighter monetary policies elsewhere. When major central banks such as the European Central Bank, Bank of England and Bank of Japan begin normalizing policies, rate differentials will narrow at a fast pace, given that they are starting from a very low base.
Yields in the U.S. are not just rising because of higher inflation expectations, but also due to rising twin deficits – the fiscal and current account. This should make U.S. debt less attractive, and gold will likely become the primary beneficiary as it continues to benefit from inflationary pressures and budget deficit worries.
However, this view may change if the Fed decides to take a more aggressive approach in fighting inflation. Wednesday’s FOMC minutes will likely reveal fresh hawkish insights, but for the dollar to make a U-turn, it requires the Fed to tighten policy faster than previously estimated. Any indication of four rate hikes instead of three in 2018 will do the trick, but this is unlikely to appear in Wednesday’s minutes, and investors will probably need to wait until the March meeting.
The Canadian dollar has come back sharply into focus today, as retail sales data disappointed the market. While the figure of -0.8% m/m was much worse than expected at -0.1% m/m, the Canadian dollar still managed to claw back some ground after the fall. The reason being that despite the fall today Canadian sales y/y remain high, up 6.7% for the year which indicates that the economy for the most part is doing well. This is also in line with oil prices remaining elevated as well, which in turn is helping to driving the Canadian economy quite heavily at present. The small hiccup we've seen with retail sales will be noted by the Bank of Canada, but for the most part I am still optimistic we will see some lifts in interest rates in the year coming, otherwise the economy may overheat.
For the USDCAD it remains elevated in the current market, and today's negative news did dampen spirits for it climbing higher. The bullish move became unstuck though at the 200 day moving average as traders looked to exit at this point. If the USDCAD continues to rise then I would expect that the next targeted level of resistance will be at 1.2800, with the hard level being found at 1.2921. Any movements above the 1.2921 would be hard to sustain in the current market climate I feel, unless the USD really starts to come back into vogue and markets become a lot more bullish. If the CAD does become bullish again and the USDCAD becomes bearish then I would anticipate support to be found at 1.2585 and 1.2423 on the chart. However, at this present time the USDCAD is trending nicely and the trend is always your friend.
Oil has bounced back today on the back of some positive news out of the US markets, with Crude inventories showing a drawdown of -1.62M barrels (2.9M exp). This is positive as many had expected to see a rise in surplus, so traders were quick to jump on the back of oil and push it higher as a result. Gasoline and Distillate inventories were also showing signs of a drawdown with Gasoline being the only one to publish a surplus at 0.26M. While the US continues to look to produce more oil, it seems that the economy is starting to consume more, thus being positive for the upside for oil. However, it still weighs heavily on OPEC controlling production still at this stage.
On the charts oil was quite bullish today as the last two days of losses were quickly erased by the bullish movement. The 20 day moving average was also cracked as traders rushed higher on the news, however it needs to close above for me to feel confident about further bullish moves, as a close above would enable tomorrows candle to use it as dynamic support. In the event of movements higher, 63.25 is the next level of resistance, while 66.05 is the long term target for bullish oil traders in the market. If we see further falls then 61.00 is likely to act as support in this scenario, but it will be a hard level to beat at present.
Sterling initially entered the trading week on a solid footing following hawkish comments from Bank of England (BOE) deputy governor sir Dave Ramsden.
In a Sunday time’s article over the weekend Ramsden said “Relative to where I was, I see the case for rates rising somewhat sooner rather than somewhat later”. The firmly hawkish comments swiftly reinforced market expectations of an interest rate hike in May. With the Pound sensitive to monetary policy speculation, the prospects of higher UK interest rates in 2018 simply injected bulls with a renewed sense of confidence to attack on Monday morning. Interestingly, the British Pound eventually found itself under fresh selling pressure in the afternoon as bears re-entered the scene.
From a technical standpoint, the GBPUSD punched above the 1.4050 level during early trading on Monday. A touch of Dollar weakness fueled the upside with prices eventually peaking around 1.4069 before sinking back below 1.4000 as of writing. Daily bulls need to maintain control above the 1.4000 level for the GBPUSD to challenge 1.4100 and 1.4230, respectively. A failure for prices to keep above 1.4000 could result in a decline back towards 1.3900 and 1.3850.
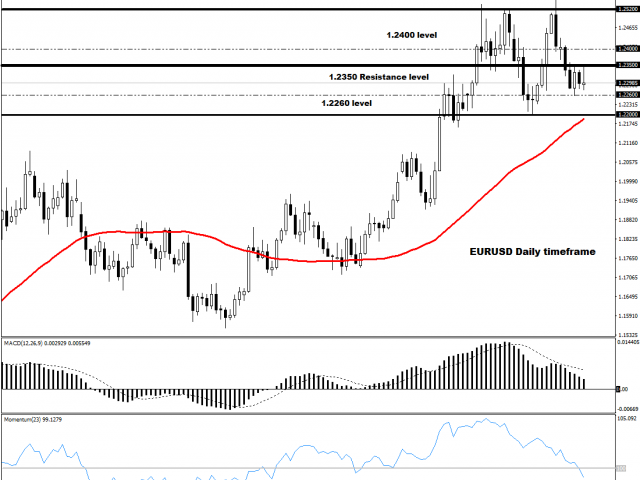
EURUSD blocked by 1.2350 resistance level
Euro bulls have been halted on repeated occasions by the stubborn gatekeeper known as 1.2350.
Although the EURUSD remains fundamentally bullish, the currency pair is at risk of sinking lower if bulls fail to conquer and break above the 1.2350 level. Taking a look at the technical picture, there have been consistently higher highs and higher lows while the MACD trades to the upside. With the daily candlesticks trading comfortably above the 50 Simple Moving Average, a breakout seems imminent. If bulls are able to break above 1.2350, then the next key levels of interest will be at 1.2400, 1.2430 and 1.2520, respectively. Alternatively, sustained weakness below 1.2350 could encourage a decline back towards 1.2260 and 1.2200.
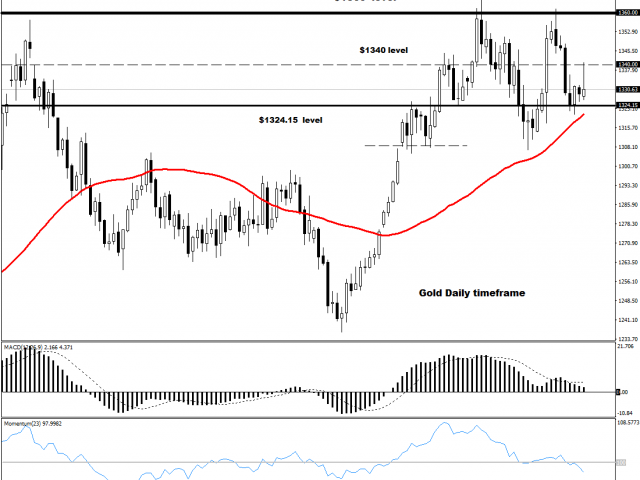
Commodity spotlight – Gold
Gold struggled to maintain gains during Monday’s trading session thanks to a stabilizing Dollar.
It is becoming clear that market expectations of higher US interest rates have exposed the yellow metal to downside risks. It must be kept in mind that Gold is zero-yielding, and is likely to remain pressured in a high interest rate environment. Technical traders will continue to observe how the yellow metal behaves around the $1340 region. Sustained weakness below $1340 could encourage a decline back towards the $1324.15 level. Alternatively a decisive breakout and daily close above $1340 may open a path higher towards $1360.
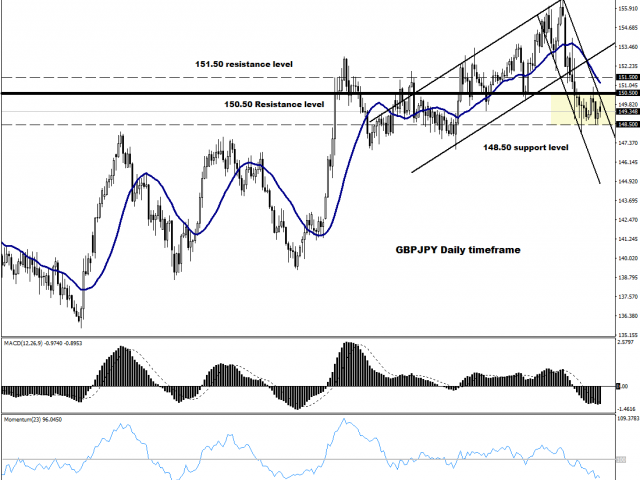
Currency spotlight – GBPJPY
The notoriously volatile GBPJPY ventured towards the 150.00 level during early trading on Monday.
Price action suggests that the currency pair is under pressure on the daily charts with 150.50 acting as the first level of interest. If prices are unable to break above the 150.50 level, then bears could be inspired to drag the GBPJPY lower towards the 148.50 support regions. A breakout above 150.50 simply invalidates the current downtrend and suggests that prices could test 151.60.