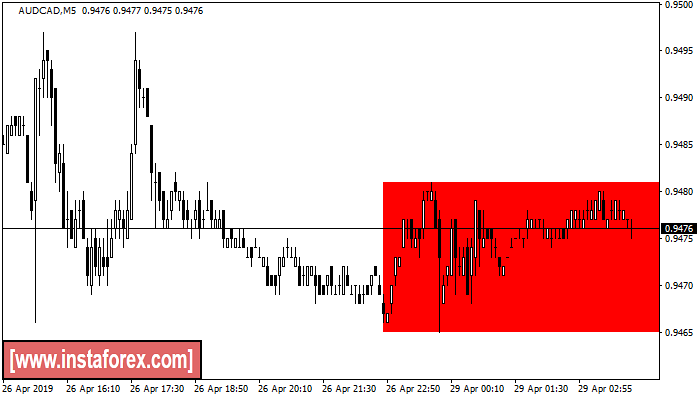
Bullish Rectangle
was formed on 29.04 at 01:02:19 (UTC+0)
signal strength 1 of 5
According to the chart of M5, AUDCAD formed the Bullish Rectangle. The pattern indicates a trend continuation. The upper border is 0.9481, the lower border is 0.9465. The signal means that a short position should be opened after fixing a price below the lower border 0.9465 of the Bullish Rectangle.
The M5 and M15 time frames may have more false entry points.
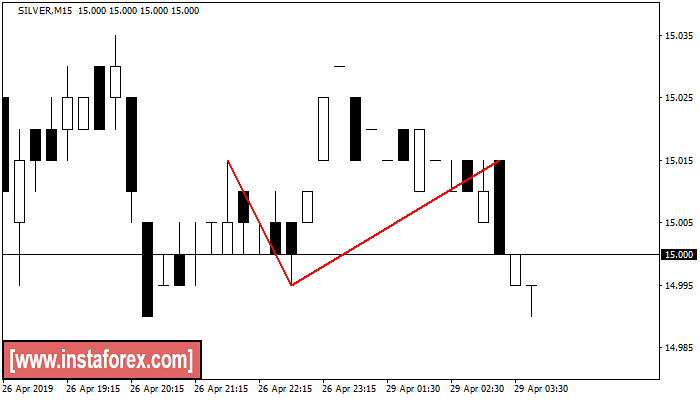
Double Top
was formed on 29.04 at 01:02:56 (UTC+0)
signal strength 2 of 5
The Double Top pattern has been formed on SILVER M15. It signals that the trend has been changed from upwards to downwards. Probably, if the base of the pattern 14.99 is broken, the downward movement will continue.
The M5 and M15 time frames may have more false entry points.
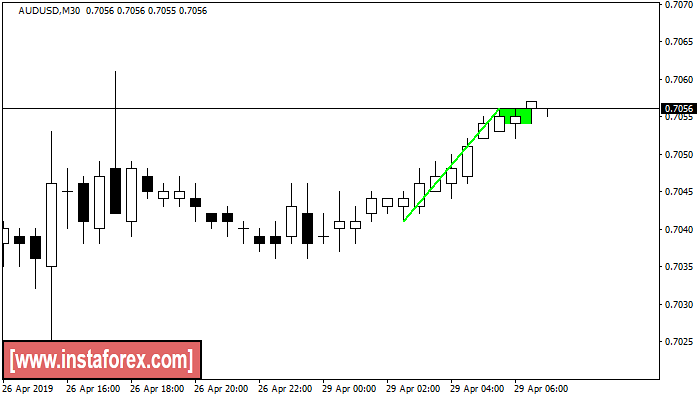
Bullish Flag
was formed on 29.04 at 04:01:09 (UTC+0)
signal strength 3 of 5
The Bullish Flag pattern which signals continuation of a trend has been formed on the chart AUDUSD M30. Forecast: if the price breaks above the pattern high at 0.7056, then traders will be able to place a long deal with the target at 0.7086.
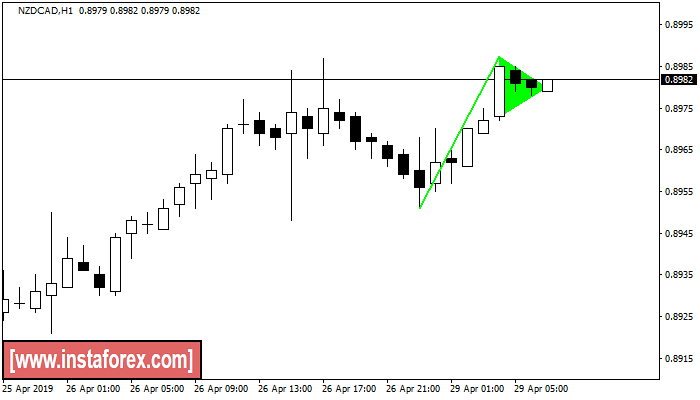
Bullish pennant
was formed on 29.04 at 04:25:13 (UTC+0)
signal strength 4 of 5
The Bullish pennant graphic pattern has formed on the NZDCAD H1 instrument. This pattern type falls under the category of continuation patterns. In this case, if the quote can breaks out high, is expected to continue the upward trend to level 0.9028.
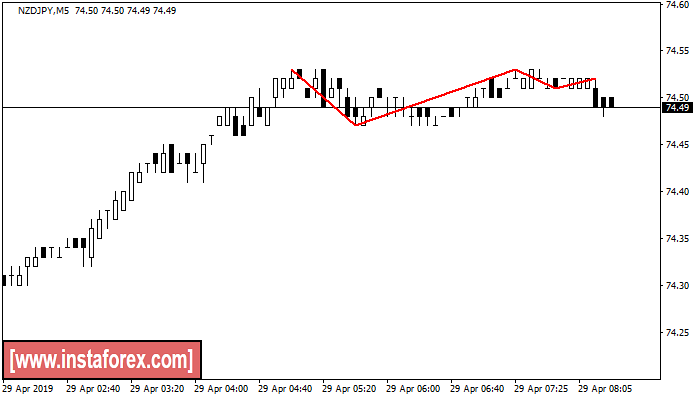
Triple Top
was formed on 29.04 at 05:28:01 (UTC+0)
signal strength 1 of 5
On the chart of the NZDJPY M5 trading instrument, the Triple Top pattern that signals a trend change has formed. It is possible that after formation of the third peak, the price will try to break through the resistance level 74.47, where we advise to open a trading position for sale. Take profit is the projection of the pattern’s width, which is 6 points.
The M5 and M15 time frames may have more false entry points.
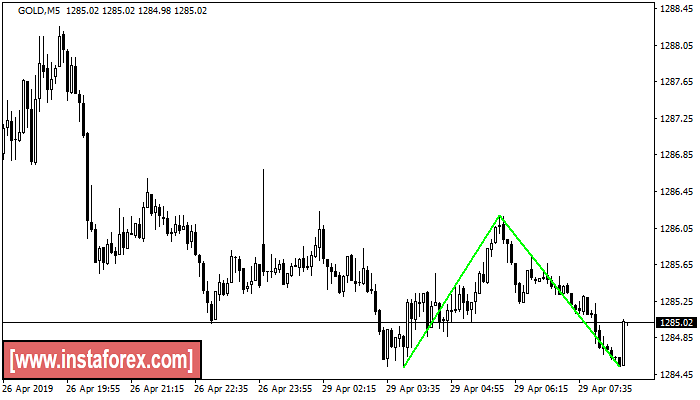
Double Bottom
was formed on 29.04 at 05:35:40 (UTC+0)
signal strength 1 of 5
The Double Bottom pattern has been formed on GOLD M5; the upper boundary is 1286.19; the lower boundary is 1284.54. The width of the pattern is 166 points. In case of a break of the upper boundary 1286.19, a change in the trend can be predicted where the width of the pattern will coincide with the distance to a possible take profit level.
The M5 and M15 time frames may have more false entry points.
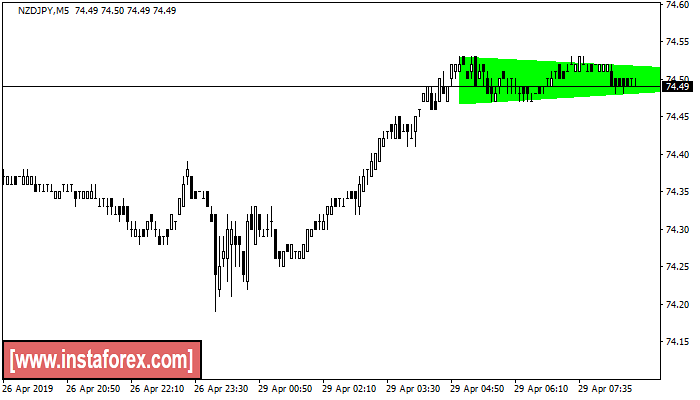
Bearish Symmetrical Triangle
was formed on 29.04 at 05:46:33 (UTC+0)
signal strength 1 of 5
According to the chart of M5, NZDJPY formed the Bearish Symmetrical Triangle pattern. This pattern signals a further downward trend in case the lower border 74.53 is breached. Here, a hypothetical profit will equal the width of the available pattern that is 6 pips.
The M5 and M15 time frames may have more false entry points.
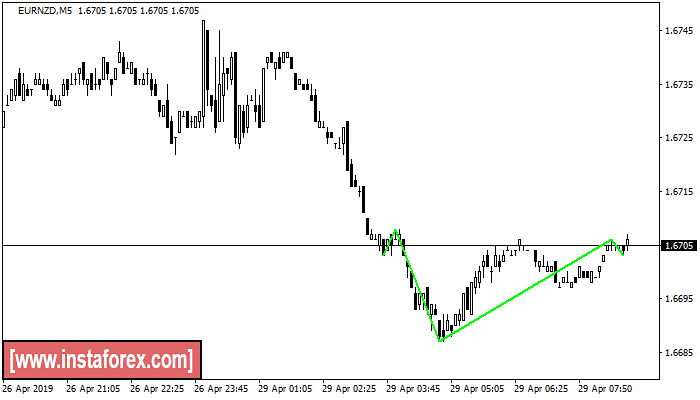
Inverse Head and Shoulder
was formed on 29.04 at 05:55:54 (UTC+0)
signal strength 1 of 5
According to M5, EURNZD is shaping the technical pattern – the Inverse Head and Shoulder. In case the Neckline 1.6708/1.6706 is broken out, the instrument is likely to move toward 1.6721.
The M5 and M15 time frames may have more false entry points.
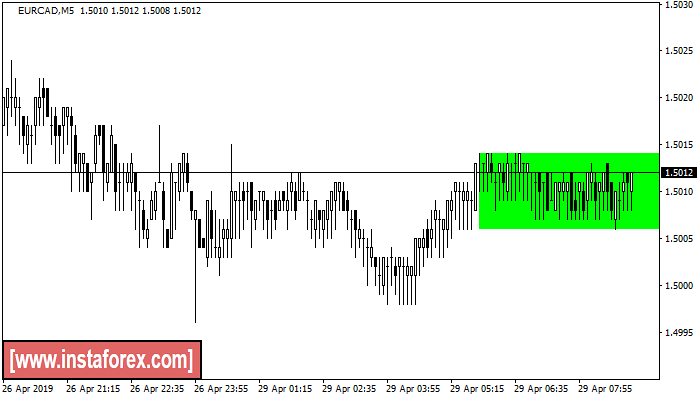
Bearish Rectangle
was formed on 29.04 at 06:01:00 (UTC+0)
signal strength 1 of 5
According to the chart of M5, EURCAD formed the Bearish Rectangle which is a pattern of a trend continuation. The pattern is contained within the following borders: the lower border 1.5006 – 1.5006 and upper border 1.5014 – 1.5014. In case the upper border is broken, the instrument is likely to follow the upward trend.
The M5 and M15 time frames may have more false entry points.
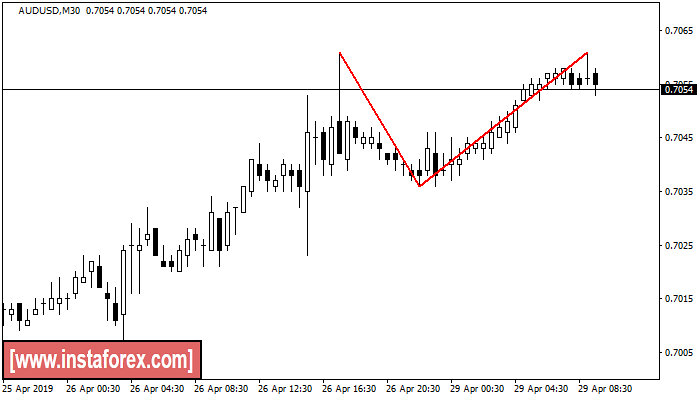
Double Top
was formed on 29.04 at 07:00:36 (UTC+0)
signal strength 3 of 5
The Double Top reversal pattern has been formed on AUDUSD M30. Characteristics: the upper boundary 0.7061; the lower boundary 0.7036; the width of the pattern is 25 points. Sell trades are better to be opened below the lower boundary 0.7036 with a possible movements towards the 0.7006 level.